同震地表破裂及活动断层迹线的几何形貌特征
郝海健, 何宏林*, 魏占玉, 石峰
中国地震局地质研究所, 活动构造与火山重点实验室, 北京 100029
*通讯作者: 何宏林, 男, 研究员, E-mail: honglin@ies.ac.cn

〔作者简介〕 郝海健, 男, 1987年生, 2011年于鲁东大学获地理科学专业学士学位, 2014年于中国地质大学(武汉)获构造地质学专业硕士学位, 主要从事活动构造和构造地貌学研究, 电话: 010-62009031, E-mail: zhetian-1.1@163.com

摘要

天然断层面的几何形貌特征中隐含着大量与断层演化和破裂机制相关的信息, 准确描述断层面的形貌特征对于认识断层的形成与发展, 及其破裂过程具有重要意义。文中运用能谱密度分析方法, 对全球52条同震地表破裂和300条活动断层的地表迹线数据进行分析和归纳, 结果显示: 1)它们的平均能谱密度曲线在频域上具有明显的3分段特征。在低频域, 能谱密度曲线特征表征了km级以上尺度的构造块体边界的形貌特征; 在中频域, 则受到hm—km级尺度上的断层横向扩展、 次级断裂的贯通以及地形因素的控制; 在hm尺度上的拐点代表了重采样的有效长度, 在hm级以下尺度的高频域, 能谱曲线特征受到数据插值方法的控制; 2)在km级以下尺度, 同震地表破裂的能谱密度曲线显示3种破裂类型的断层迹线粗糙度之间存在明显差异: 逆冲型>正断型>走滑型, 这表明在该尺度范围内的破裂迹线几何形貌特征差异主要受破裂类型的控制; 3)与同震地表破裂相比, 活动断层迹线的能谱密度明显偏低。这表明随着破裂次数增加、 断层活动历史增长, 断层的粗糙度会逐渐减小, 即粗糙度与成熟程度成反比。

关键词: 同震地表破裂; 活动断层; 能谱密度; 断层粗糙度
中图分类号:P315.2 文献标志码:A 文章编号:0253-4967(2017)06-1267-16
GEOMETRIC CHARACTERISTICS OF CO-SEISMIC SURFACE RUPTURES AND ACTIVE FAULTS
HAO Hai-jian, HE Hong-lin, WEI Zhan-yu, SHI Feng
Key Laboratory of Active Tectonics and Volcanology, Institute of Geology,China Earthquake Administration, Beijing 100029, China
Abstract

Fault traces contain abundant information associated with the fracture process and mechanism, so an accurate and quantitative description of their geometric characteristics is of great significance to perceiving the generation and development of faults. We collected 52 co-seismic surface ruptures and 300 active fault traces from across the world to analyse their geometric characteristics by the method of power spectrum density. Our results show that(1)the average power spectrum density has a distinct three-segment charateristic in the frequency domain. In the low frequency domain it represents the geometric characteristics of the boundary of tectonic block. In the medium frequency domain, the power spectrum density reflects the processes of lateral growth and connection of secondary faults, and the turn point on the 100 meters scale represents the effective resampling length, below which the power spectrum density characteristics are meaningless.(2)In the middle and high frequency domains, the power spectrum density curves of co-seismic surface ruptures show that there are obvious differences in roughness among three fault types, i.e. reverse>normal>strike-slip, which indicates that the geometric characteristics of co-seismic surface ruptures are controlled by the fault types.(3)Compared with co-seismic surface ruptures, active fault traces have much lower power spectrum density, indicating the roughness of active fault traces becomes lower with increasing numbers of rupturing events and the lengths of active history, i.e., the fault roughness is inversly proportional to its maturity.

Keyword: co-seismic surface ruptures; active faults; power spectrum density; fault roughness
0 引言

包括走向、 倾向和倾角3要素的产状是描述断层面空间几何特征的基本参数, 结合断层面上其他的一些基本形貌特征, 如起伏、 擦痕、 阶步等, 构成描述断层面运动学特征的基本要素。但是, 断层产状仅仅描述了断层面规则的、 简单的、 可解析的欧式几何形状, 偏离欧式几何形状的随机起伏部分却被简化或忽略了。实际上, 断层面形貌特征与断层的摩擦过程相关, 直接影响着断层活动和地震研究的方方面面, 如摩擦行为的本构关系(Tullis et al., 1986; Scholz, 1988, 2002; Dieterich et al., 2009)、 断层几何结构与断层分段(Aki, 1984; King et al., 1985; Sibson, 1985; Okubo et al., 1987)、 断层带演化和成熟度(皇甫岗, 1988)、 断层泥生成(Scholz, 1987; Power et al., 1988)和润滑作用(Brodsky et al., 2001)、 破裂成核(Lay et al., 1982)与终止(Aki, 1984)、 近断层应力场(Chester et al., 2000)等。所以, 仅用产状等参数简单描述断层面的空间几何结构和运动特征已经不能满足研究的需要, 更加精确地定量描述断层面的几何和形貌特征已成为断裂力学和地震力学等学科的迫切需求。

现阶段, 人们对断层面形貌学的关注和研究集中在实验室内微观和手标本的尺度(μ m— cm级)上(Power et al., 1988, 1991; Lee et al., 1996)以及野外露头的尺度(m级)上(周枝华等, 2005)。对于整条断裂带宏观尺度的认识与研究程度还存在不足, 对宏观尺度数据的量化分析和其潜在意义的挖掘不够充分, 对于不同破裂类型的破裂迹线所表现的形貌特征差异也有待研究。直观上, 我们很容易识别出不同类型同震地表破裂几何展布的差异, 倾滑断层的复杂程度明显高于走滑断层。但是, 如何量化这种复杂性?如何认识多条同震地表破裂的共性特征?又如何量化活动断裂的几何形貌特征?同震地表破裂与活动断裂二者之间的几何形貌特征存在怎样的关联性?等等, 这些问题仍没有得到很好的解决。

针对上述问题, 本文通过采用断层迹线(断层面与地表面交线)代替断层面的方法来开展形貌学研究, 收集52条同震地表破裂和300多条活动断层的几何展布, 运用能谱密度的方法统计分析了这些同震地表破裂和活动断层粗糙度, 定量描述了断层迹线的形貌学特征, 并探讨了粗糙度与断层破裂类型之间的关联性。

1 断层粗糙度数据获取

同震地表破裂是地震发生时破裂滑动面错动地表, 并与之形成的交线, 而活动断裂是长期的多次地震破裂叠加的结果。我们收集了52例同震地表破裂, 这些数据主要来自震后的野外调查、 遥感影像的解译以及基于InSAR数据反演的结果, 其中包括走滑型破裂34例、 正断型破裂9例和逆冲型破裂8例(表1)。此外, 我们在中国、 美国与新西兰3个国家的活动断层填图结果中选取了正断、 逆冲与走滑断层迹线各100条; 其中中国的数据主要为中国地震活断层探察项目的成果(中国地震活动断层研究中心, http: ∥www.activetectonics.cn/), 美国的数据主要来自美国地质勘察调查局(USGS)断裂与褶皱数据库(https: ∥earthquake.usgs.gov/hazards/qfaults/background.php), 新西兰数据主要来自于新西兰活动断层数据库(http: ∥data.gns.cri.nz/af/)。

表1 同震地表破裂数据 Table1 Data of co-seismic surface ruptures

同震地表破裂数据主要来源于发表的学术论文或报告中的图件; 为了便于量化分析, 在使用前需要进行预处理。首先, 对断裂迹线的底图进行空间校正, 将坐标系统一为WGS 1984的 UTM投影的平面坐标; 然后, 对校正后的底图上的断层迹线进行矢量化处理, 为了保证与原数据相似的精度, 我们将重采样点间隔控制在100m以内。对于矢量活动断层数据, 也将其统一转换到WGS 1984 的UTM投影平面坐标系。

2 分析方法与数据处理
2.1 分析方法

描述空间物体的模型主要包括2类: 欧式几何模型与天然表面模型。欧式几何模型的研究对象主要包括2部分: 1)简单、 可解析的欧式几何形状, 用于描述物体的整体规则形状, 如球体、 立方体等; 2)其衍生形态中偏离欧式几何形状的自由、 随机的部分, 如立方体的1个平面上的自由波状起伏; 在该模型中, 粗糙程度不会随着空间位置的变化而有较大变化, 表现为1种稳态模型。天然表面模型是1种非稳态模型(Berry et al., 1978; Sayles et al., 1978); 例如海岸线等, 在该模型中, 粗糙程度不仅会随着空间位置改变发生较大变化, 而且还会随着观测尺度的变化而变化。在描述天然表面模型时, 这种粗糙度随尺度的变化性决定了不能采用类似于起伏标准偏差的参数, 而需要借助分形模型(如自相似、 自相仿等), 才能更加全面地反映天然表面模型的形貌特征。

断层迹线是断层面与地表面的交线, 通常表现为连续的或非连续的, 并在一定尺度范围内呈现出不规则的波状起伏特征, 我们把这种不规则的几何特征称为粗糙度(Brown et al., 1985), 它是剖面线形貌特征研究中的重要参数之一。断层迹线属于天然表面模型, 可以用自仿射的方法来描述它的粗糙度(Schmittbuhl et al., 1993; Candela et al., 2009)。在对多种自仿射方法进行比较和分析后, 普遍认为能谱密度方法可以准确计算和描述断层形貌特征(Power et al., 1991; Perron et al., 2008; Candela et al., 2009)。首先, 它能方便地量化断层的粗糙程度, 其次, 能够展示粗糙度随尺度变化的特征。同时, 能谱密度方法是断层粗糙度分析过程中较为常用与成熟的方法(Brown, 1987; Candela, 2009; Sagy et al., 2017), 因此, 本文采用能谱密度方法对天然断层迹线进行形貌特征分析。

图 1 3种类型的同震地表破裂迹线Fig. 1 Three types of co-seismic surface rupture traces.

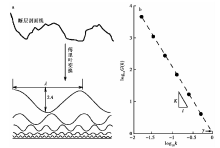
能谱密度的计算是通过快速傅里叶变换把1个时间序列或者空间序列转化为频率域内的1组正弦波, 这些正弦波各自具有不同的波长、 振幅和相位; 然后, 对振幅进行平方得到能量, 能量随着频率的变化即为能谱图, 最后, 在频率上对能谱进行归一化处理, 进而得到能谱密度(图2)(Brown, 1995)。

图 2 能谱密度计算方法图示Fig. 2 Schematic diagram demonstrating the power spectrum density method.

对于自相仿剖面, 能谱密度函数G(k)遵循下面的幂次定律:

G(k)=Ck-α

k为频率值, k=2π/λ, λ为波长值; 幂率指数 α为有效范围值( 2< α< 3)。断层迹线形貌特征可以通过能谱密度曲线与曲线的指数等参数进行描述: 1) 幂率指数 α(双对数图中的斜率 K), 表示剖面线形貌随尺度的变化特征; 2)比例系数C(双对数图中的截距值γ ), 用来描述单位长度上剖面线的起伏程度。

2.2 数据处理

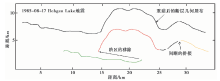
为了量化断裂迹线的粗糙度, 同时针对断裂迹线的几何展布特点, 我们编写了基于MATLAB语言的处理程序, 处理步骤主要包括: 1)对数据进行拼接、 旋转。 拼接就是指移除同1条断裂迹线内包含的阶区与间断。阶区与间断是断层中常见的不规则结构, 它们的存在会影响傅里叶变换结果, 从而使粗糙度的分析结果发生偏离(Candela et al., 2012)。在本研究中, 通过移除阶区与间断来重建断层几何展布的方法(图3)对数据进行处理, 就可以避免这种影响; 同时, 对具有分支的断层, 则进行留取主断层的几何展布, 舍弃次级分支断层的处理。旋转就是将断层迹线的总体走向调整为与X轴平行。 2)进行数据的插值和傅里叶变换运算, 这里的插值间隔取值为1m, 获得能谱密度图。 3)计算多条数据的能谱密度的平均值。

图 3 断层阶区移除与间断拼接图示Fig. 3 Schematic illustration of removing steps and jointing fault segments.

3 结果

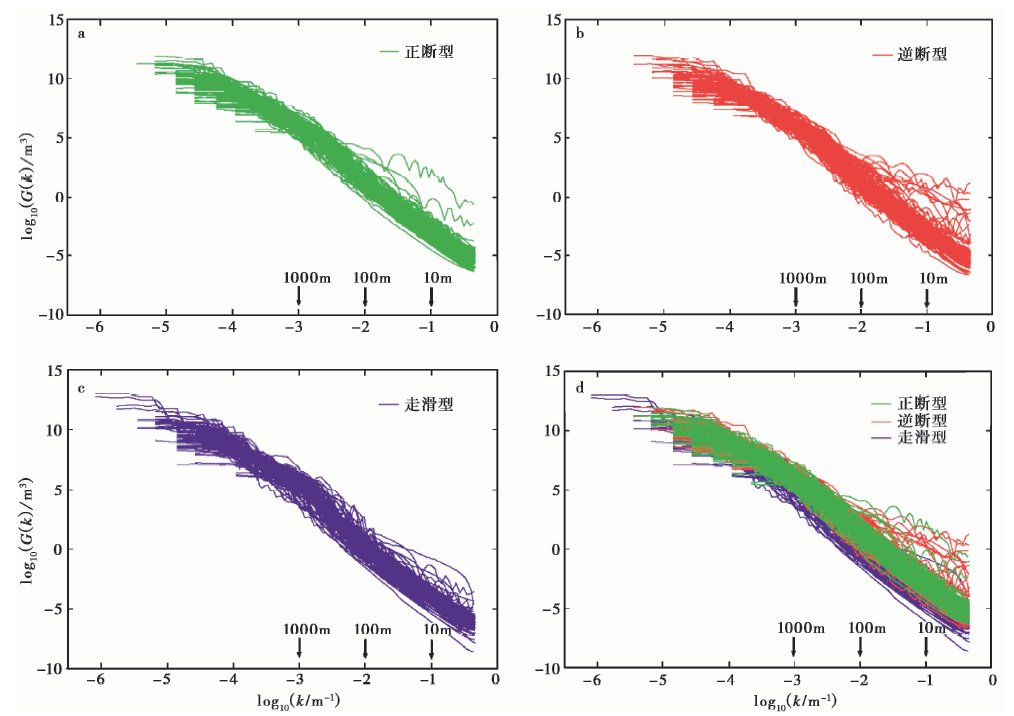
我们分别计算了同震地表破裂和活动断层的能谱密度, 得到了正断、 逆冲和走滑3种破裂和断层类型的能谱密度随频率变化的双对数图(图4, 5)以及平均双对数图(图6)。

图 4 同震地表破裂的能谱密度双对数图Fig. 4 Bi-logarithmic graphs of power spectrum density and frequency for co-seismic surface ruptures.

图 5 活动断裂的能谱密度曲线双对数图Fig. 5 Bi-logarithmic graphs of power spectrum density and frequency for active fault traces.

图 6 同震地表破裂(a)与活动断层(b)的平均能谱密度的双对数图Fig. 6 Bi-logarithmic graphs of average power spectrum density and frequency for co-seismic surface ruptures(a)and active faults(b).

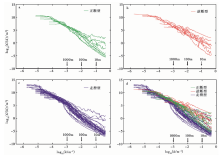
同震地表破裂的能谱密度双对数图(图4a, b, c)显示: 1)逆冲型和正断型同震地表破裂的能谱密度叠加曲线相似, 均较为平直, 而走滑型地震的能谱曲线以km尺度为界具有分段特征, 曲线的斜率发生了显著的改变。 2)在图4d中的低频域(km级以上尺度)上, 走滑、 逆冲、 正断型同震地表破裂的能谱密度曲线重叠在一起, 这说明在该尺度上, 3种破裂类型的地表破裂具有相近的形貌特征; 而在高频域(km级以下尺度)上, 走滑型地表破裂的能谱低于正断和逆冲型破裂, 这说明正断型和逆冲型破裂在该尺度上的粗糙度高于走滑型。这些特征揭示了3种类型地震破裂的几何形态差异主要集中在km级以下。

活动断裂能谱密度曲线双对数图(图5)显示: 1)正断、 逆冲和走滑3种类型活动断层的能谱密度曲线形态相似, 在km级尺度附近具有明显的分段性; 2)在全频域上(图5d), 走滑型能谱值略低于正断型和逆冲型。

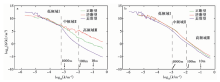
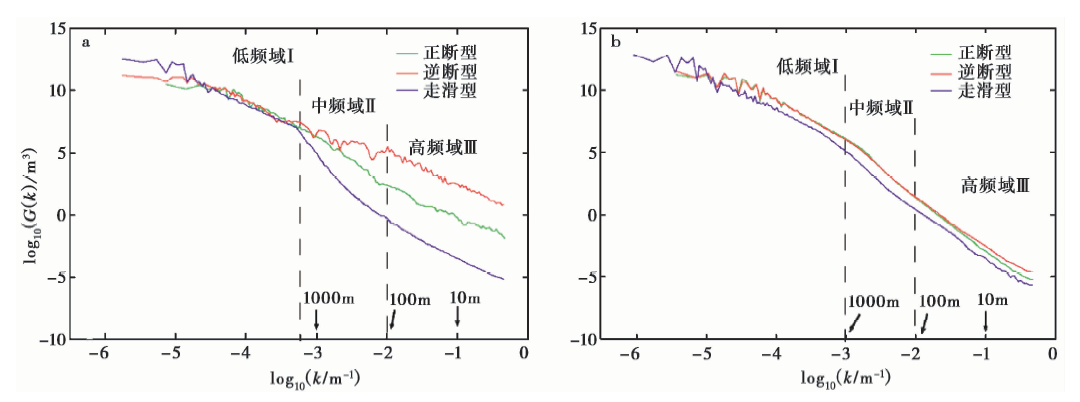
对上述同震地表破裂与活动断裂的叠加能谱密度曲线进行求平均值处理得到图6。由图可知, 同震地表破裂与活动断层的能谱密度曲线均显示出明显的分段性特征, 可以将能谱密度曲线在频率域分为3段: 低频域(Ⅰ )、 中频域(Ⅱ )与高频域(Ⅲ )。同震地表破裂的分段点位于1, 500m与100m附近(图6a), 而活动断层的分段点主要位于1, 000m与100m附近(图6b)。我们对3个频域内的曲线分别进行最小二乘线性拟合, 得到各段的斜率和截距(表2)。从表中可以看出, 在中频段与高频段, 3种不同类型同震破裂的能谱密度曲线在斜率和截距上差异显著。

表2 同震地表破裂和活动断层的能谱密度分段拟合直线的斜率及截距 Table2 Slopes and intercepts of piecewise-fitting straight lines of power spectral density-spatial frequency curves
4 讨论
4.1 原始数据的准确性问题

地表破裂和活动断裂可以分为走滑、 正断与逆冲3种端元类型。在实际的野外考察过程中, 会发现破裂活动行为十分复杂。例如, 走滑断裂局部往往会伴随有倾滑分量, 尤其是局部断裂迹线与总体走向有一定的交角时(Florensov et al., 1963; Kurushin et al., 1997), 或在阶区和断裂端部, 都会发育强烈的挤压与拉张, 并伴生明显的倾滑分量(Klinger et al., 2006); 在正断或者逆冲断裂的末端, 往往会伴生走向平行于运动方向的捩断层(邓起东, 2011), 因此, 忽略端元类型之间的过渡类型, 会对分析结果的准确性带来一定的影响。此外, 地貌起伏也会对倾滑断层在地表的迹线展布产生影响(例如, “ V” 字形法则), 使得断层迹线局部偏离断层面与水平地表的交线, 因此, 在用断层迹线代替断层面进行研究时, 迹线的准确性会不可避免地受到地形的影响。但是, 由于地表起伏的高差影响的范围(几十m— km级)与断裂的长度(十几km— 几百km级)不在1个数量级, 我们认为这种影响是局部的、 有限的, 这里研究的是断层形貌特征的1种总体效应。

4.2 能谱密度曲线特征与断层粗糙度的分段性

4.2.1 能谱密度曲线特征

同震地表破裂的能谱密度叠加图(图4a, b, c)中, 在hm以下尺度, 3种破裂类型的曲线本身具有较大差异, 表现相对离散。我们分析造成这种现象的原因主要有2个: 1)发震断层本身具有不同的成熟度, 会影响同震地表破裂的形貌特征; 2)数据来自不同的数据源, 具有不同的清晰度、 分辨率, 这会影响形貌在小尺度上的精确性。正是由于这些原因的干扰, 所以在研究3种破裂类型各自的共性特征时, 要对能谱密度进行求平均值处理。

4.2.2 断层粗糙度的分段性

利用能谱密度的方法对同震地表破裂与活动断层进行分析, 观察到能谱密度曲线具有明显的分段性(图6, 表2), 反映出同震地表破裂与活动断层的形貌特征不能用单一分形参数描述(Power et al., 1991; Lee et al., 1996)。对能谱密度曲线中各段分别进行最小二乘法线性拟合, 相邻拟合直线的交点为拐点。拐点对应的波长为特征波长, 其物理含义随具体的研究对象及其研究尺度而不同(Chen et al., 1993; Lee et al., 1996; Candela et al., 2009; Wei et al., 2013)。在研究微观尺度(mm级)形貌面特征时, Chen 等(1993)发现在能谱密度曲线上存在拐点, 认为它是由于在晶体(颗粒)内与晶体(颗粒)间2个尺度上的主导变形模式不同导致的。Lee 等(1996)对野外露头尺度(几cm— 几十m)断层面进行研究时, 认为能谱密度曲线上的拐点是由于不同尺度上断层面形貌的控制因素不同造成的, 小于拐点一侧的尺度内线性特征主要受到摩擦滑动与次级破裂的影响, 大于拐点一侧的尺度内断层面形貌主要受到断层的横向扩展过程与次级断裂贯通的控制。天然断层面的长时期暴露也会引起形貌结构在尺度上的变化, 侵蚀风化(Power et al., 1991)和失稳破裂(Scholz et al., 1986)2个主要过程分别控制着断层面的几何形貌的高频和低频成分(Brown et al., 1985; Wei et al., 2013)。

在本研究中, 我们发现了2个拐点, 分别位于km级尺度和hm级尺度。在km级尺度拐点处, 我们认为能谱密度曲线拐点两侧的线性特征受到不同因素的控制; 在km级以上尺度, 3种破裂类型的同震地表破裂与走滑断层的能谱密度曲线的指标参数均存在近似性, 不论是能谱值, 还是斜率与截距。因此, 我们认为它们统一代表了在km级以上尺度的构造块体边界的形貌特征; 在km级以下尺度, 断层(破裂)形貌特征控制因素主要来自于断层的横向扩展、 次级断裂的贯通以及局部地形。而在hm级尺度上存在的拐点, 它对应的特征波长也就是重采样的有效长度。在对底图数据电子化重采样时, 2个采样点之间的有效间隔也会对形貌分析结果产生影响(Candela, 2012)。对重采样数据进行傅里叶变换前进行插值, 当选取的插值间隔小于重采样长度时, 能谱曲线就会在重采样尺度附近产生拐点。拐点左侧曲线及其指标参数反映了重采样数据本身具有的特征; 而右侧曲线特征则受到插值方法的控制, 在图上形成无实际意义的斜率, 表现出高斯白噪声特征。

4.3 能谱曲线斜率与截距值

能谱密度曲线拟合直线的斜率及截距可以用来描述断层迹线的形貌特征。斜率代表了几何形貌的复杂程度与不规则性, 斜率越小表示断层迹线的形貌越复杂, 说明剖面起伏在局部范围内变化越频繁, 在长距离上变化相对越小; 高斜率则代表相反的意义。截距值是能谱密度曲线拟合直线与纵轴交点的坐标值, 代表断层迹线在该尺度上的起伏程度, 截距值越高代表迹线在该波长上的垂直高差越大(Klinkenberg et al., 1992; Sung et al., 1998, 2004)。由于研究尺度的原因, 单位长度上的截距值并没有实际意义, 所以研究中通常使用能谱密度曲线拟合直线与拐点处的纵轴相交的纵截距。只有将斜率与截距值结合起来才能全面地描述断层迹线的几何形貌特征。

在该研究中, 能谱密度曲线拟合直线的斜率和截距不仅在各频域段之间具有较大差异, 而且在中高频域段内同震地表破裂的3种破裂类型之间也存在差异(表2), 在中频域(Ⅱ )段内有, 斜率: 走滑型(6.08)> 正断型(3.94)> 逆冲型(1.87), 100m波长对应的纵截距: 走滑型(-1.41)< 正断型(2.37)< 逆冲型(4.78); 在高频域(Ⅲ )段内, 单位波长对应的截距: 走滑型(-6.39)< 正断型(-2.56)< 逆冲型(-0.21)。以上差异表明单次破裂(同震地表破裂)的几何形貌特征在该尺度范围内主要受控于破裂类型, 这种差异也有助于我们对同震地表破裂进一步地量化研究。

4.4 同震地表破裂与活动断裂能谱密度曲线的差异

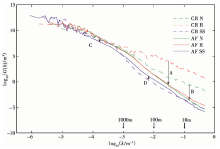
活动断层是一系列地震破裂叠加积累的结果, 因此, 同震地表破裂与活动断层能谱密度曲线的差异也就反映了单次破裂和多次破裂叠加的差异。我们将活动断层与同震地表破裂二者的平均能谱密度曲线进行比较(图7), 可以发现: 1)在km级以上尺度的能谱密度, 正断型和逆冲型的单次破裂与多次破裂表现基本一致; 在km级以下尺度的能谱密度, 逆冲型单次破裂与多次破裂之间相差较大(图7箭头A), 正断型单次破裂与多次破裂相差较小(图7箭头B), 约为逆冲型的一半。2)对于走滑型, 在km级以上尺度的能谱密度, 单次破裂高于多次破裂(图7箭头C); 在km级与m级之间的能谱密度, 单次破裂又低于多次破裂(图7箭头D)。

图 7 同震地表破裂与活动断层能谱密度双对数曲线对比
CR N: 正断型同震地表破裂; CR R: 逆冲型同震地表破裂; CR SS: 走滑型同震地表破裂; AF N: 正断型活动断层; AF R: 逆冲型活动断层; AF SS: 走滑型活动断层
Fig. 7 Comparison of average power spectrum density curves between the co-seismic surface ruptures and active faults.

断层的形成与扩展往往经历1个从复杂到简单的过程, 如多条分支断层羽状或雁行斜列到追踪张式的阶区发展到贯通、 断层转折或弯曲的裁弯取直以及断层间断点的逐渐贯通等等。单次破裂迹线上这些斜列阶区、 弯曲、 间断、 凸起、 凹陷等复杂几何形貌特征被较好地保存和体现, 所以同震地表破裂的能谱密度较高。随着地震破裂的叠加与累计位移量的增加, 地表的断层迹线逐渐被贯通, 趋于连续、 平滑, 能谱密度降低(Sagy et al., 2007)(图7箭头A, B, C)。这种同类型运动方式的同震地表破裂(单次破裂)与活动断层(多次破裂叠加)的能谱密度比较, 实际上反映了断层从初始状态向成熟状态演化的过程中, 断层(破裂)的粗糙度或几何结构在不同频率域中的变化, 即粗糙度与成熟程度成反比。

5 结论

我们使用能谱密度方法对同震地表破裂和活动断层的形貌特征进行了量化分析, 得到以下认识: 同震地表破裂与活动断层的能谱密度在频域上具有3分段特征, 每段内的能谱密度曲线特征都具有不同的控制因素。在低频域(Ⅰ ), 能谱密度曲线表征了在km级以上尺度的构造块体边界的形貌特征; 在中频域(Ⅱ ), 则受到hm— km级尺度的断层横向扩展、 次级断裂贯通以及局部地形的控制; hm尺度上的拐点代表了重采样的有效长度, 在hm级以下尺度, 能谱曲线特征受到数据插值方法的控制。在中频域(Ⅱ )上的能谱密度曲线, 同震地表破裂的3种破裂类型之间斜率与截距差异明显, 说明同震地表破裂在hm— km级尺度上的几何形貌特征主要受到断裂类型的控制, 这种差异有助于我们对同震地表破裂进一步地量化研究。同震地表破裂(单次破裂)与活动断层(多次破裂)能谱密度的差异, 反映了断层由初始状态向成熟状态演化的过程中断层粗糙度与形貌特征的变化, 粗糙度与成熟程度成反比。

The authors have declared that no competing interests exist.

参考文献
[1] 邓起东, 陈桂华, 朱艾斓. 2011. 关于2008年汶川MS8. 0地震震源断裂破裂机制几个问题的讨论[J]. 中国科学(D辑), 41(11): 15591576.
DENG Qi-dong, CHEN Gua-hua, ZHU Ai-lan. 2011. Discussion of rupture mechanisms on the seismogenic fault of the 2008 MS8. 0 Wenchuan earthquake[J]. Science in China(Ser D), 54(9): 13601377. [本文引用:1]
[2] 皇甫岗. 1988. 断层泥的厚度、 粒度与断层错距的关系[J]. 四川地震, (1): 5258.
HUANGFU Gang. 1988. The Correlation between thickness, granularity of fault gouge and fault offset[J]. Sichuan Earthquake Research, (1): 5258(in Chinese). [本文引用:1]
[3] 周枝华, 杜守继. 2005. 岩石节理表面几何特性的三维统计分析[J]. 岩土力学, 26(8): 12271232.
ZHOU Zhi-hua, DU Shou-ji. 2005. 3D statistic analysis of geometrical properties of a rock joint[J]. Rock and Soil Mechanics, 26(8): 12271232(in Chinese). [本文引用:1]
[4] Aki K. 1984. Asperities, barriers, characteristic earthquakes and strong motion prediction[J]. Journal of Geophysical Research: Solid Earth(1978—2012), 89(B7): 58675872. [本文引用:2]
[5] Akyüz H S, Hartleb R, Barka A, et al. 2002. Surface rupture and slip distribution of the 12 November 1999 Düzce earthquake(M7. 1), north Anatolian Fault, Bolu, Turkey[J]. Bulletin of the Seismological Society of America, 92(1): 6166. [本文引用:1]
[6] Allen C R, Engen G R, Hanks T C, et al. 1971. Main shock and larger aftershocks of the San Fernand o earthquake, February 9 through March 1, 1971 [R]. Washington: USGS Prof. Paper, 733: 1720. [本文引用:1]
[7] Allen C R, Grantz A, Brune J N, et al. 1968. The Borrego Mountain, California, earthquake of 9 April 1968: A preliminary report[J]. Bulletin of the Seismological Society of America, 58(3): 11831186. [本文引用:1]
[8] Barka A. 1996. Slip distribution along the North Anatolian Fault associated with the large earthquakes of the period 1939 to 1967[J]. Bulletin of the Seismological Society of America, 86(5): 12381254. [本文引用:1]
[9] Beanland S, Berryman K R, Blick G H. 1989. Geological investigations of the 1987 Edgecumbe earthquake, New Zealand [J]. New Zealand journal of geology and geophysics, 32(1): 7391. [本文引用:1]
[10] Berberian M, Jackson J A, Fielding E, et al. 2001. The 1998 March 14 Fand oqa earthquake(MW6. 6)in Kerman Province, southeast Iran: re-rupture of the 1981 Sirch earthquake fault, triggering of slip on adjacent thrusts and the active tectonics of the Gowk fault zone[J]. Geophysical Journal International, 146(2): 371398. [本文引用:1]
[11] Berberian M, Jackson J A, Ghorashi M, et al. 1984. Field and teleseismic observations of the 1981 Golbaf-Sirch earthquakes in SE Iran[J]. Geophysical Journal International, 77(3): 809838. [本文引用:1]
[12] Berberian M, Jackson J A, Qorashi M, et al. 1999. The 1997 May 10 Zirkuh(Qa'enat)earthquake(MW7. 2): faulting along the Sistan suture zone of eastern Iran[J]. Geophysical Journal International, 136(3): 671694. [本文引用:1]
[13] Berry M V, Hannay J H. 1978. Topography of rand om surfaces[J]. Nature, 273(5663): 573573. [本文引用:1]
[14] Brodsky E E, Kanamori H. 2001. Elastohydrodynamic lubrication of faults[J]. Journal of Geophysical Research: Solid Earth, 106(B8): 1635716374. [本文引用:1]
[15] Brown S R. 1987. A note on the description of surface roughness using fractal dimension[J]. Geophysical Research Letters, 14(11): 10951098. [本文引用:1]
[16] Brown S R. 1995. Simple mathematical model of a rough fracture[J]. Journal of Geophysical Research: Solid Earth, 100(B4): 59415952. [本文引用:1]
[17] Brown S R, Scholz C H. 1985. Broad band width study of the topography of natural rock surfaces[J]. Journal of Geophysical Research: Solid Earth(1978-2012), 90(B14): 1257512582. [本文引用:2]
[18] Cand ela T, Renard F, Bouchon M, et al. 2009. Characterization of fault roughness at various scales: implications of three-dimensional high resolution topography measurements[J]. Pure and Applied Geophysics, 166(10-11): 18171851. [本文引用:3]
[19] Cand ela T, Renard F, Klinger Y, et al. 2012. Roughness of fault surfaces over nine decades of length scales[J]. Journal of Geophysical Research: Solid Earth, 117(B8): B08409. [本文引用:2]
[20] Caskey S J, Wesnousky S G. 1997. Static stress changes and earthquake triggering during the 1954 Fairview Peak and Dixie Valley earthquakes, Central Nevada[J]. Bulletin of the Seismological Society of America, 87(3): 521527. [本文引用:1]
[21] Chen G L, Spetzler H. 1993. Topographic characteristics of laboratory induced shear fractures[J]. Pure and Applied Geophysics, 140(1): 123135. [本文引用:1]
[22] Chester F M, Chester J S. 2000. Stress and deformation along wavy frictional faults[J]. Journal of Geophysical Research: Solid Earth, 105(B10): 2342123430. [本文引用:1]
[23] Choi J H, JIN Kwang-min, Enkhbayar D, et al. 2012. Rupture propagation inferred from damage patterns, slip distribution, and segmentation of the 1957 MW8. 1 Gobi-Altay earthquake rupture along the Bogd fault, Mongolia[J]. Journal of Geophysical Research: Solid Earth(1978-2012), 117(B12): B12401. [本文引用:1]
[24] Clark D, McPherson A, Allen T, et al. 2013. Coseismic Surface Deformation Caused by the 23 March 2012 MW5. 4 Ernabella(Pukatja)Earthquake, Central Australia: Implications for Fault Scaling Relations in Cratonic Settings[J]. Bulletin of the Seismological Society of America, 104(1): 2439. [本文引用:1]
[25] Crone A J, Machette M N. 1984. Surface faulting accompanying the Borah Peak earthquake, central Idaho[J]. Geology, 12(11): 664667. [本文引用:1]
[26] Deng Q D, Chen S F, Song F M, et al. 1986. Variations in the geometry and amount of slip on the Haiyuan(Nanxihaushan)fault zone, China and the surface rupture of the 1920 Haiyuan earthquake[M]∥Das S, Boatwright J, Scholz C H, eds. Earthquake Source Mechanics. Geophysical Monograph, Washington, DC: 169182. [本文引用:1]
[27] Deng Q D, Zhang P Z. 1984. Research on the geometry of shear fracture zones[J]. Journal of Geophysical Research: Solid Earth(1978-2012), 89(B7): 56995710. [本文引用:1]
[28] DePolo C M, Clark D G, Slemmons D B, et al. 1991. Historical surface faulting in the Basin and Range Province, western North America: implications for fault segmentation[J]. Journal of Structural Geology, 13(2): 123136. [本文引用:1]
[29] Dieterich J H, Smith D E. 2009. Nonplanar faults: mechanics of slip and off—fault damage[J]. Pure and Applied Geophysics, 166(10-11): 17991815. [本文引用:1]
[30] Eberhart P D, Haeussler P J, Freymueller J T, et al. 2003. The 2002 Denali Fault earthquake, Alaska: A large magnitude, slip-partitioned event[J]. Science, 300(5622): 11131118. [本文引用:1]
[31] Florensov N A, Solonenko V P. 1963. The Gobi-Altai Earthquake(Gobi-Altaiskoe Zemletryasenie)[M]. Moscow: Akademie Nauk USSR. Translated by Rosental E, U. S. Department of Commerce, Washington D C, 1965. [本文引用:1]
[32] Gold R D, Reitman N G, Briggs R W, et al. 2015. On- and off-fault deformation associated with the September 2013 MW7. 7 Balochistan earthquake: Implications for geologic slip rate measurements[J]. Tectonophysics, 660: 6578. [本文引用:1]
[33] Hough S E. 2004. Revisiting the 23 February 1892 Laguna Salada earthquake[J]. Bulletin of the Seismological Society of America, 94(4): 15711578. [本文引用:1]
[34] Kaneda H, Nakata T, Tsutsumi H, et al. 2008. Surface rupture of the 2005 kashmir, Pakistan, earthquake and its active tectonic implications[J]. Bulletin of the Seismological Society of America, 98(2): 521557. [本文引用:1]
[35] King G, Nabělek J. 1985. Role of fault bends in the initiation and termination of earthquake rupture[J]. Science, 228(4702): 984987. [本文引用:1]
[36] Klinger Y. 2005. High-Resolution Satellite Imagery Mapping of the Surface Rupture and Slip Distribution of the MW7. 8, 14 November 2001 Kokoxili Earthquake, Kunlun Fault, Northern Tibet, China[J]. Bulletin of the Seismological Society of America, 95(5): 19701987. [本文引用:1]
[37] Klinger Y, Michel R, King G C P. 2006. Evidence for an earthquake barrier model from MW7. 8 Kokoxili(Tibet)earthquake slip—distribution[J]. Earth and Planetary Science Letters, 242(3-4): 354364. [本文引用:1]
[38] Klinkenberg B, Goodchild M F. 1992. The fractal properties of topography: A comparison of methods[J]. Earth Surface Processes and Land forms, 17(3): 217234. [本文引用:1]
[39] Kurushin R A, Olziybat M, Enhtuvshin B, et al. 1997. The Surface Rupture of the 1957 Gobi-Altay, Mongolia, Earthquake[M]. Geological Society of America, Washington, DC. [本文引用:1]
[40] Langridge R M, Stenner H D, Fumal T E, et al. 2002. Geometry, slip distribution, and kinematics of surface rupture on the Sakarya fault segment during the 17 August 1999 Izmit, Turkey, earthquake[J]. Bulletin of the Seismological Society of America, 92(1): 107125. [本文引用:1]
[41] Lay T, Kanamori H, Ruff L. 1982. The asperity model and the nature of large subduction zone earthquakes[J]. Earthquake Prediction Research, 1: 371. [本文引用:1]
[42] Lee J J, Bruhn R L. 1996. Structural anisotropy of normal fault surfaces[J]. Journal of Structural Geology, 18(8): 10431059. [本文引用:3]
[43] Lee Y H, Hsieh M L, Lu S D, et al. 2003. Slip vectors of the surface rupture of the 1999 Chi-Chi earthquake, western Taiwan[J]. Journal of Structural Geology, 25(11): 19171931. [本文引用:1]
[44] Lin A, Ouchi T, Chen A, et al. 2001. Co-seismic displacements, folding and shortening structures along the Chelungpu surface rupture zone occurred during the 1999 Chi-Chi(Taiwan)earthquake[J]. Tectonophysics, 330(3-4): 225244. [本文引用:1]
[45] Lin A M, Rao G, Jia D, et al. 2011. Co-seismic strike-slip surface rupture and displacement produced by the 2010 MW6. 9 Yushu earthquake, China, and implications for Tibetan tectonics[J]. Journal of Geodynamics, 52(3-4): 249259. [本文引用:1]
[46] Machette M N, Crone A J, Bowman J R. 1993. Geologic Investigations of the 1986 Marryat Creek, Australia, Earthquake: Implications for Paleoseismicity in Stable Continental Regions [R]. Washington: USGS Bulletin, 2032-B: 810. [本文引用:1]
[47] McGill S F, Rubin C M. 1999. Surficial slip distribution on the central Emerson fault during the June 28, 1992, Land ers earthquake, California[J]. Journal of Geophysical Research: Solid Earth(1978-2012), 104(B3): 48114833. [本文引用:1]
[48] Okubo P G, Aki K. 1987. Fractal geometry in the San Andreas fault system[J]. Journal of Geophysical Research: Solid Earth, 92(B1): 345355. [本文引用:1]
[49] Peltzer G, Crampé F, King G. 1999. Evidence of nonlinear elasticity of the crust from the MW7. 6 Manyi(Tibet)earthquake[J]. Science, 286(5438): 272276. [本文引用:1]
[50] Perron J T, Kirchner J W, Dietrich W E. 2008. Spectral signatures of characteristic spatial scales and nonfractal structure in land scapes[J]. Journal of Geophysical Research: Earth Surface, 113(F4): F04003. [本文引用:1]
[51] Power W L, Tullis T E. 1991. Euclidean and fractal models for the description of rock surface roughness: J Geophys Res V96, NB1, Jan 1991, P415—424[J]. International Journal of Rock Mechanics and Mining Sciences & Geomechanics Abstracts, 28(6): A344. [本文引用:3]
[52] Power W L, Tullis T E, Weeks J D. 1988. Roughness and wear during brittle faulting[J]. Journal of Geophysical Research: Solid Earth, 93(B12): 1526815278. [本文引用:2]
[53] Quigley M, Van Dissen R, Litchfield N, et al. 2012. Surface rupture during the 2010 MW7. 1 Darfield(Canterbury)earthquake: Implications for fault rupture dynamics and seismic-hazard analysis[J]. Geology, 40(1): 5558. [本文引用:1]
[54] Ren Z K. 2013. Geometry and deformation features of the most recent co-seismic surface ruptures along the Xiaojiang Fault and its tectonic implications for the Tibetan plateau[J]. Journal of Asian Earth Sciences, 77: 2130. [本文引用:1]
[55] Rymer M J, Ellsworth W L. 1990. The Coalinga, California, earthquake of May 2, 1983 [R]. Washington: USGS Prof. Paper, 1478: 299. [本文引用:1]
[56] Sagy A, Brodsky E E, Axen G J. 2007. Evolution of fault-surface roughness with slip[J]. Geology, 35(3): 283. [本文引用:1]
[57] Sagy A, Tesei T, Collettini C. 2017. Fault-surface geometry controlled by faulting mechanisms: Experimental observations in limestone faults[J]. Geology, 45(9): 851854. [本文引用:1]
[58] Sayles R S, Thomas T R. 1978. Surface topography as a nonstationary rand om process[J]. Nature, 271(5644): 431434. [本文引用:1]
[59] Schmittbuhl J, Gentier S, Roux Stéphane. 1993. Field measurements of the roughness of fault surfaces[J]. Geophysical Research Letters, 20(8): 639641. [本文引用:1]
[60] Scholz C H. 1985. The Black Mountain asperity: Seismic hazard of the southern San Francisco Peninsula, California[J]. Geophysical Research Letters, 12(10): 717719. [本文引用:1]
[61] Scholz C H. 1987. Wear and gouge formation in brittle faulting[J]. Geology, 15(6): 493495. [本文引用:1]
[62] Scholz C H. 1988. The brittle—plastic transition and the depth of seismic faulting[J]. Geologische Rundschau, 77(1): 319328. [本文引用:1]
[63] Scholz C H. 2002. The Mechanics of Earthquakes and Faulting [M]. Cambridge University Press, Cambridge. [本文引用:1]
[64] Scholz C H, Aviles C A. 1986. The fractal geometry of faults and faulting[M]∥Das S, Boatwright J, Scholz C H, eds. Earthquake Source Mechanics. Weily, Washington D. C: 147155. [本文引用:1]
[65] Sharp R V, Budding K E, Boatwright J, et al. 1989. Surface faulting along the Superstition Hills fault zone and nearby faults associated with the earthquakes of 24 November 1987[J]. Bulletin of the Seismological Society of America, 79(2): 252281. [本文引用:1]
[66] Sharp R V, Rymer M J, Lienkaemper J J. 1986. Surface displacement on the Imperial and Superstition Hills faults triggered by the Westmorland , California, earthquake of 26 April 1981[J]. Bulletin of the Seismological Society of America, 76(4): 949965. [本文引用:1]
[67] Sibson R H. 1985. Stopping of earthquake ruptures at dilational fault jogs[J]. Nature, 316(6025): 248251. [本文引用:1]
[68] Sieh K E. 1984. Slip Along the San Andreas Fault Associated with the Great 1857 Earthquake[J]. Bulletin of the Seismological Society of America, 68(5): 14211448. [本文引用:1]
[69] Smith S W, Wyss M. 1968. Displacement on the San Andreas Fault subsequent to the 1966 Parkfield earthquake[J]. Bulletin of the Seismological Society of America, 58(6): 19551973. [本文引用:1]
[70] Sung Q C, Chen Y C. 2004. Self-affinity dimensions of topography and its implications in morphotectonics: An example from Taiwan[J]. Geomorphology, 62(3-4): 181198. [本文引用:1]
[71] Sung Q C, Chen Y C, Chao P C. 1998. Spatial variation of fractal parameters and its geological implications[J]. Terrestrial, Atmospheric and Oceanic Sciences, 9(4): 655672. [本文引用:1]
[72] Tchalenko J S, Berberian M. 1975. Dasht-e Bayaz fault, Iran: earthquake and earlier related structures in bed rock[J]. GSA Bulletin, 86(5): 703709. [本文引用:1]
[73] Treiman J A, Kendrick K J, Bryant William A, et al. 2002. Primary surface rupture associated with the MW7. 1 16 October 1999 hector mine earthquake, san bernardino county, california[J]. Bulletin of the Seismological Society of America, 92(4): 11711191. [本文引用:1]
[74] Tullis T E, Weeks J D. 1986. Constitutive behavior and stability of frictional sliding of granite[M]∥Tullis T E, ed. Friction and Faulting. Birkhäuser, Basel: Springer. 383414. [本文引用:1]
[75] Tun S T, Wang Y, Khaing S N, et al. 2014. Surface ruptures of the MW6. 8 March 2011 Tarlay earthquake, eastern Myanmar[J]. Bulletin of the Seismological Society of America, 104(6): 29152932. [本文引用:1]
[76] Wallace R E, Bonilla M G, Villalobos H A. 1984. Faulting related to the 1915 earthquakes in Pleasant Valley, Nevada [R]. Washington: USGS Prof. Paper, 1274-A, B: 57. [本文引用:1]
[77] Wei S J, Fielding J, Leprince S, et al. 2011. Superficial simplicity of the 2010 El Mayor-Cucapah earthquake of Baja California in Mexico[J]. Nature Geoscience, 4(9): 615618. [本文引用:1]
[78] Wei Z Y, He H L, Shi F. 2013. Weathering history of an exposed bedrock fault surface interpreted from its topography[J]. Journal of Structural Geology, 56: 3144. [本文引用:2]
[79] Xu R, Li L X, Zhang L Q, et al. 2014. Influence of pressure and surface roughness on the heat transfer efficiency during water spray quenching of 6082 aluminum alloy[J]. Journal of Materials Processing Technology, 214(12): 28772883. [本文引用:1]
[80] Xu X W, Wen X Z, Yu G H, et al. 2009. Coseismic reverse- and oblique-slip surface faulting generated by the 2008 MW7. 9 Wenchuan earthquake, China[J]. Geology, 37(6): 515518. [本文引用:1]
[81] Xu X W, Yu G H, Klinger Y, et al. 2006. Reevaluation of surface rupture parameters and faulting segmentation of the 2001 Kunlunshan earthquake(MW7. 8), northern Tibetan plateau, China[J]. Journal of Geophysical Research: Solid Earth(1978-2012), 111(B5): B05316. [本文引用:1]
[82] Yielding G, Jackson J A, King G C P, et al. 1981. Relations between surface deformation, fault geometry, seismicity, and rupture characteristics during the El Asnam(Algeria)earthquake of 10 October 1980[J]. Earth and Planetary Science Letters, 56: 287304. [本文引用:1]
[83] Yomogida K, Nakata T. 1994. Large slip velocity of the surface rupture associated with the 1990 Luzon earthquake[J]. Geophysical Research Letters, 21(17): 17991802. [本文引用:1]
[84] Zhang P Z, Mao F Y, Slemmons D B. 1999. Rupture terminations and size of segment boundaries from historical earthquake ruptures in the Basin and Range Province[J]. Tectonophysics, 308(1-2): 3752. [本文引用:1]