山西及邻区壳幔速度图像特征及其构造意义
王霞1, 宋美琴1,*, 郑勇2, 艾三喜3
1)山西省地震局, 太原 030021
2)地质过程与矿产资源国家重点实验室, 中国地质大学(武汉)地球物理与空间信息学院, 武汉 430074
3)中国科学院测量与地球物理研究所, 武汉 430077
*通讯作者: 宋美琴, 女, 1968年生, 研究员, E-mail: smq28@126.com

〔作者简介〕 王霞, 女, 1987年生, 2012年于中国地质大学(北京)获矿产普查与勘探专业硕士学位, 工程师, 主要从事地震综合预测等研究, 电话: 18835166652, E-mail: 365372858@qq.com

摘要

为了获取山西地区更为精细的壳幔速度结构, 文中利用2014年山西断陷带及其邻区216个宽频带地震台站的垂直分量连续波形记录, 通过波形互相关提取台站对间的经验格林函数, 采用时频分析方法测量Rayleigh波的群速度和相速度频散曲线, 反演得到研究区8~50s周期的Rayleigh波群速度和相速度分布图像。结果显示, 研究区内成像水平分辨率在50km以内, 部分周期可提高至40km。8~18s周期的相速度和10~22s周期的群速度分布与地表的地质构造特征较一致。18~30s周期的相速度、 24~35s周期的群速度均明显反映了山西地区以38°N为界, 分为南、 北两区的现象, 与山西南浅北深的莫霍面深部起伏特征及“南硬”、 “北软”两大古老块体的缝合带在这一区域有关。30~50s周期的相速度分布存在NW向速度梯度带, 其NE侧的低速异常可能与新生代火山活动有关。大同火山区18~45s周期的相速度和24~45s周期的群速度均呈现由浅及深的 “喇叭口”状低速异常, 反映了更精细的大同火山岩浆上涌通道。

关键词: 背景噪声; 相速度; 群速度; 层析成像; 山西断陷带
文献标志码:A 文章编号:0253-4967(2019)01-0119-18
VELOCITY CHARACTRISTICS OF SHANXI AND ADJACENT AREA AND ITS TECTONIC SIGNIFICANCE
WANG Xia1, SONG Mei-qin1, ZHENG Yong2, AI San-xi3
1)Shanxi Earthquake Agency, Taiyuan 030021, China
2)State Key Laboratory of Geological Processes and Mineral Resources, Institute of Geophysics and Geomatics, China University of Geosciences, Wuhan 430074, China
3)Institute of Geodesy and Geophysics, Chinese Academy of Sciences, Wuhan 430077, China
Abstract

In order to acquire a better velocity structure of the crustal and uppermost mantle beneath Shanxi area, we obtain the group and phase velocities of Rayleigh wave of the periods 8s to 50s in Shanxi and adjacent area using ambient seismic noise recorded at 216 broad-band stations. All available vertical-component time series for 2014 have been cross-correlated to yield estimates of empirical Rayleigh wave Green’s function. Group and phase velocity dispersion curves for Rayleigh wave are measured for each interstation path by applying frequency-time analysis. It describes finer velocity structure of the crust and upper mantle in Shanxi, which reflects the geological structure characteristics at different depths. The resolution is within 50km and the resolution of part periods can reach 40km.The Rayleigh wave group and phase speed maps at short periods(8~18s and 10~22s)show clear correlations with shallow geological structures. Mountain areas on both sides of Shanxi depression zone show apparent high-velocity anomaly, except for low-velocity anomaly in the Taiyuan Basin, Linfen-Yuncheng Basin and Weihe Basin. Especially, the areas of Youyu County-Pianguan County-Kelan County-Shuozhou City and Jingle County-Lishi District of Lüliang City in Lüliang Mountains, and Yu County-Fuping County-Yi County and Yangcheng County-Licheng County in Taihang Mountains, present higher velocity anomaly. In addition, the velocity is lowest in the Weihe Basin, and the amplitude of low velocity decreases gradually from the south to the north of the basins in Shanxi, which probably is related to the process of gradual stretching and development of the Shanxi rift zone from the southwest to the northeast. The obvious velocity difference across the latitude of 38°N exists at 18~30s period of phase and 24~35s period of group velocity maps, which is probably related to the deep and shallow Moho depth variation in the south and north of Shanxi and the suture zone of ancient blocks including “hard” southern block and “soft” northern block. At the same time, the research result of receiver function reveals that partial melting of the lower crust occurs in the northern Taihang Mountains, while the southern section remains stable(Poisson’s ratio is above 0.3 in the northern Taihang Mountains and 0.25~0.26 in the southern section). The phase velocity map at 30~50s period clearly shows NW velocity gradient belt, and the low velocity anomaly in the northeast side may be related to Cenozoic volcanism. Meanwhile, the eastern border of Ordos block is the western faults of central basins in Shanxi depression zone. However, some research results indicate that the above border is Lishi Fault in the surface, inferring that the Ordos block shows a shape of wide in the upper and narrow in the lower part from the surface to deep. The Datong volcanic area at 18~45s period of phase and 24~35s period of group velocity maps shows low velocity of trumpet shape from shallow to deep, related to the upwelling of hot material from lower mantle in the Cenozoic causing a large area of intense magmatic activity. It indicates the more specific upwelling channel of Datong volcanoes simultaneously.

Keyword: ambient seismic noise; phase velocity; group velocity; tomography; Shanxi fault depression zone
0 引言

山西断陷带自北而南由5个断陷盆地组成, 大致呈NNE向排列, 全长1i200km, 总体呈 “ S” 型展布(张世民, 2000)。断陷带地处华北克拉通中部, 西侧为稳定的鄂尔多斯块体, 东侧为经历大规模地壳拉张、 岩石圈破坏、 减薄的华北地台(图1), 众多研究成果指出它受到印欧陆-陆碰撞及青藏高原隆升、 太平洋板块俯冲对其产生的间接作用(张培震等, 2003; 张国民等, 2004; Guo et al., 2016; 于勇等, 2016)。

有史料记载以来, 断陷带发生过8次M≥ 7地震, 全部分布在南北两端的断陷盆地内, 而中部的太原盆地则无历史地震记载; 有地震仪器记录以来的中小地震也主要分布在断陷盆地带内, 仅有少量散布在两侧的隆起区域, 且发震层下界呈现出南深北浅的特征(宋美琴等, 2012; 吴昊昱等, 2017); 尤其是大同火山区的2条共轭断裂交会部位于1989年、 1991年、 1999年先后发生数次5~6级地震。这些地震的孕震环境、孕育过程、 发震机理等都是需要探索的地震科学问题, 因此, 研究山西地区的地壳速度结构对了解该区地震活动的深部构造背景、 动力学过程及危险性分析等具有非常重要的科学意义。

前人在山西地区已经取得了大量壳幔速度结构的研究成果, 如通过P波速度获得了山西北部地区大同盆地下方地壳的孕震环境(徐扬等, 1997; 靳玉科等, 2010; 王霞等, 2015); 大同火山区下方在Rayleigh波相速度图像中呈现低速异常(唐有彩等, 2011; Lei, 2012; 宋美琴等, 2013; 周铭等, 2016); 通过数条宽角反射、 折射地震测深剖面获得了山西部分地区的浅层壳幔结构(如山西高原北部、 五台山地区、 临汾震区、 山西中南部等)(祝治平等, 1994, 1999; 张建狮等, 1997; 赵金仁等, 2006; 李自红等, 2014), 勾勒出山西地震带南北不同的莫霍面起伏形态; 还有更大范围的壳幔速度结构研究中提及到山西地区, 在此不作重点阐述(房立华, 2010; 李鹏等, 2010; 唐有彩等, 2010, 2011; Zheng et al., 2011; 宫猛等, 2016)。 这些成果使我们加深了对山西地区壳幔速度结构的认识, 缺点是仅针对山西局部地区且分辨率不一, 缺少整体区域高分辨率的山西地区大尺度壳幔速度结构的成像结果。 究其原因, 可能是由于山西地区的地震集中区呈带状, 且区域台站分布也呈条带状, 使得大尺度成像的分辨率受到制约, 特别是对浅层地壳速度结构分辨率的约束较差。另外, 台站少且分布不均匀也不利于利用背景噪声获得高质量的较长周期的群速度和相速度成像结果。

近年来, 背景噪声层析成像因不依赖天然地震分布、 可获得较短周期面波频散和密集的射线覆盖、 能够对地壳内部实现整体区域高分辨率成像等优点, 得到了迅速发展和广泛应用(Shapiro et al., 2005; Yao et al., 2008, 2010; Fang et al., 2010; Zheng et al., 2011; 房立华等, 2013; 李小勇等, 2014; 余大新等, 2014; 范莉苹等, 2015; 付媛媛等, 2016; Ai et al., 2018)。本文通过收集记录时间更新、 台站数量成倍增加、 分布更均匀的宽频带连续地震波形记录, 采用背景噪声成像的方法研究山西及其邻区整体区域高分辨率的Rayleigh波群速度和相速度图像, 进而探讨其反映的地质构造和深部地球动力学含义。

1 数据和方法
1.1 台站分布与数据来源

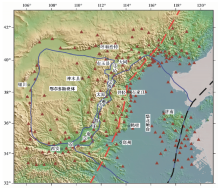
为了获得更为均匀的射线覆盖, 本研究除收集和使用了山西省62个宽频地震台站的数据外, 还从国家数字测震台网数据备份中心收集了邻省和自治区及其外围区域(河北、 陕西、 河南、 内蒙、 甘肃、 宁夏、 山东)154个宽频地震台站记录的2014年连续波形的垂直分量资料(郑秀芬等, 2009), 以提取Rayleigh波的格林函数。所使用的台站分布如图1所示。

图 1 山西断陷带周缘的台站分布图
①大同盆地; ②忻定盆地; ③太原盆地; ④临汾盆地; ⑤运城盆地; ⑥渭河盆地。三角形是本文数据来源的地震台站, 红色虚线是南北重力梯度带, 蓝色线是块体边界
Fig. 1 Sketch map of seismic stations around Shanxi fault depression zone.

1.2 数据处理与成像方法

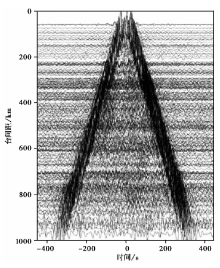
对各台站的垂直分量连续波形记录进行降采样(1Hz), 然后去均值、 去仪器响应、 去线性趋势并进行带通滤波(滤波周期为5~50s); 利用滑动绝对值平均法对单台数据进行时域归一化, 并进行频谱白化处理(Bensen et al., 2007), 以去除天然地震信号、 仪器故障信号及某一单频信号等干扰来提高背景噪声的信噪比, 再计算各台站对间的互相关函数, 可得到1个正的分支和1个负的分支(图2)。为了提高信噪比, 通常取互相关函数的正负分支均值, 得到对称分量, 此后基于对称分量处理数据。将同一台站对累计12个月以天为单位的互相关函数进行叠加, 最后得到每个台站对较高信噪比的互相关函数, 即Rayleigh波的经验格林函数(EGF)。

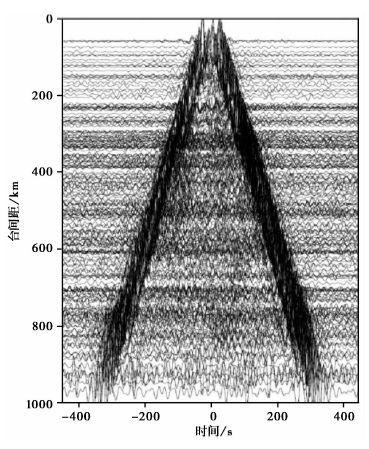
图 2 山西地区部分台站对的互相关波形Fig. 2 Cross-correlation waveforms of part interstations in Shanxi area.

Zheng等(2011)系统分析了日本九州岛定点的噪声源对中国华北、 东北地区的背景噪声层析成像的干扰, 指出该噪声源造成的影响主要集中在日本海、 中国东北和华北区域(图3)。为了消除该影响, 我们根据Zheng 等(2011)的方法, 定量计算了影响的大小, 发现其在周期12~14s有一定的速度干扰, 对相速度、 群速度成像分析产生一定影响, 而周期> 18s后则影响很小。因此, 本文中处理周期12~14s的互相关函数时, 如果九州岛定点噪声源信号的到时与面波信号接近则舍弃这一分支, 从其到时的另一侧来读取正或负分支; 如果可以分离出九州岛信号, 则对前驱干扰信号进行压制后对正负分支计算平均值, 得到对称分量, 以测量频散曲线。

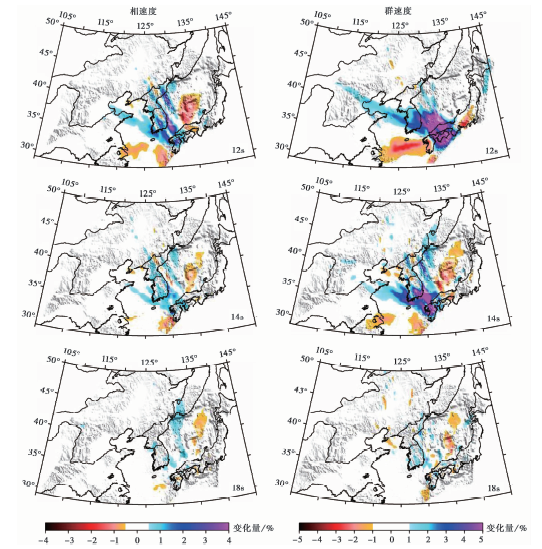
图 3 日本九州岛噪声源对周边区域Rayleigh波群速度和相速度成像的影响(据Zheng et al., 2011)
图中的色标表示因九州岛噪声源影响导致的相速度和群速度测量误差
Fig. 3 The effect on group and phase velocity of Rayleigh wave from Kyushu microseism.

基于上述经验格林函数, 本文采用自动时频分析方法(FTAN, Frequency Time Analysis)(Bensen et al., 2007; Lin et al., 2007)测量Rayleigh波的群速度和相速度, 并根据3个标准(Yang et al., 2010)严格控制质量: 1)台站对间距大于3倍波长; 2)单个周期的EGF信噪比必须> 15; 3)对于各周期频散曲线的筛选, 在成像过程中已获取比较可信的面波速度分布之后, 如果正演计算得到的各个台站对的理论面波走时与提取的频散曲线相差超过12s(群速度)、 5s(相速度), 则去除该条频散曲线。

本文采用Barmin 等(2001)提出的射线理论层析成像法, 将研究区划分为0.25° × 0.25° 的网格, 利用频散曲线的走时信息反演Rayleigh波各周期的群速度和相速度。

1.3 成像分辨率分析

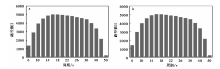
不同周期的群速度和相速度的射线路径分布大致相同, 其中8~40s的射线路径均超过3i000条, 最高达5i000余条(图4), 且山西地区射线覆盖密集, 外围地区射线密度则较低(图5)。
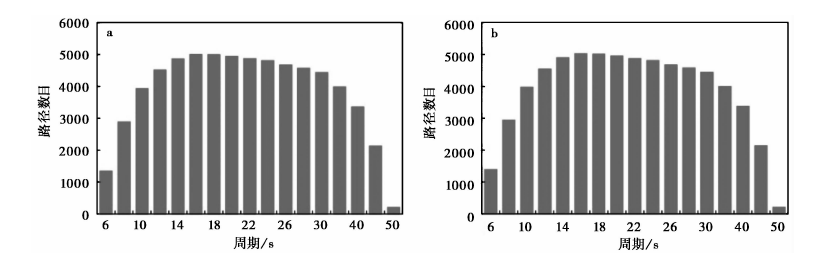
图 4 研究区不同周期射线路径的统计
a 相速度的路径数; b 群速度的路径数
Fig. 4 The number of raypath at different periods.

图 5 研究区射线覆盖分布Fig. 5 Raypath coverage topography.

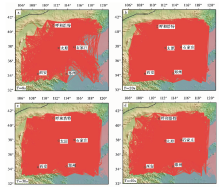
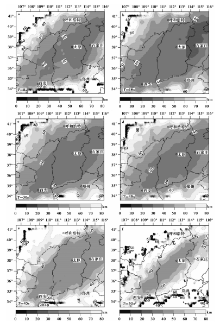
采用Levshin等(2005)的方法获得了区域成像分辨率图像, 由图6可见, 山西地区的相速度横向分辨率全部在50km以内, 特别是18~30s周期(图6b, c), 射线密集分布, 横向分辨率提高至40km, 是目前这一区域分辨率最高的成像结果。群速度的横向分辨率也很类似。下文将对山西及周边地区进行重点论述。

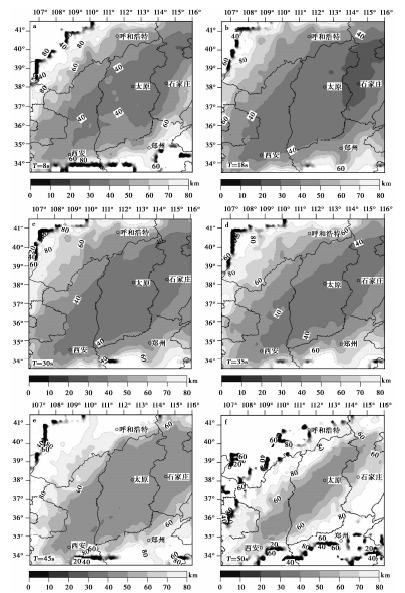
图 6 研究区不同周期相速度分辨率图Fig. 6 Resolution maps of Rayleigh wave phase velocity tomography.

2 结果分析

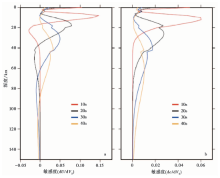
由于相速度测量的不确定性较低, 故相速度图像与群速度相比更加精确。基于美国西部地区参考剪切波速度模型, 计算了面波群、 相速度的敏感核, 可以看出, 群速度的敏感深度比相速度浅(图7)。

图 7 不同周期基阶Rayleigh面波群速度和相速度对横波速度结构的敏感核
a 群速度; b 相速度
Fig. 7 Depth sensitivity kernels of fundamental Rayleigh wave group and phase velocity with respect to shear wave velocity structure at different periods.

周期为8s的相速度和周期为10s的群速度大致揭示了深度≤ 6km的介质特征, 即上地壳浅层的速度结构。由图8a和9a可见, 在此深度上, 山西断陷带除中部太原以南的三大盆地呈现出低速异常外, 两侧的基岩山区(西侧吕梁山、 东侧太行山)和盆间灵石横向隆起、 大同盆地南段、 忻定盆地呈现出明显的高速异常。尤其是西侧吕梁山隆起区的右玉县— 偏关县— 岢岚县— 朔州市和静乐县— 离石, 以及东侧太行山隆起区的盂县— 阜平县— 易县和阳城县— 黎城县一带, 较周围地区呈现更高的速度。另外, 在华北平原裂陷盆地和其西侧太行山脉的交界处存在一条显著的高速、 低速梯度带, 梯度带的位置与众多研究结果一致(Zheng et al., 2011; 郭震等, 2015; Guo et al., 2016)。尽管这一地区不是本文的核心研究区域, 但此现象仍值得关注。 该区域的速度梯度带与华北盆地和太行山交界处的对应性很好, 表明在8~10s周期上, 该梯度带主要体现的是沉积层与上地壳结晶基底的速度变化带, 显示了华北盆地沉积层厚、 速度低的特征。

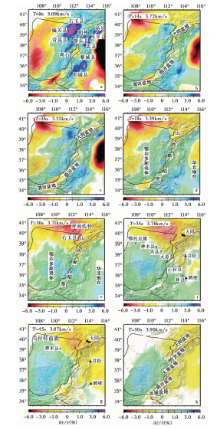
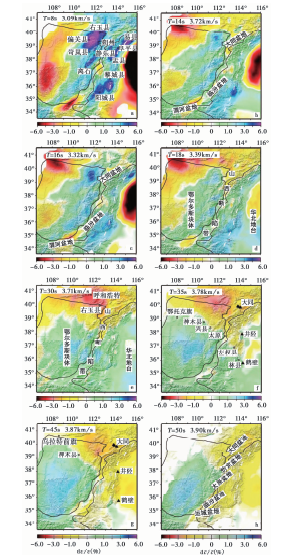
图 8 山西断陷带各周期Rayleigh面波相速度分布图
图中标注为不同周期及其平均相速度值
Fig. 8 Phase velocity maps of Rayleigh wave at different periods in Shanxi fault depression zone.

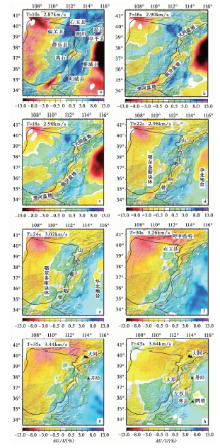
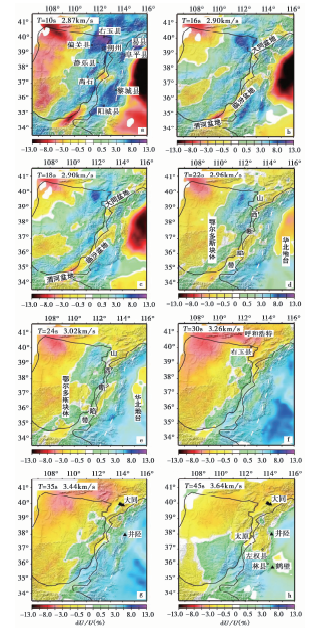
图 9 山西断陷带各周期Rayleigh面波群速度分布图
图中标注为不同周期及其平均群速度值
Fig. 9 Group velocity maps of Rayleigh wave at different periods in Shanxi fault depression zone.

根据敏感核所反映的深度周期, 14~16s周期的相速度(图8b, c)和16~18s周期的群速度(图9b, c)主要反映深度≤ 15km的中上地壳的速度结构, 低速区与高速区的范围与8s周期的相速度、 10s周期的群速度的范围大体一致。其中不同的是, 蓝紫色高速区的范围明显收缩, 且变化幅度显著减小; 沿中部断陷盆地的低速区持续存在, 且北部大同盆地低速现象较为突出。直到16s周期, 相速度图像显示中部断陷盆地的低速区除渭河盆地、 临汾盆地北段外, 其余均逐渐消失, 整个区域表现为高速。

18~30s周期的相速度、 24~35s周期的群速度主要反映深度为20~40km的中下地壳甚至上地幔顶部的速度结构, 由图8d— e、 9e— g可见, 短周期图像所反映的两侧隆起区高速、 断陷盆地低速的现象发生了根本变化, 在太原盆地以北(即38° N以北)的忻定和大同盆地呈现出低速异常, 而38° N以南及两侧山区为高速异常, 低速异常区呈“ 喇叭口” 形插入高速区, 随着周期增大, 低速异常区向东、 西两侧扩展, 面积逐渐增大, 且低速极值区位于大同盆地NW侧的右玉县至呼和浩特一带。

35~45s周期的相速度(图8f, g)和40~45s周期的群速度(图9h)主要反映深度为45~80km的上地幔顶部的速度结构。与中下地壳的图像相比最为显著的现象是, 随着周期增大, 由浅及深, 从北西神木县— 兴县经太原市至南东左权县— 林县存在一条明显的斜穿过山西断陷带的高、 低速梯度带, 低速区由大同附近向SE扩展。不同的是, 45s周期的群速度与35s周期的相速度相比, 二者显示的低速异常区有差异, 但仍可见一条NW向高、 低速梯度带。

通过50s周期的相速度图像可以看出, 除鄂尔多斯块体呈现高速外, 其他区域均呈现低速, 且横向变化较为均匀(图8h), 说明这一周期上鄂尔多斯地块区域主要受岩石圈控制, 而山西裂谷带、 华北克拉通东部等区域则受速度较低的软流圈影响。

需要说明的是, 参考得到的频散核函数, 群速度的敏感深度比相速度浅。对于相同周期, 相速度反映了更深部的速度特征。30~50s周期的相速度图像显示了鄂尔多斯地幔的高速特征, 而此周期的群速度主要反映了地壳和上地幔的特征, 群速度呈低速说明鄂尔多斯地壳较东部华北平原厚。总体而言, 鄂尔多斯块体地壳较厚且地幔呈现高速特征, 与华北平原区别明显, 表明其具有稳定的克拉通性质。地壳越浅, 其横向不均匀性越明显, 故相同周期下群速度的变化更剧烈。

3 讨论
3.1 中上地壳高速区、 低速区与沉积层、 浅部岩性的关系

8s周期的相速度和10s周期的群速度图像中(图8a, 9a)渭河盆地分别呈现出幅度达-6%、 -13%的低速异常, 这与该区域的沉积层分布以及岩石性质有着密切关系。众多研究已经表明, 短周期相速度、 群速度的特征与地壳区域地质构造和沉积层厚度有着密切的关系(房立华, 2010; 李鹏等, 2010; 唐有彩等, 2011; Zheng et al., 2011; 宋美琴等, 2013; 宫猛等, 2016; 周铭等, 2016)。从野外地质调查资料来看, 断陷带各盆地的新生代沉积层厚度不一, 最南端的渭河盆地沉积厚度最大, 达6i000m, 其次为运城盆地, 厚5i500m, 太原盆地厚3i800m, 大同盆地厚3i000m, 临汾盆地厚2i000m(张世民, 2000)。除大同盆地低速异常幅度略小外, 其余4个盆地的低速异常幅度与盆地新生代沉积厚度呈正相关。随着周期增大, 波速对应的深度也逐渐增加, 沉积层的影响逐渐减弱, 深度约20km(约18s周期的相速度(图8d)、 22s周期的群速度(图9d))附近, 除渭河盆地可能由于新生代沉积厚度最大造成整个探测深度的速度偏低外, 其余盆地基本观测不到低速异常区。

8s周期的相速度和10s周期的群速度图像中(图8a, 9a)盆山边界为明显的高、 低速分界带, 西侧吕梁山区的右玉县— 偏关县— 岢岚县— 朔州市和静乐县— 离石以及东侧太行山区的盂县— 阜平县— 易县和阳城县— 黎城县一带较周围地区速度更高, 这可能与这里地表直接出露古生代造山带和前寒武变质基底岩系, 且中新生代沉积盖层较薄有关(马丽芳, 2002)。

16s周期的相速度(图8c)和18s周期的群速度图像(图9c)显示整个区域基本呈高速, 可能反映出随深度增加其岩性的差异逐渐减小, 整个区域以上地壳岩性为主。

3.2 中下地壳速度梯度带

18~30s周期的相速度(图8d, e)、 24~35s周期的群速度图像(图9e— g)的显著特点是以38° N为界, 速度南高、北低。这一特征一方面可能与莫霍面深度南浅北深的起伏变化有关, 其中已有的研究结果显示南部盆地的莫霍面埋深35~37km, 太原盆地为38km, 大同盆地及附近地区达40~42km, 莫霍面最深的地区显示为低速异常, 反之为高速异常。另一方面, 这可能是由于晋北 “ 软块” (岩石圈厚度75~80km)和晋南 “ 硬块” (岩石圈厚100~120km)在38° N纬线附近的古缝合带在该深度上开始反映其构造特征(邢集善等, 1991)。此外, 接收函数的研究结果揭示太行山北段下地壳出现部分熔融, 而南段仍保持稳定(北段泊松比> 0.3, 南段泊松比约0.25~0.26), 其南、 北两段正经历着不同的地质过程(唐有彩等, 2010), 这与南、 北两段分别呈现高速、 低速特征也较为吻合。

而30~45s周期的相速度(图8e— g)揭示出自神木县— 兴县经太原市至左权县— 林县存在斜穿山西断陷带深部的NW向速度梯度带, 该带的NE侧在这一深度范围存在较大面积的低速区, 可能与大同、 井陉和鹤壁地区的新生代火山活动均位于该梯度带及其NE侧有关。

3.3 鄂尔多斯地块高速异常及其北部、 东部断陷带

从30~50s周期的相速度图像可见, 鄂尔多斯高速区北边界并非与地表相同, 呈规则的近EW向展布, 而是向S收缩, 自鄂托克旗— 神木县(图8f)到乌拉特前旗— 神木县(图8g)呈NW向展布, 特别是其东侧边界为山西裂谷带的中部断陷盆地西界(图8g, h)。而一些研究成果显示(廖昌珍等, 2007; 赵国泽等, 2010; 陈兆辉等, 2014), 鄂尔多斯块体与太行山中央造山带地表以离石断裂为界, 说明鄂尔多斯块体从浅表向下呈现出上窄下宽的形态。

3.4 大同火山带低速异常

18~45s周期的相速度和24~45s周期的群速度结果中(图8d— g, 图9e— h), 大同及附近地区的低速异常从下地壳一直延伸至上地幔顶部, 且低速区域随着深度增加而逐渐扩大, 与宋美琴等(2013)得到的20~54s周期的面波相速度分布图像较为相似, 唐有彩等(2011)利用背景噪声成像在该区域也得到了类似的结果。该低速异常可能是大同火山区岩浆上涌的通道。 Zheng 等(2011)利用背景噪声成像对华北克拉通、 东北和日本海等地区的壳幔结构进行了研究, 认为华北克拉通东部块体边界在上地幔80km深度处存在 “ 马蹄” 形低速异常, 分别沿南北重力梯度带和郯庐断裂带分布, 其中低速异常也延伸至大同火山区附近, 而这些低速异常反映了强烈的构造热活动侵蚀使岩石圈活化、 改造。值得一提的是, 本文的结果显示大同火山带的低极值区域并非位于盆地内地表火山锥出露的位置, 而是向W偏移到大同盆地的西界外侧, 这可能说明大同火山上涌通道从深部到地表呈一个近似单边的 “ Y” 形, 与宋美琴等(2013)的研究结果相比, 本文对上涌通道的认识更加精细。本文的结果表明, 此深度范围的大同火山带之下的低速异常区远大于地表火山带的范围, 还向南沿山西断陷带的下部延伸。

4 结论

本文利用背景噪声层析成像的方法得到了山西地区8~50s周期的相速度和群速度的分布图像, 刻画了山西地区较精细的地壳和上地幔速度结构, 反映出不同深度的地质构造特征。

短周期相速度(8~18s)图像和群速度(10~22s)图像显示山西裂谷带中部的断陷盆地为低速异常, 且地表的沉积层一直延伸至中上地壳, 其中渭河盆地的速度最低, 且各盆地低速异常幅度从南至北逐渐减小, 这可能与山西裂谷带从SW至NE逐渐拉张发展的过程有关, 且南部的盆地发育比北部更为成熟(张培震等, 2003); 两侧基岩山区呈现高速异常, 而盆山边界为明显的高、 低速分界带, 表明盆山基底构造的深度可达中地壳, 这与山西地区中小震精定位深度范围相吻合, 且地震深度分布与盆山构造深部形态具有较好的相关性(宋美琴等, 2012)。

18~30s周期的相速度、 24~35s周期的群速度均显示山西地区以38° N为界, 北部的忻定和大同盆地呈现低速异常, 而南部的盆地和两侧山区为高速异常, 揭示了受岩石圈和软流圈结构及其流变性的运动所控制的晋北 “ 软块” 和晋南 “ 硬块” 古缝合带在深部的构造特征。35s周期的群速度略微显示出NW向梯度带且低速区范围较小, 这可能反映了莫霍面的控制作用, 即莫霍面较深对应低速异常、 莫霍面较浅对应高速异常。这与山西裂谷带地壳厚度呈北深南浅的结论较为一致。同时, 这可能是太行山南、 北两段不同地质过程的一种高速、 低速的反映。

30~50s周期的相速度显示出明显的NW向高、 低速梯度带斜穿过山西裂谷带, 且低速区由浅至深从大同地区向SE扩展, 可能与新生代火山活动有关; 尽管目前在地表并未发现NW向大型构造带, 但P波速度结构反演结果、 重力布格异常等均显示存在一个NW向梯度带。另外, 鄂尔多斯块体的北边界在这一周期的分布图像可向S收缩至鄂托克旗— 神木县, 并非沿地表的EW向阴山断裂带展布; 前人认为其西边界是离石断裂, 而本文的结果显示为向E拓展到山西裂谷带中部断陷盆地西侧的控盆断裂, 反映了鄂尔多斯块体从地表向下呈现出上窄下宽的形态。

大同火山区18~45s周期的相速度和24~45s周期的群速度均显示低速异常由浅至深面积不断显著地扩展, 这可能与下地幔热物质上涌所导致的大同地区大面积的新生代强烈岩浆活动有关, 由深至浅呈现出的单 “ Y” 形上涌通道可能反映了这些岩浆的活动路径。

The authors have declared that no competing interests exist.

参考文献
[1] 陈兆辉, 楼海, 孟小红, . 2014. 鄂尔多斯块体—华北地区地壳上地幔P波三维速度结构[J]. 地球物理学进展, 29(3): 9991007.
CHEN Zhao-hui, LOU Hai, MENG Xiao-hong, et al. 2014. 3D P-wave velocity structure of crust and upper mantle beneath Ordos block and North China[J]. Progress in Geophysics, 29(3): 9991007(in Chinese). [本文引用:1]
[2] 范莉苹, 吴建平, 房立华, . 2015. 青藏高原东南缘瑞利波群速度分布特征及其构造意义探讨[J]. 地球物理学报, 58(5): 15551567.
FAN Li-ping, WU Jian-ping, FANG Li-hua, et al. 2015. The characteristic of Rayleigh wave group velocities in the southeastern margin of the Tibetan Plateau and its tectonic implications[J]. Chinese Journal of Geophysics, 58(5): 15551567(in Chinese). [本文引用:1]
[3] 房立华. 2010. 华北地区瑞利面波噪声层析成像研究[J]. 国际地震动态, (2): 4042.
FANG Li-hua. 2010. Rayleigh wave tomography from ambient seismic noise in North China[J]. Recent Developments in World Seismology, (2): 4042(in Chinese). [本文引用:2]
[4] 房立华, 吴建平, 王未来, . 2013. 华北地区勒夫波噪声层析成像研究[J]. 地球物理学报, 56(7): 22682279.
FANG Li-hua, WU Jian-ping, WANG Wei-lai, et al. 2013. Love wave tomography from ambient seismic noise in North China[J]. Chinese Journal of Geophysics, 56(7): 22682279(in Chinese). [本文引用:1]
[5] 付媛媛, 高原. 2016. 东北地区背景噪声的Rayleigh和Love波相速度层析成像[J]. 地球物理学报, 59(2): 484503.
FU Yuan-yuan, GAO Yuan. 2016. Phase velocity tomography of Rayleigh and Love waves using ambient noise in Northeast China[J]. Chinese Journal of Geophysics, 59(2): 484503(in Chinese). [本文引用:1]
[6] 宫猛, 郭蕾, 王晓山, . 2016. 基于背景噪声研究河北及邻区群速度分布特征[J]. 华北地震科学, 34(1): 612.
GONG Meng, GUO Lei, WANG Xiao-shan, et al. 2016. Group velocity distribution in Hebei and its adjacent area based on seismic ambient noise[J]. North China Earthquake Sciences, 34(1): 612(in Chinese). [本文引用:2]
[7] 郭震, 陈永顺, 殷伟伟. 2015. 背景噪声面波与布格重力异常联合反演: 山西断陷带三维地壳结构[J]. 地球物理学报, 58(3): 821831.
GUO Zhen, CHEN Yong-shun, YIN Wei-wei. 2015. Three-dimensional crustal model of Shanxi graben from 3D joint inversion of ambient noise surface wave and Bouguer gravity anomalies[J]. Chinese Journal of Geophysics, 58(3): 821831(in Chinese). [本文引用:1]
[8] 靳玉科, 梁向军, 靳玉贞, . 2010. 大同震区地震序列震源位置及震源区速度结构初探[J]. 山西地震, (3): 16.
JIN Yu-ke, LIANG Xiang-jun, JIN Yu-zhen, et al. 2010. Study on earthquake sequence location and velocity structure in Datong hypocenter area[J]. Earthquake Research in Shanxi, (3): 16(in Chinese). [本文引用:1]
[9] 李鹏, 周仕勇, 陈永顺, . 2010. 利用双平面波干涉面波层析成像方法研究山西断陷盆地及鄂尔多斯地台三维速度结构[J]. CT理论与应用研究, 19(3): 4760.
LI Peng, ZHOU Shi-yong, CHEN Yong-shun, et al. 2010. 3D velocity structure in Shanxi graben and Ordos from two plane waves method[J]. CT Theory and Applications, 19(3): 4760(in Chinese). [本文引用:2]
[10] 李小勇, 朱培民, 周强, . 2014. 三峡库区上地壳横波速度结构[J]. 地球科学(中国地质大学学报), 39(12): 18421850.
LI Xiao-yong, ZHU Pei-min, ZHOU Qiang, et al. 2014. S-wave velocity structure of upper crust in Three Gorges reservoir region of the Yangtze River[J]. Earth Science(Journal of China University of Geosciences), 39(12): 18421850(in Chinese). [本文引用:1]
[11] 李自红, 刘保金, 袁洪克, . 2014. 临汾盆地地壳精细结构和构造-地震反射剖面结果[J]. 地球物理学报, 57(5): 14871497.
LI Zi-hong, LIU Bao-jin, YUAN Hong-ke, et al. 2014. Fine crustal structure and tectonics of Linfen Basin from the results of seismic reflection profile[J]. Chinese Journal of Geophysics, 57(5): 14871497(in Chinese). [本文引用:1]
[12] 廖昌珍, 张岳桥, 温长顺. 2007. 鄂尔多斯盆地东缘边界带构造样式及其区域构造意义[J]. 地质学报, 81(4): 466474.
LIAO Chang-zhen, ZHANG Yue-qiao, WEN Chang-shun. 2007. Structural styles of the eastern boundary zone of the Ordos Basin and its regional tectonic significance[J]. Acta Geologica Sinica, 81(4): 466474(in Chinese). [本文引用:1]
[13] 马丽芳. 2002. 中国地质图集 [CM]. 北京: 地质出版社.
MA Li-fang. 2002. Geological Atlas of China [CM]. Geological Publishing House, Beijing(in Chinese). [本文引用:1]
[14] 宋美琴, 何正勤, 郑勇, . 2013. 山西地区面波相速度分布图像[J]. 地球物理学进展, 28(4): 18361848.
SONG Mei-qin, HE Zheng-qin, ZHENG Yong, et al. 2013. Rayleigh-wave phase velocity distribution in Shanxi region[J]. Progress in Geophysics, 28(4): 18361848(in Chinese). [本文引用:2]
[15] 宋美琴, 郑勇, 葛粲, . 2012. 山西地震带中小震精确位置及其显示的山西地震构造特征[J]. 地球物理学报, 55(2): 513525.
SONG Mei-qin, ZHENG Yong, GE Can, et al. 2012. Relocation of small to moderate earthquakes in Shanxi Province and its relation to the seismogenic structures[J]. Chinese Journal of Geophysics, 55(2): 513525(in Chinese). [本文引用:2]
[16] 唐有彩, 冯永革, 陈永顺, . 2010. 山西断陷带地壳结构的接收函数研究[J]. 地球物理学报, 53(9): 21022109.
TANG You-cai, FEGN Yong-ge, CHEN Yong-shun, et al. 2010. Receiver function analysis at Shanxi rift[J]. Chinese Journal of Geophysics, 53(9): 21022109(in Chinese). [本文引用:2]
[17] 唐有彩, 陈永顺, 杨英杰, . 2011. 华北克拉通中部地区背景噪声成像[J]. 地球物理学报, 54(8): 20112022.
TANG You-cai, CHEN Yong-shun, YANG Ying-jie, et al. 2011. Ambient noise tomography in North China Craton[J]. Chinese Journal of Geophysics, 54(8): 20112022(in Chinese). [本文引用:4]
[18] 王霞, 宋美琴, 王亮, . 2015. 口泉断裂及其邻近地区的地壳速度结构[J]. 地震地质, 37(4): 939952. doi: DOI: 103969/j. issn. 0253-4967. 2015. 04. 001.
WANG Xia, SONG Mei-qin, WANG Liang, et al. 2015. Study on crustal velocity structure beneath Kouquan Fault and adjacent area[J]. Seismology and Geology, 37(4): 939952(in Chinese). [本文引用:1]
[19] 吴昊昱, 吕睿. 2017. 2016年运城4. 4级地震序列精定位及发震构造分析[J]. 地震地磁观测与研究, 38(5): 813.
WU Hao-yu, Rui. 2017. Fine location and seismogenic structure analysis of Yuncheng M4. 4 earthquake sequence in 2016[J]. Seismological and Geomagnetic Observation and Research, 38(5): 813(in Chinese). [本文引用:1]
[20] 邢集善, 叶志光, 孙振国. . 1991. 山西板内构造及其演化特征初探[J]. 山西地质, 6(1): 315.
XING Ji-shan, YE Zhi-guang, SUN Zhen-guo, et al. 1991. Preliminary discussions on intraplate structural features and their evolution in Shanxi Province[J]. Shanxi Geology, 6(1): 315(in Chinese). [本文引用:1]
[21] 徐扬, 田勇, 啜永清, . 1997. 大同—阳高6. 1级震群震源区及其附近地区地壳三维P波速度结构反演[J]. 山西地震, (1-2): 2529.
XU Yang, TIAN Yong, CHUO Yong-qing, et al. 1997. Inversion of 3 dimensional P wave velocity structure of curst in focal region and itsnearby region of Datong Yanggao M6. 1 earthquake[J]. Earthquake Research in Shanxi, (1-2): 2529(in Chinese). [本文引用:1]
[22] 余大新, 李永华, 吴庆举, . 2014. 利用Rayleigh波相速度和群速度联合反演青藏高原东北缘S波速度结构[J]. 地球物理学报, 57(3): 800811.
YU Da-xin, LI Yong-hua, WU Qing-ju, et al. 2014. S-wave velocity structure of the northeastern Tibetan Plateau from joint inversion of Rayleigh wave phase and group velocities[J]. Chinese Journal of Geophysics, 57(3): 800811(in Chinese). [本文引用:1]
[23] 于勇, 陈永顺, 菅汉超, . 2016. 华北克拉通中部过渡带SKS波分裂研究: 鄂尔多斯东南角的局部软流圈绕流[J]. 地球物理学报, 59(1): 141151.
YU Yong, CHEN Yong-shun, JIAN Han-chao, et al. 2016. SKS wave splitting study of the transition zone at the central portion of the North China Craton[J]. Chinese Journal of Geophysics, 59(1): 141151(in Chinese). [本文引用:1]
[24] 张国民, 马宏生, 王辉, . 2004. 中国大陆活动地块与强震活动关系[J]. 中国科学(D辑), 34(7): 591599.
ZHANG Guo-min, MA Hong-sheng, WANG Hui, et al. 2004. Relationship between the active blocks in Chinese mainland and the strong seismic activity[J]. Science in China(Ser D), 34(7): 591599(in Chinese). [本文引用:1]
[25] 张建狮, 祝治平, 张先康, . 1997. 山西高原北部地壳上地幔地震波速结构与深部构造[J]. 地震地质, 19(3): 220226.
ZHANG Jian-shi, ZHU Zhi-ping, ZHANG Xian-kang, et al. 1997. The seismic velocity structure of crust and upper mantle and deep structure feature in north Shanxi plateau[J]. Seismology and Geology, 19(3): 220226(in Chinese). [本文引用:1]
[26] 张培震, 邓起东, 张国民, . 2003. 中国大陆的强震活动与活动地块[J]. 中国科学(D辑), 33(S1): 1219.
ZHANG Pei-zhen, DENG Qi-dong, ZHANG Guo-min, et al. 2003. Active tectonic blocks and strong earthquakes in continent of China[J]. Science in China(Ser D), 33(S1): 1219(in Chinese). [本文引用:2]
[27] 张世民. 2000. 汾渭地堑系盆地发育进程的差异及其控震作用[J]. 地质力学学报, 6(2): 3037.
ZHANG Shi-min. 2000. Basin evolutionary differences and seismotectonics of Fenwei graben system[J]. Journal of Geomechanics, 6(2): 3037(in Chinese). [本文引用:2]
[28] 赵国泽, 詹艳, 王立凤, . 2010. 鄂尔多斯断块地壳电性结构[J]. 地震地质, 32(3): 345359. doi: DOI: 103969/j. issn. 0253-4967. 201003. 001.
ZHAO Guo-ze, ZHAN Yan, WANG Li-feng, et al. 2010. Electric structure of the crust beneath the Ordos fault block[J]. Seismology and Geology, 32(3): 345359(in Chinese). [本文引用:1]
[29] 赵金仁, 张先康, 张成科, . 2006. 山西五台山地区地壳深部结构特征研究[J]. 地球物理学报, 49(1): 123129.
ZHAO Jin-ren, ZHANG Xian-kang, ZHANG Cheng-ke, et al. 2006. Features of deep crustal structure beneath the Wutai Mountain area of Shanxi Province[J]. Chinese Journal of Geophysics, 49(1): 123129(in Chinese). [本文引用:1]
[30] 郑秀芬, 欧阳飚, 张东宁, . 2009. “国家测震台网数据备份中心”技术系统建设及其对汶川大地震研究的数据支撑[J]. 地球物理学报, 52(5): 14121417. doi: DOI: 103969/j. issn. 0001-5733. 2009. 05. 031.
ZHENG Xiu-fen, OUYANG Biao, ZHANG Dong-ning, et al. 2009. Technical system construction of data backup centre for China seismograph network and the data support to researches on the Wenchuan earthquake[J]. Chinese Journal of Geophysics, 52(5): 14121417(in Chinese). [本文引用:1]
[31] 祝治平, 张建狮, 张成科, . 1999. 山西中南部壳幔结构的研究[J]. 地震学报, 21(1): 4249.
ZHU Zhi-ping, ZHANG Jian-shi, ZHANG Cheng-ke, et al. 1999. Study on crust and mantle structure beneath the central and southern Shanxi[J]. Acta Seismologica Sinica, 21(1): 4249(in Chinese). [本文引用:1]
[32] 祝治平, 张建狮, 周雪松, . 1994. 山西临汾震区地区上地幔构造的研究[J]. 华北地震科学, 12(1): 7784.
ZHU Zhi-ping, ZHANG Jian-shi, ZHOU Xue-song, et al. 1994. Study on the structure of the crust and upper mantle in Linfen earthquake region in Shanxi[J]. North China Earthquake Sciences, 12(1): 7784(in Chinese). [本文引用:1]
[33] 周铭, 徐朝繁, 耿伟, . 2016. 山西地区地壳S波速度结构[J]. 大地测量与地球动力学, 36(10): 912917.
ZHOU Ming, XU Zhao-fan, GENG Wei, et al. , 2016. The crustal S-wave velocity structure of Shanxi region[J]. Journal of Geodesy and Geodynamics, 36(10): 912917(in Chinese). [本文引用:2]
[34] Ai S X, Zheng Y, Muhammad S R, et al. 2019 . Seismic evidence on different rifting mechanisms in southern and northern segments of the Fenhe-Weihe rift zone[J]. Journal of Geophysical Research: Solid Earth. In press. https://doi.org/10.1029/2018JB016476. [本文引用:1]
[35] Barmin M P, Ritzwoller M H, Levshin A L. 2001. A fast and reliable method for surface wave tomography[J]. Pure and Applied Geophysics, 158(8): 13511375. [本文引用:1]
[36] Bensen G D, Ritzwoller M H, Barmin M P, et al. 2007. Processing seismic ambient noise data to obtain reliable broad-band surface wave dispersion measurements[J]. Geophysical Journal International, 169(3): 12391260. doi: DOI:10.1111/j.1365-246X.2007.03. [本文引用:2]
[37] Fang L H, Wu J P, Ding Z F, et al. 2010. High resolution Rayleigh wave group velocity tomography in North China from ambient seismic noise[J]. Geophysical Journal International, 181(2): 11711182. doi: DOI:10.1111/j.1365-246X.2010.04571.x. [本文引用:1]
[38] Guo Z, Afonso J C, Qashqai M T, et al. 2016. Thermochemical structure of the North China Craton from multi-observable probabilistic inversion: Extent and causes of cratoniclithosphere modification[J]. Gondwana Research, 37: 252265. [本文引用:2]
[39] Lei J S. 2012. Upper-mantle tomography and synamics beneath the North China Craton[J]. Journal of Geophysical Research: Solid Earth, 117(B6), B06313. doi: DOI:10.1029/2012JB009212. [本文引用:1]
[40] Levshin A L, Barmin M P, Ritzwoller M H, et al. 2005. Minor-arc and major-arc global surface wave diffraction tomography[J]. Physics of the Earth and Planetary Interiors, 149(3-4): 205223. [本文引用:1]
[41] Lin F C, Ritzwoller M H, Townend J. 2007. Ambient noise Rayleigh wave tomography of New Zealand [J]. Geophysical Journal International, 170(2): 649666. [本文引用:1]
[42] Shapiro N M, Campillo M, Stehly L, et al. 2005. High-resolution surface-wave tomography from ambient seismic noise[J]. Science, 307(5715): 16151618. [本文引用:1]
[43] Yang Y J, Zheng Y, Chen J, et al. 2010. Rayleigh wave phase velocity maps of Tibet and the surrounding regions from ambient seismic noise tomography[J]. Geochemistry, Geophysics, Geosystems, 11(8): Q08010. doi: DOI:10.1029/2010GC003119. [本文引用:1]
[44] Yao H J, Beghein C, van der Hilst R D. 2008. Surface wave array tomography in SE Tibet from ambient seismic noise and two-station analysis-Ⅱ. Crustal and upper-mantle structure[J]. Geophysical Journal International, 173: 205219. doi: DOI:10.1111/j.1365-246X.2007.03696.x [本文引用:1]
[45] Yao H J, Vand erHilst R D, Montagner J P. 2010. Heterogeneity and anisotropy of the lithosphere of SE Tibet from surface wave array tomography[J]. Journal of Geophysical Research: Solid Earth, 115(B12): B12307. doi: DOI:10.1029/2009jb007142. [本文引用:1]
[46] Zheng Y, Shen W S, Zhou L Q, et al. 2011. Crust and uppermost mantle beneath the North China Craton, northeastern China, and the Sea of Japan from ambient noise tomography[J]. Journal of Geophysical Research: Solid Earth, 116(B12): B12312. doi: DOI:10.1029/2011JB008637. [本文引用:6]