

基于逻辑回归模型的九寨沟地震滑坡危险性评估
[马思远1  , 许冲
, 许冲1, * , 田颖颖1 , 徐锡伟1, 2 ]
, 许冲, 田颖颖|
|


作者简介:马思远, 男, 1992年生, 中国地震局地质研究所构造地质学专业在读硕士研究生, 主要从地震滑坡危险性研究, E-mail: 87856449@qq.com。
发生于2017年8月8日的四川九寨沟 MS7.0地震触发了大量的同震滑坡。基于Geoeye-1震后0.5m分辨率的遥感影像开展极震区同震滑坡解译, 圈定了4834处滑坡。选择高程、 坡度、 坡向、 水平断层距离、 垂直断层距离、 震中距离、 河流距离、 道路距离、 TPI指数以及岩性共10个因子作为地震滑坡的影响因子, 应用逻辑回归(Logistic Regression, LR)模型开展九寨沟地震滑坡危险性评价, 并对评价结果的合理性进行检验。结果表明, 基于LR模型的滑坡危险性评价图与实际滑坡发育情况十分吻合, 其中五花海—夏莫段、 火花海和九寨天堂洲际大饭店—如意坝段均为滑坡危险性极高的区域。采用ROC曲线对危险性评价结果进行模型成功率与预测率的定量评价, 结果显示, LR模型的预测精度较为理想, 训练样本集和验证样本集的AUC值分别为0.91和0.89。文中结论为震区恢复重建工作中地震滑坡的防灾减灾提供了科学参考。
The MS7.0 Jiuzhaigou earthquake in Sichuan Province of 8 August 2017 triggered a large number of landslides. A comprehensive and objective panorama of these landslides is of great significance for understanding the mechanism, intensity, spatial pattern and law of these coseismic landslides, recovery and reconstruction of earthquake affected area, as well as prevention and mitigation of landslide hazard. The main aim of this paper is to present the use of remote sensing images, GIS technology and Logistic Regression(LR)model for earthquake triggered landslide hazard mapping related to the 2017 Jiuzhaigou earthquake. On the basis of a scene post-earthquake Geoeye-1 satellite image(0.5m resolution), we delineated 4834 co-seismic landslides with an area of 9.63km2. The ten factors were selected as the influencing factors for earthquake triggered landslide hazard mapping of Jiuzhaigou earthquake, including elevation, slope angle, aspect, horizontal distance to fault, vertical distance to fault, distance to epicenter, distance to roads, distance to rivers, TPI index, and lithology. Both landsliding and non-landsliding samples were needed for LR model. Centroids of the 4834 initial landslide polygons were extracted for landslide samples and the 4832 non-landslide points were randomly selected from the landslide-free area. All samples(4834 landslide sites and 4832 non-landslide sites)were randomly divided into the training set(6767 samples)and validation set(2899 samples). The logistic regression model was used to carry out the landslide hazard assessment of the Jiuzhaigou earthquake and the results show that the landslide hazard assessment map based on LR model is very consistent with the actual landslide distribution. The areas of Wuhuahai-Xiamo, Huohuahai and Inter Continental Hotel of Jiuzhai-Ruyiba are high hazard areas. In order to quantitatively evaluate the prediction results, the trained model calculated with the training set was evaluated by training set and validation set as the input of the model to get the output results of the two sets. The ROC curve was used to evaluate the accuracy of the model. The ROC curve for LR model was drawn and the AUC values were calculated. The evaluation result shows good prediction accuracy. The AUC values for the training and validation data set are 0.91 and 0.89, respectively. On the whole, more than 78.5% of the landslides in the study area are concentrated in the high and extremely high hazard zones. Landslide point density and landslide area density increase very rapidly as the level of hazard increases. This paper provides a scientific reference for earthquake landslides, disaster prevention and mitigation in the earthquake area.
地震滑坡往往造成重大的人员伤亡与财产损失, 因而受到了地学科学领域相关专家的广泛的关注(Keefer, 1984; Xu et al., 2016; Rao et al., 2017)。开展地震滑坡研究对地震灾区的防灾减灾、 灾区恢复重建具有重要意义(Xu et al., 2013a, b)。当前, 常用的地震滑坡危险性评价方法主要包括基于简单力学原理的Newmark简易模型方法和基于数学模型的统计分析方法。基于力学模型的简化Newmark位移分析方法充分考虑了地震滑坡发生的机理, 将坡体失稳机制和滑移过程的分析结果用于滑坡危险性的定量分级, 是目前国际上应用比较广泛的一种地震滑坡危险性评估方法。该方法也被应用于多个区域地震滑坡定量危险性评估工作中, 如1979年Coyote Lake地震(Wilson et al., 1983)、 1994年MW6.7北岭地震(Jibson et al., 2000)、 2008年MW7.9汶川地震(Godt et al., 2008)、 2015年MW7.9尼泊尔地震(Gallen et al., 2017)和2017年MW7.0九寨沟地震(刘甲美等, 2017)。但是Newmark评估方法只有在获得较为明确的岩土物理力学性质及地震动参数的条件下, 才能获得较为准确的坡体位移(Dreyfus et al., 2013)。而在现有的条件下获取大区域内的岩土体参数和准确的地震动分布存在较大的难度, 且已得到的参数与实际值之间存在一定的差距, 所以目前利用Newmark模型进行区域滑坡评估的结果不够理想。
随着GIS的发展, 基于数学分析方法的地震滑坡危险区域评估已有大量研究出现。 该方法假设的前提是未来发生地质灾害的条件和过去相同, 利用已发生的地震滑坡, 建立这些滑坡与相关滑坡影响因子(包括水文因素、 人类活动因素和地貌因素等)的数学模型, 再将建立的数学模型应用于整个地震区的区域性评估(Guzzetti et al., 1999; Ohlmacher et al., 2003; Lee, 2005)。许多学者结合信息量法(Demir et al., 2013)、 Logistic回归(Dai et al., 2001; Umar et al., 2014; Bai et al., 2015)、 模糊逻辑(Ercanoglu et al., 2011; Kritikos et al., 2015)、 人工神经网络(Pradhan et al., 2010)、 支持向量机(Yao et al., 2008; Xu et al., 2012a)等模型对滑坡的区域性进行了评估, 并且取得了良好的应用效果。但是, 随着越来越多的模型与方法应用于地质灾害的预测和评价领域, 对这些模型和方法进行分类并比较其结果的精确性则十分必要。一些研究将不同统计分析方法运用到区域的滑坡区域评价当中 (Yalcin, 2008; Pradhan, 2010; Akgun, 2012; Xu et al., 2012b; Kavzoglu et al., 2015, Youssef et al., 2015), 并对这些评价模型的预测结果和精度进行对比, 结果表明, 基于逻辑回归(Logistic Regression, LR)模型的统计分析方法在区域性滑坡预测中的效果较好。LR模型是一种非线性多元统计模型, 因其具有计算简单、 物理意义明确等优点, 在滑坡敏感性评价中应用较为广泛(Dai et al., 2001; Bai et al., 2010; Bui et al., 2011)。该方法在汶川地震(Xu et al., 2012a)、 玉树地震(许冲等, 2012)中都得到了应用, 并取得了良好的评价效果。
本文基于前期九寨沟地震的滑坡解译结果, 选择多个影响地震滑坡的影响因子, 利用LR模型对研究区进行地震滑坡危险性评价, 探讨LR模型在该区域的适用性, 以期更加深入地理解滑坡及其致灾因子间的关系, 同时为九寨沟地震的防灾减灾工作提供有益的参考。
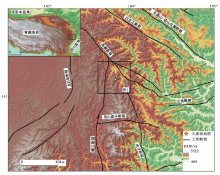
印度板块向N俯冲受到欧亚板块的阻挡, 导致物质隆升形成青藏高原。在高原内部自南向北形成一系列向E挤出的块体, 如羌塘与巴颜喀拉地块等。2017年MW7.0九寨沟地震是继2013年MW6.6芦山地震以来发生在巴颜喀拉块体边界的又一次强烈地震。九寨沟地震发生在巴颜喀拉块体的东北边界, 即东昆仑断裂东段附近。从区域构造的角度来看, 由于巴颜喀拉块体的SE向运动受到华南块体的阻挡, 使得该区域发生强烈变形。此次地震的发震断层为虎牙断裂向N的延伸段, 震中位于塔藏断裂、 岷江断裂、 虎牙断裂3条全新世活动断裂的交会处(徐锡伟等, 2017)。
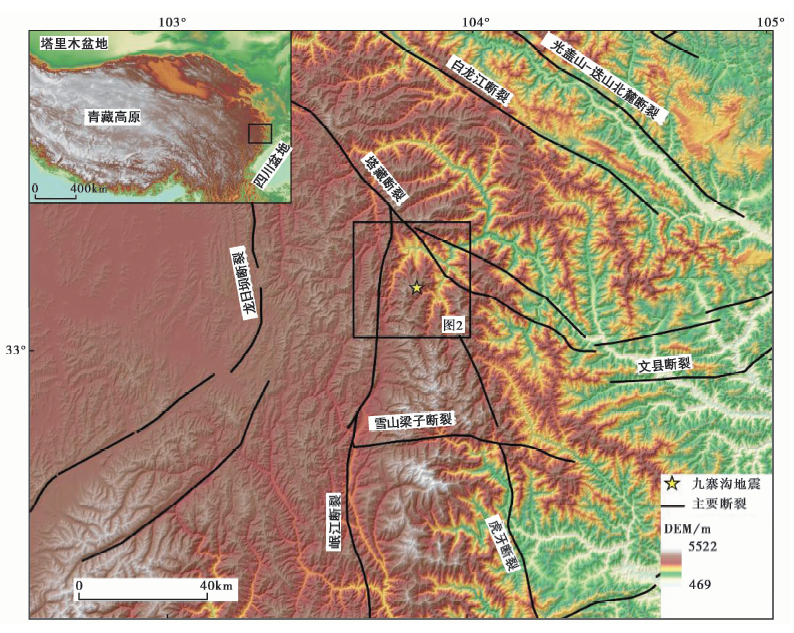 | 图 1 2017年九寨沟地震区域构造图(活动断层数据来自徐锡伟等, 2016)Fig. 1 Map showing topography and tectonic setting of 2017 Jiuzhaigou earthquake (The data of active faults is from XU Xi-wei et al., 2016). |
LR模型是应变量为二值分类变量的回归模型, 在滑坡敏感性评价中是应用较为广泛的一种非线性多元统计模型(Dai et al., 2001; Ayalew et al., 2005)。本研究选取LR模型主要包括以下3个原因: 1)能进行不同类型的自变量分析(包括连续型变量和离散型变量); 2)该模型不要求自变量符合正态分布, 对识别变量的分布无限制, 可以用来预测具有二项特点的因变量概率问题; 3)LR模型属于多元统计方法, 其根据实际的滑坡点样本与不滑点样本, 综合评价各影响因子, 可较好地解决因子间相互依赖的问题(Mathew et al., 2009; Conoscenti et al., 2014)。LR模型将因变量转化为发生(记为1)和不发生(记为0)的二元逻辑变量。滑坡发生的概率与影响因子之间的关系可表示为
其中, P代表滑坡发生的概率, 范围为[0, 1]。 Z代表变量叠加后的线性权重值的和; χ i代表各个影响因子, β i是逻辑回归系数。
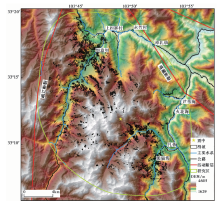
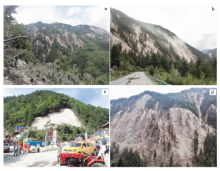
滑坡编录图是研究区域内滑坡分布与相关因素的重要依据。本研究采用的滑坡分布数据通过地震前后高分辨率遥感影像解译获得, 震前的影像来自Google Earth平台, 震后的影像为Geoeye-1正射融合影像, 采集时间为2017年8月14日, 分辨率为0.5m。通过目视解译的方法, 结合部分滑坡的野外调查工作, 最终得到本次地震触发滑坡的分布图(图2), 其中共包含4834处滑坡。这些滑坡主要以中小型浅层滑坡和崩塌为主, 滑坡主要沿NW-SE向断层呈明显的带状分布, 受地震地表破裂控制强烈, 常常连片发育(许冲等, 2018)。根据这些滑坡的空间位置, 大体框定出滑坡区的分布范围, 将其作为研究区(图2), 面积为434.2km2。研究区内的高程为2070~4470m。这4834处滑坡的总面积为9.63km2, 研究区内滑坡面积所占的百分比为2.22%, 滑坡点密度为11.13个/km2。区内地层岩性以石炭系灰岩、 砂岩、 白云岩、 板岩以及古近-新近系砾岩为主, 主要河流有白河、 九寨沟和日寨沟等。图 3为九寨沟地震触发的一些典型滑坡的照片。
 | 图 2 研究区范围及九寨沟地震同震滑坡分布图Fig. 2 The study area and spatial distribution map of Jiuzhaigou earthquake-triggered landslides. |
 | 图 3 九寨沟地震滑坡照片Fig. 3 Several typical landslides triggered by the 2017 Jiuzhaigou earthquake. |
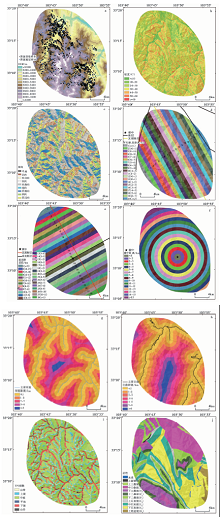
选取适当的评价参数对建立评价模型十分重要, 但目前针对地震滑坡区域性评估的影响因子还无统一的选取标准(Yalcin, 2008)。本研究搜集了研究区内的地形、 地质、 地震及其他相关数据, 选取高程、 坡度、 坡向、 平行发震断层距离、 垂直发震断层距离、 震中距离、 河流距离、 道路距离、 TPI指数以及岩性共10个影响因素参与滑坡危险性的评价。其中研究区内DEM的分辨率为10m。坡度、 坡向数据基于该DEM获得, 河流网也是由DEM提取的区域内的干流和主要支流所构成。岩性和断裂为地震滑坡的重要地质影响因子, 本文使用的岩性数据来自于 1︰20万地质图。研究区内地层岩性按照地层年代共分为10类岩组, 主要包括泥盆系的深灰色薄-中层状生物灰岩夹泥质灰岩, 石炭系的致密灰岩、 薄厚层状燧石灰岩, 二叠系的中厚块角砾状灰岩、 砂泥质灰岩, 三叠系的厚层状凝灰质砂岩、 石英砂岩, 以及古近-新近系的中-厚层状砾岩、 砂质砾岩。此次九寨沟地震为左旋走滑型地震(徐锡伟等, 2017), 但考虑到断层两盘可能存在的差异性, 将整个研究区域按与断层平行的距离共分成20类。对于垂直于断层的距离, 考虑到不同发震断层分段内的断层性质可能不同, 按与断层的垂直距离, 以1km为间隔将整个研究区域分成28类。最终, 将所有矢量化格式的影响因子图层以10m× 10m 的分辨率进行栅格化(图4)。
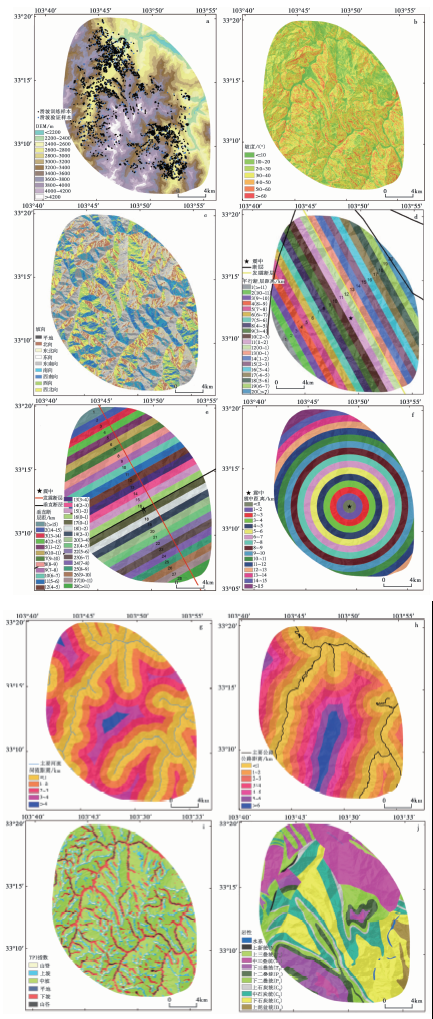 | 图 4 滑坡危险性影响因子数据及分类标准 a 高程; b 坡度; c 坡向; d 平行发震断层距离; e 垂直发震断层距离; f 震中距离; g 河流距离; h 道路距离; i TPI 指数; j 岩性 Fig. 4 Map showing each of the impact factors and their classes. |
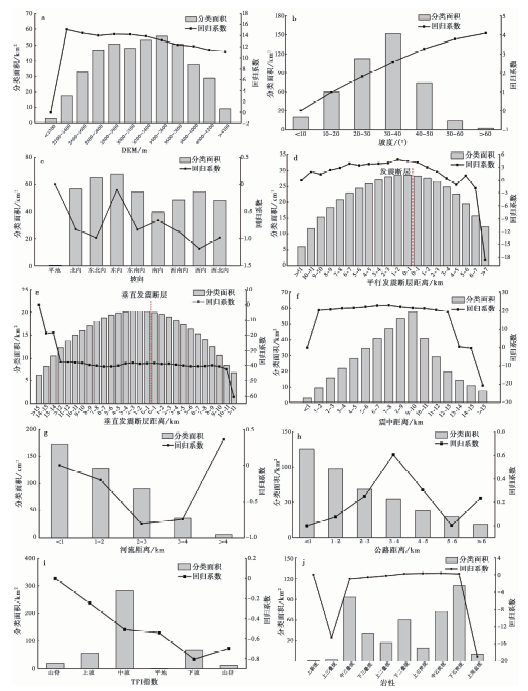
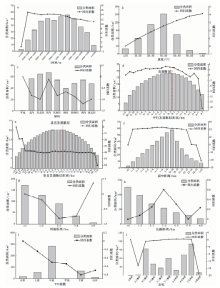
图 5 各影响因子分级的回归系数Fig. 5 Coefficients of the evaluation variables.
将九寨沟地震的滑坡分布点数据作为滑动样本, 共得到4834个滑坡样本。将这4834个滑坡样本随机分成3384个滑坡训练样本和1450个滑坡验证样本, 图4a展示了这些滑坡样本点的分布情况。在距离滑坡样本点100m的缓冲区外随机选择4832个不滑点样本, 将这4832个不滑点样本也随机分成3383个训练样本和1449个验证样本。如此, 即得到所需的训练样本集和验证样本集。其中6767个样本点作为模型的训练样本集, 剩余的2899个样本点作为验证样本集。基于上述滑坡影响因子, 利用LR模型对研究区的滑坡危险性进行评价, 并利用ROC曲线对评价结果进行精度验证。
利用SPSS软件对得到的6767个训练样本进行逻辑回归, 得到每个影响因子分级的回归系数, 该系数越大, 则表明相应的影响因子在此分级内的滑坡危险度越高(许冲等, 2012)。图 5为所有影响因子的分级回归系数曲线。图5b显示了坡度的回归系数随着坡度的增加而增加, 表明坡度越大, 滑坡危险度越高。平行发震断层距离的回归系数曲线(图5d)也表明, 回归系数整体上随着与断层距离的增加而减小。图5e显示了垂直发震断层距离的回归系数曲线, 从图中可以发现, 垂直发震断层距离的回归系数并未随着距离的变化而变化, 这与实际滑坡的分布情况并不相同, 出现该现象可能是由于地震滑坡的发生受多种因素的控制, 包括地质因素、 地形因素、 地震因素等, 这些因素共同决定着滑坡的发育强度与分布样式。LR模型属于多元统计分析, 不同于二元统计分析法, 该方法对各个影响因子进行综合评价, 这说明了发震断层不同段落对发生地震滑坡的影响是相近的。本次地震在沿发震断层的方向上存在2个地震滑坡高密度区, 即五花海附近和如意坝附近区域, 说明了这2个密集分布区形成的原因并非由地震破裂在这2个位置出现了2个滑动量峰值, 即并非由地震因素导致, 而更可能是受地形因素与地质因素影响。这2个区域之间的地区海拔较高, 破裂面相对较深, 导致地表效应不显著, 因而同震滑坡较少。在地质方面, 可能由于高海拔地区松散堆积物少, 而九寨沟地震滑坡又多属于浅层堆积层滑坡, 因此高海拔地区不易发生同震滑坡。关于本次地震的破裂过程与性质, 张旭等(2017)基于地震资料和InSAR资料联合反演得到的结果也表明此次地震的破裂过程并无2个滑动量峰值与同震滑坡的高密度区相对应, 而是一个从震中向两侧衰减的单峰值事件。这也与本研究得到的结果相一致, 即此次地震滑坡的分布可能受地震因素影响较小, 而受地形因素与地质因素影响较大。
设每个因子的第一个分级的回归系数值为0, 并与其他不同分级的回归系数值进行对比, 若值为正, 则表明该因子分级的滑坡危险度比第一个因子分级大; 若值为负, 则表明该因子分级的滑坡危险度比第一个因子分级小。整个回归分析结果的常数值β 0为-0.044。
依据回归系数为每个影响因子赋予相应的权重值, 然后通过对各个影响因子层的叠加操作得到LR模型的滑坡危险性指数分布图(图6)。
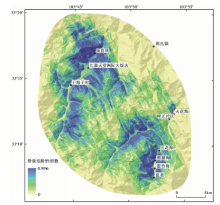
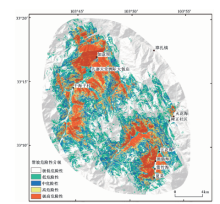
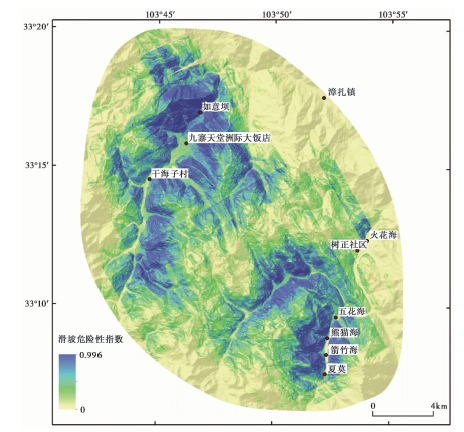 | 图 6 九寨沟地震滑坡危险性指数分布图Fig. 6 Landslide hazard index map of Jiuzhaigou earthquake triggered landslides. |
每隔0.2为1个级别, 根据滑坡危险性指数将研究区分为极低危险区(0~0.2)、 低危险区(0.2~0.4)、 中危险区(0.4~0.6)、 高危险区(0.6~0.8)和极高危险区(0.8~1)。图7为九寨沟滑坡危险性分区图。从图中可以看出, 五花海— 夏莫段、 火花海和九寨天堂洲际大饭店— 如意坝段均为滑坡的极高危险区, 而实际的滑坡分布也表明, 大部分的滑坡都沿这些区域的沟谷两侧发育。
 | 图 7 九寨沟地震滑坡危险性评价结果图Fig. 7 Landslide hazard map of Jiuzhaigou earthquake triggered landslides. |
为了定量地评价滑坡空间预测结果, 将训练后的模型分别以训练样本和验证样本数据作为模型输入进行计算, 得到2种样本的输出结果。本研究采用ROC曲线对模型的精度进行评价。ROC曲线为受试者工作特征曲线(Receiver Operating Characteristic Curve), 是反映敏感性和特异性连续变量的综合指标, 并采用构图法揭示两者的相互关系(Gorsevski et al., 2006)。将ROC曲线应用于地质灾害敏感性模型评价的概念对应关系为: 1)灵敏度: 实际为真值且判断为真值的概率, 即实际上是地质灾害且模型判断为地质灾害的概率; 2)特异度: 实际为假值且判断为假值的概率, 即实际上非地质灾害且模型判断为非地质灾害的概率。
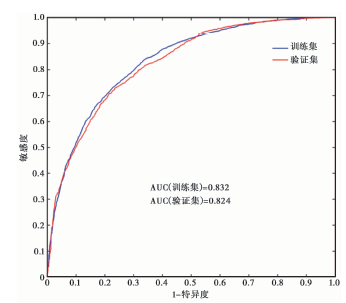 | 图 8 基于逻辑回归模型的ROC曲线Fig. 8 ROC curve for logistic regression(LR). |
在统计模型中, 常常用AUC(Area under the Curve)来评估二分类模型的性能, 即ROC曲线下的面积。其评判标准为: 当AUC< 0.5时, 预测结果相反; 当AUC=0.5时, 模型预测结果随机; AUC为0.5~0.7时, 模型预测结果准确度较低; AUC为0.7~0.9时, 模型预测结果准确度较高; 当AUC> 0.9时, 模型预测结果准确度极高(Fawcett, 2006)。将通过训练样本集与验证样本集得到的输出结果分别导入至SPSS软件进行计算, 所得的ROC曲线结果如 图8所示。其中训练样本和验证样本的AUC分别为0.91和0.89, 表明LR模型的预测精度较为理想。
滑坡编录图作为地震滑坡危险性评估最重要的基础数据, 其所包含的滑坡数据的质量直接影响模型的评估结果(Xu et al., 2014)。戴岚欣等(2017)基于震后解译的1883处滑坡, 采用LR模型, 利用8个相关因子, 对九寨沟地震滑坡进行了快速评估。从评估结果来看, 模型评估准确率为0.851, 精度较高。而本研究基于更为完整和详细滑坡编录图(4834处滑坡), 选用10个因子使用LR模型进行评估, 所得结果的准确率更高, 其中训练样本和验证样本的AUC分别为0.91和0.89。此外, 从评估结果图来看, 基于本研究结果得到的滑坡危险区与实际的滑坡分布情况更为吻合, 2处滑坡密集分布的区域(即五花海和如意坝地区)均为危险性极高的区域。而位于震中附近的滑坡低密度区则为极低危险区域。戴岚欣等(2017)的评估结果则并未较好地反映实际的滑坡分布情况, 本次地震的震中区域为滑坡的低密度区, 但其评估结果却显示该区域为滑坡易发区。由此可知, 通过更为详细的滑坡数据得到的评价结果与实际滑坡分布更加吻合, 得到的模型准确率更高。
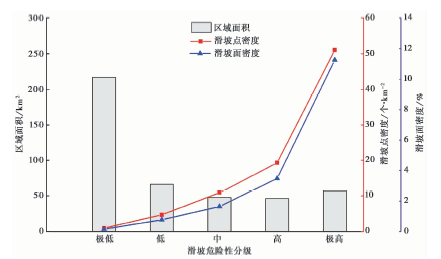 | 图9 不同危险性级别滑坡统计结果Fig. 9 Histogram showing relative distribution and landslide occurrence of various susceptibility levels. |
| 表1 滑坡危险性分级统计 Table1 Landslide statistic result in different landslide susceptibility rank |
图 9和表1是对每个危险性分类的面积与其中发生的滑坡数量和面积的统计结果。由图 9和表1可知, 极高危险区的面积为56.81km2, 占总研究区面积的13.08%, 其中实际发生的滑坡数量为2901个, 占滑坡总数量的60.01%, 分级内滑坡点密度为51.06个/km2, 滑坡面密度为11.26%。高危险区的面积为46.25km2, 占总研究面积的10.65%, 其中实际发生的滑坡数量为894个, 分级内滑坡点密度为19.33个/km2; 滑坡面密度为3.48%。总体上, 超过78.5% 的滑坡都集中在高危险性和极高危险性的区域。
而在低危险性区域内, 滑坡的数量较少、 面积较小。低危险区的面积为66.51km2, 占研究区面积的15.31%, 其中实际发生的滑坡数量为312个, 占滑坡总数量的6.45%, 分级内滑坡点密度为4.69个/km2, 滑坡面密度为0.77%。极低危险区的面积为216.92km2, 占研究区面积的49.96%, 其中实际发生的滑坡数量仅为208个, 分级内滑坡点密度为0.96个/km2, 滑坡面密度为0.15%。总体上, 在低危险区和极低危险区内, 滑坡发育的数量极少。从图 9中也可以发现, 滑坡点密度和滑坡面密度随着危险性级别的升高而急速升高。
本研究应用逻辑回归(Logistic Regression, LR)模型开展九寨沟地震的滑坡危险性评价。结果表明, 基于LR模型的滑坡危险性评价图与实际滑坡发育情况十分吻合, 其中五花海— 夏莫段、 火花海和九寨天堂洲际大饭店— 如意坝段均为滑坡的极高危险区。震中附近区域为高海拔区域, 导致地震破裂埋藏较深, 同震滑坡这一地表效应不显著。而滑坡较为集中的2个区域(五花海区域和如意坝区域)由于海拔较低, 地表破裂埋藏相对较浅, 同震滑坡这一地表效应显著, 导致这些区域同震滑坡极为发育。通过与实际滑坡分布的对比, 得到本研究的地震滑坡评价模型的成功率与预测率分别为91%与89%。本文可为震区恢复重建工作中的地震滑坡防灾减灾提供有效的参考依据。
The authors have declared that no competing interests exist.
| [1] |
|
| [2] |
|
| [3] |
|
| [4] |
|
| [5] |
|
| [6] |
|
| [7] |
|
| [8] |
|
| [9] |
|
| [10] |
|
| [11] |
|
| [12] |
|
| [13] |
|
| [14] |
|
| [15] |
|
| [16] |
|
| [17] |
|
| [18] |
|
| [19] |
|
| [20] |
|
| [21] |
|
| [22] |
|
| [23] |
|
| [24] |
|
| [25] |
|
| [26] |
|
| [27] |
|
| [28] |
|
| [29] |
|
| [30] |
|
| [31] |
|
| [32] |
|
| [33] |
|
| [34] |
|
| [35] |
|
| [36] |
|
| [37] |
|
| [38] |
|
| [39] |
|
| [40] |
|
| [41] |
|
| [42] |
|
| [43] |
|