

基于高分辨率地形数据的冲洪积扇特征提取与演化模式讨论——以海原断裂带老虎山地区冲洪积扇为例
[韩龙飞1  , 刘静
, 刘静1 , 袁兆德1 , 邵延秀2 , 王伟1 , 姚文倩1 , 王鹏1 , 梁欧博3 , 徐心悦1 ]
, 刘静|
|


〔作者简介〕 韩龙飞, 男, 1994年生, 2012年于中国矿业大学资源与地球科学学院获地球物理学专业学士学位, 现为中国地震局地质研究所构造地质学专业在读硕士生, 主要从事强震地表破裂与第四纪地貌研究, 电话: 18810836782, E-mail: hanlongfei16@mails.ucas.cn。
干旱—半干旱地区第四纪冲洪积扇蕴含着丰富的气候与构造信息, 划分并描述不同时期的冲洪积扇单元及其地貌特征是开展第四纪冲洪积扇研究的重要步骤。野外考察等传统方法是对冲洪积扇进行描述与填图的最重要的途径之一, 但在此之前对冲洪积扇进行大范围的自动化地貌初步分级则可为地貌填图提供指导, 从而提高后续的野外工作效率。文中借助航空影像生成的0.2m分辨率数字高程模型提取老虎山地区各冲洪积扇单元的起伏度与粗糙度, 实现对各冲洪积扇单元的分类与差异探讨。研究表明, 随着提取窗口尺寸的增大, 粗糙度迅速增大, 而当提取窗口增大到一定程度后粗糙度过渡为缓慢增大并达到稳定的状态。在尺寸为8m×8m的滑动取样窗口下, 起伏度与粗糙度随着冲洪积扇年龄的增加, 呈现先减小而后增大的趋势, 这恰好反映了冲洪积扇的动态演化过程。
, LIU-ZENG JingRange-front alluvial fan deposition in arid and semiarid environments records vast amounts of climatic and tectonic information. Differentiating and characterizing alluvial fan morphology is an important part in Quaternary alluvial fan research. Traditional method such as field observations is a most important part of deciphering and mapping the alluvial fan. Large-scale automatically mapping of alluvial fan stratigraphy before traditional field observations could provide guidance for mapping alluvial fan morphology, thus improving subsequent field work efficiency. In this research, high-resolution topographic data were used to quantify relief and roughness of alluvial fan within the Laohushan. These data suggest that mean surface roughness plotted against the size of the moving window is characterized by an initial increase in surface roughness with increased window size, but it shows no longer increase as a function of windows size. These data also suggest that alluvial fans in this study site smooth out with time until a threshold is crossed where roughness increases at greater wavelength with age as a result of surface runoff and headward tributary incision into the oldest surfaces which suggests the evolution process of alluvial fan.
Researchers usually differentiate alluvial morphology by mapping characteristics of fan surface in the field by describing surface clast size, rock varnish accumulation, and desert pavement development and analysis of aerial photographs or satellite imagery. Recently, the emergence of high-resolution topographic data has renewed interest in the quantitative characterization of alluvial and colluvium landforms. Surface morphology that fan surface initially tends to become smoother with increasing age due to the formation of desert pavement and the degradation of bar-and-swale topography and subsequently, landforms become more dissected due to tectonics and climatic change induced increased erosion and channelization of the surface with time is widely used to distinguish alluvial fan types. Those characteristics would reflect various kinds of morphology metrics extracted from high-resolution topographic data. In the arid and semiarid regions of northwestern China, plenty of alluvial fans are preserved completely for lack of artificial reforming, and there exists sparse surface vegetation. In the meantime, range-front alluvial fan displaced by a number of active faults formed a series of dislocated landforms with different offsets which is a major reference mark in fault activity research. In this research, six map units(Qf6—Qf1), youngest to oldest, were observed in the study area by mapping performed by identifying geomorphic features in the field that are spatially discernible using hill-shade and digital orthophoto map. Alluvial fan relief and roughness were computed across multiple observation scales(2m×2m to 100m×100m)based on the topographic parameters of altitude difference and standard deviation of slope, curvature and aspect.
In this research, mean relief keeps increasing with increased window size while mean surface roughness is characterized by a rapid increase over wavelengths of 6~15m, representing the typical length scale of bar-and-swale topography. At longer wavelengths, surface roughness values increase by only minor amounts, suggesting the topographic saturation length is 6~15m for those fan surfaces in which saturation length of standard deviation of curvature is less than 8m. Box and whisker plot of surface roughness averaged over 8m2 for each alluvial fan unit in the study area suggests that the pattern of surfaces smoothing out with age and then starting to become rougher again as age increases further beyond Qf4 or Qf3 unit. The younger alluvial fan is characterized by prominent bar-and-swale while the older alluvial fan is characterized by tributaries headward incision. Cumulative frequency distributions of relief and surface roughness in
Surface roughness, in addition to facilitating the characterization of individual fan units, lends insight to alluvial landform development. We summarize an alluvial landform evolutionary scheme which evolves four stages depending on characteristics of alluvial fan morphology development and features of relief and roughness. The initial stage in this study site is defined as the active alluvial fan channels with bars of coarse cobbles and boulders and swales consisting of finer-grained pebbles and sand which could be reflected by high mean relief and mean roughness values. As time goes, bar-and-swale topography is still present, but an immature pavement, composed of finer grained clasts, has started to form. In the third stage, the bar-and-swale topography on the fan surface is subdued, yet still observable, with clasts ranging from pebbles to cobbles in size and there exists obvious headward tributary incision. Eventually, tributary channels form from erosion by surface runoff. Headward incision of these tributaries wears down the steep walls of channels that are incised through the stable, planar surface, transforming the oldest alluvial landforms into convex hillslopes, leaving only small remnants of the planar surface intact. Those evolutionary character suggests that alluvial fans in this area smooth out with time, however, relief or roughness would be translated to increase at greater wavelength with age until a threshold is crossed.
This research suggests that relief and roughness calculated from high-resolution topographic data of this study site could reflect alluvial fan morphology development and provide constraint data to differentiate alluvial fan unit.
冲洪积扇是山麓地带普遍发育的地貌现象, 尤其在干旱— 半干旱地区保存较为完整, 记录着丰富的气候与构造信息(Davis, 1906; Bull, 1977, 1991; Wells et al., 1987; Lubetkin et al., 1988; Matmon et al., 2005; Ari et al., 2006; Nichols et al., 2006; Frankel et al., 2007; Bacon et al., 2010; Hetz et al., 2016)。研究人员通常会通过野外考察观测到的扇面砾石分布、 土壤发育、 岩石漆生长和冲沟发育程度等信息(Wells et al., 1987; Bull, 1991; Ritter et al., 1993), 或者借助航空、 卫星影像解译等手段对冲洪积扇的期次进行划分(Bull, 1991; Farr et al., 1996; Kierein-young, 1997; Beratan et al., 1998; Crouvi et al., 2006; 张露等, 2008; 林国青等, 2013)。
近年来, 随着高分辨率地形数据的出现及其在地球科学领域的广泛应用, 对冲洪积扇地貌的研究也逐渐从定性描述向定量分析转变(Beratan et al., 1998; Glenn et al., 2006; Frankel et al., 2007; 廖静娟等, 2009; 林国青等, 2013; Regmi, 2014; Hetz et al., 2016)。不同时期冲洪积扇的差异性, 一方面表现为扇面砾石的差异特征, 即扇体越老, 表面砾石粒径越小, 这反映了冲洪积扇受风化作用的影响; 另一方面, 扇体受到冲沟侵蚀下切的影响, 会呈现出不同程度的分散(Bull, 1991)。这些特点可以反映在基于高精度地形数据提取的各种地貌参数指标上, 因而可以结合多种指标对这些不同期次的冲洪积扇地貌单元进行识别和划分(Bull, 1991; Burbank et al., 2011; Regmi, 2014)。
中国西北干旱— 半干旱地区由于人为改造较少, 地表植被稀疏, 大量山前冲洪积扇保存较为完整。同时, 众多活动断裂断错这些山前冲洪积扇, 形成的一系列不同量级的断错地貌成为研究断裂活动性的主要参考标志之一(Bull, 1977, 2008; Burbank et al., 2011)。因此, 本文选取了中国西北干旱— 半干旱地区老虎山山前第四纪冲洪积扇作为研究对象。首先在室内利用高分辨率地形数据提取冲洪积扇的起伏度和粗糙度等地貌指标, 对不同期次的冲洪积扇进行初步的识别和划分, 然后结合野外考察, 对研究区冲洪积扇进行精细刻画与分期。最后, 通过对这些地貌参数与冲洪积扇发育关系的分析, 讨论不同年龄冲洪积扇地貌特征和演化特点。
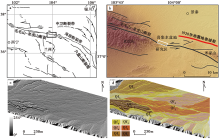
研究区位于青藏高原东北缘, 景泰盆地西南侧, 老虎山山麓地带(图1a, b)。该区地处黄土高原与腾格里沙漠的过渡地带, 属于温带干旱性大陆气候, 年均气温约10℃, 年均降雨量不足185mm, 蒸发量却高达303mm, 主要降水集中于4— 10月份(杨天润, 2013)。山麓地带发育大量不同时期的冲洪积扇, 同时, 多个冲洪积扇被老虎山断层左旋断错(何文贵等, 1994; 刘百篪等, 1994; 刘小凤等, 1994; Lasserre et al., 1999; Liu-Zeng et al., 2007; 刘静等, 2013; 陈涛等, 2014; Chen et al., 2018; 刘金瑞等, 2018)。
 | 图 1 研究区地质构造概略图、 山影图与冲洪积扇分类图Qf6、 Qf5、 Qf4、 Qf3、 Qf2和Qf1表示野外地貌填图解译的由新到老的冲洪积扇地貌单元Fig. 1 Schematic map of geologic structure, hillshade, and classification of alluvial fan of the research area. |
老虎山东北山麓发育了不同期次的冲洪积扇单元。 本文综合利用山体阴影图(图1c)与正射影像图, 结合野外实地考察, 根据扇面砾石分布、 土壤发育、 岩石漆生长和冲沟发育等特点, 将冲洪积扇由新到老依次划分为Qf6、 Qf5、 Qf4、 Qf3、 Qf2和Qf1(图1d), 其特征如下:
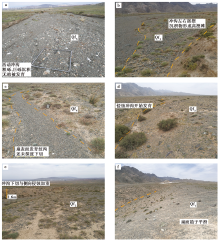
(1)Qf6: Qf6为现代活动冲沟, 是研究区最年轻的地貌单元(图2a)。该区发育的活动冲沟基本上都是季节性冲沟, 平时沟内无恒定水流, 在雨季或强降雨的情况下沟内才会形成水流。沟床内沉积了大量砾石, 沿水流方向呈条带状分布, 可以形成局部的沙坝高地。砾石以粗砾和巨砾为主, 呈棱角状、 次棱角状, 且砾石表面无岩石漆发育。另外, 沟床内无土壤发育, 且植被相对较少。
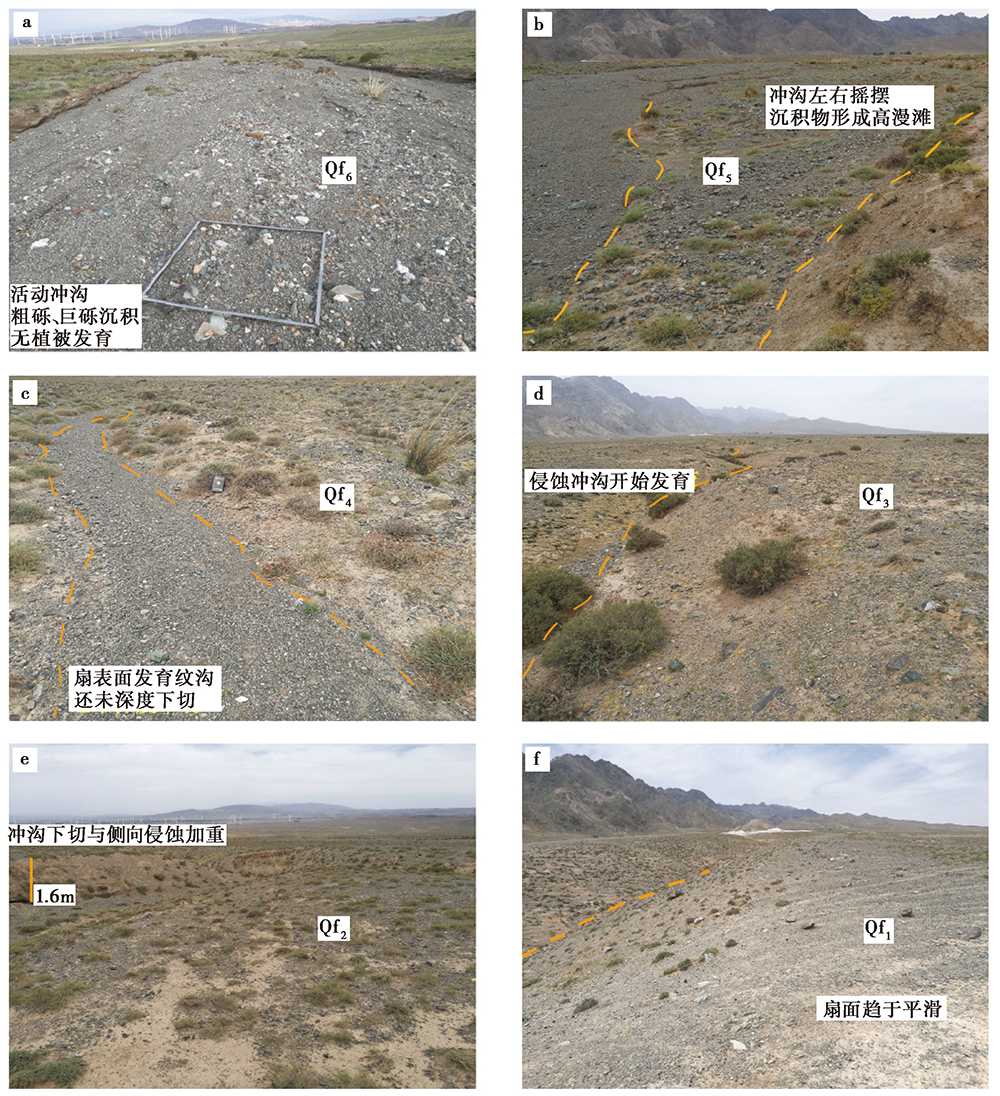 | 图 2 老虎山地区不同期次冲洪积扇野外照片Fig. 2 Photos of landforms with different ages in Laohushan area. |
(2)Qf5: 随着堆积物的增加、 活动冲沟的左右摆动, 沟床废弃而形成Qf5(图2b), 各单元之间以活动冲沟为分界线, 表面侵蚀冲沟发育较少, 且砾石表面无岩石漆发育。虽然已脱离了活动冲沟的影响, 但是较大的洪水仍然可漫至该地貌面上, 此时的地貌面相当于高漫滩。
(3)Qf4: 该地貌面基本脱离洪水的影响, 形成了冲洪积台地(图2c)。沉积砾石以细砾和粗砾为主, 呈不规则分布, 扇面开始发育土壤, 植被也开始增多。地势平坦, 扇面较少有冲沟发育。
(4)Qf3: 形成后的冲洪积台地, 在经过一段时间后, 台地面上发育的纹沟开始侵蚀下切, 下切深度最大可达0.9m(图2d)。冲洪积扇表面逐渐趋于平滑, 砾石尺寸逐渐减小, 部分巨砾原地破碎, 且大砾石表面生长极薄的岩石漆。沿冲沟两侧植被生长较多。
(5)Qf2: 当Qf3进一步发育之后, 冲沟侵蚀下切的程度增大, 下切深度可达1.4m, 扇面被切割成条带状(图2e)。扇面出现较多砾石原地破碎的现象, 巨砾与部分粗砾表面生长较薄的岩石漆。冲沟两侧植被发育较多。
(6)Qf1: 与周围地貌面的地形高差最大, 最高可达1.5~1.8m(图2f)。表面发育成熟的侵蚀冲沟, 将冲洪积扇切割成分散状, 冲沟宽度加大, 两侧形成冲沟阶地。冲洪积扇表面以细砾堆积为主, 偶尔出现原地破碎的巨砾, 大砾石表面发育岩石漆。土壤层表面光滑, 植被发育较少。
Qf6至Qf1显示了研究区的冲洪积扇从新到老, 由活动冲沟逐渐向高漫滩、 冲洪积台地以及稳定冲洪积扇转变的过程, 该过程中扇体表面砾石受到的剥蚀风化作用逐渐减小, 而侵蚀冲沟逐渐发育。
2011年中国地震局地质研究所沿海原断裂带采集了长约120km, 宽约1km范围内的LiDAR点云数据和航空影像, 覆盖了毛毛山-老虎山断裂、 海原断裂(狭义)东段和西段。点云密度达到4~6点/m2, 最终生成的数字高程模型数据(Digital Elevation Model, DEM)分辨率为0.5m, 正射影像数据分辨率为0.1m(刘静等, 2013)。本文借助于该项目获取的航空影像, 使用PhotoScan和QT Modeler等数据处理软件生成老虎山东北麓0.2m分辨率的数字高程模型和0.1m分辨率的正射影像。
根据冲洪积扇表面的形态特点, 我们对不同期次的扇体进行了初步分级(Wells et al., 1987; Bull, 1991; Ritter et al., 1993)。随着时间的流逝, 扇体表面的砾石分布与冲沟的形态都会发生变化(Bull, 1991, 1977; Matmon et al., 2005)。一方面, 随着冲洪积扇年龄的增大, 扇体表面的砾石及其分布会因长时间的剥蚀风化作用而逐渐变小, 并且趋于平滑, 起伏度与粗糙度会随之减小; 后期, 由于冲沟的发育规模越来越大, 反而会造成扇体表面的起伏度与粗糙度增大(Bull, 1991; Frankel et al., 2007)。基于这些特点, 我们尝试利用高精度DEM数据提取地表起伏度和粗糙度参数以量化这些地表特征。利用ArcMap邻域分析中的焦点统计和栅格计算器, 并借助Python模块程序编码快速提取冲洪积扇单元在2~100m取样窗口下的起伏度与粗糙度(王康等, 2013)。利用该方法, 将提取窗口设置为相同的长度与宽度, 分别提取4种参数: 最大值(EMAX)、 最小值(EMIN)、 起伏度(ERelief=EMAX-EMIN)以及标准差(ESTD), 具体过程如图3所示。粗糙度是通过计算提取窗口内坡度、 曲率和坡向的标准偏差而得到的结果, 即3个参数的标准偏差(Regmi, 2014)。此外, 在提取数据时应选取该冲洪积扇的中心部位, 避免边缘冲沟的影响。
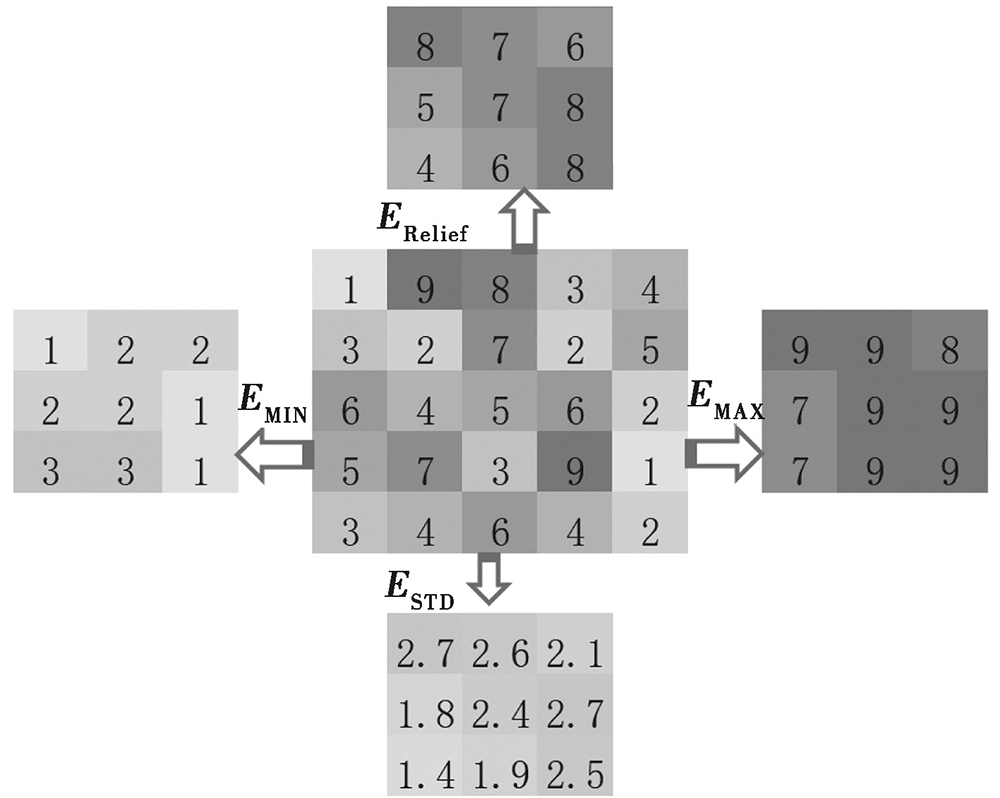 | 图 3 3m× 3m滑动窗口下起伏度与粗糙度参数的提取流程图以左上角框为例, 设置3m× 3m的滑动窗口, 提取的EMIN 值为1, EMAX 值为9, ERelief=EMAX-EMIN=8, ESTD 值为2.7(保留小数点后1位), 滑动窗口依次提取各3m× 3m框内的数值Fig. 3 Flow diagram of extracting relief and roughness with a 3m× 3m moving window. |
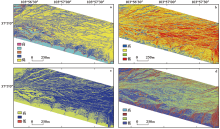
本文利用这种方法对研究区的冲洪积扇地貌单元进行了起伏度与粗糙度的提取。为进一步探索这几种地貌参数所反映的冲洪积扇单元的差异, 本文采用栅格重分类的方法划分了不同的数值范围, 以凸显差异性(汤国安等, 2006)。具体如下: 将起伏度划分为5段, 各粗糙度指标分别划分为4段、 3段和4段(图4)。经栅格重分类后, 起伏度与粗糙度更清晰地展示了冲沟分布以及冲洪积扇的边界。
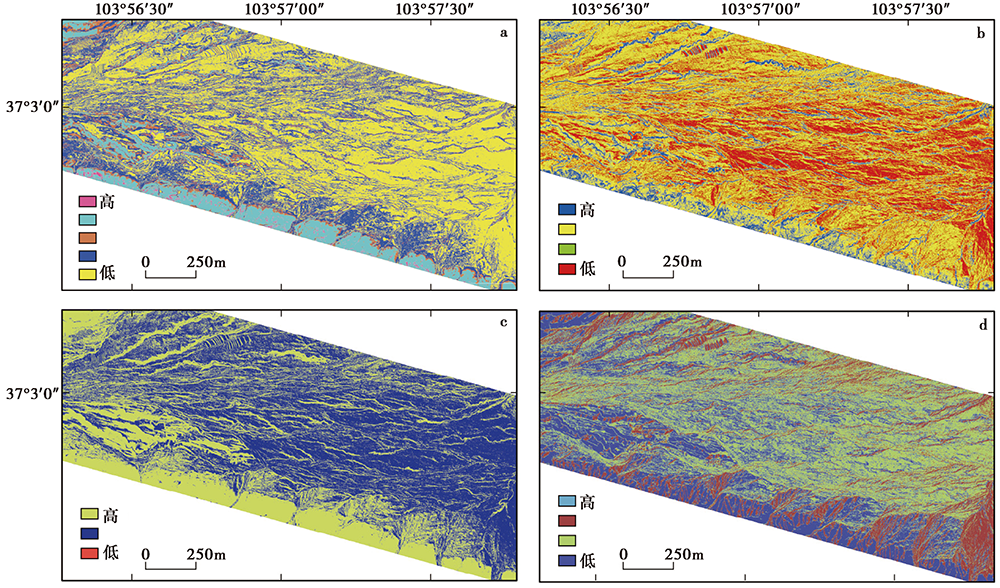 | 图 4 研究区8m× 8m滑动取样窗口下的起伏度(a)、 坡度标准差(b)、曲率标准差(c)和坡向标准差(d)重分类图Fig. 4 Reclassification map of relief(a), standard deviation of slope(b), standard deviation of curvature(c), and standard deviation of aspect(d)in the research area with an 8m× 8m moving window. |
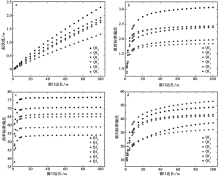
本研究提取了研究区6期冲洪积扇单元在2~100m取样窗口之间的起伏度和各粗糙度数据(图5)。随着取样窗口的增大, 起伏度表现出持续增大的特点, 而坡度、 曲率与坡向等3个参数的标准差却在窗口较小时迅速增大, 而当窗口增大到一定程度时其增长趋势变缓并趋于稳定。起伏度反映了提取窗口范围内的最大地形落差, 由于研究区冲洪积扇高程向盆地内逐渐降低, 故随着提取窗口增大地形落差持续增大(涂汉明等, 1991)。坡度和坡向的标准差随取样窗口增大而增大的特点反映了研究区地形波长的范围, 即粗糙度由迅速增大过渡为缓慢增大的窗口范围介于6~15m(涂汉明等, 1990), 而曲率的标准差过渡到稳定状态的提取窗口最小(图5)。以上3个粗糙度指标之所以随提取窗口尺寸的变化而变化, 是由于这3个指标在较小提取窗口下反映了微观地貌特征, 而随着提取窗口的增大则逐渐倾向于反映宏观地貌的特点(图6)。
 | 图 5 研究区各冲洪积扇单元在2~100m取样窗口下的起伏度(a)、坡度标准差(b)、 曲率标准差(c)和坡向标准差(d)分布Fig. 5 Relief(a), standard deviation of slope(b), standard deviation of curvature(c), and standard deviation of aspect(d)of each alluvial fan unit versus window size of 2m to 100m in the research area. |
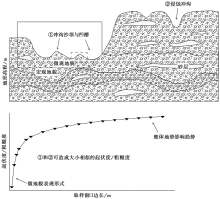
 | 图 6 活动冲沟沙坝与凹槽和侵蚀冲沟及其造成的起伏度/粗糙度示意图Fig. 6 Schematic diagrams showing bar-and-swale of active channel and headward incision channel and relief/roughness changing with increased window size. |
在6期冲洪积扇标准差的数值中, Qf6的数值增大到一定程度后开始明显超过其余扇体(图5b), 这种差异反映了最年轻的冲洪积扇未受侵蚀风化的初始地形, 即为高低不平的洪积扇。坡度标准差散点图也反映了6期冲洪积扇冲沟的发育特征以及地表的风化剥蚀作用(去高填低), 如当散点图趋于平缓后, Qf1的值小于Qf6、 Qf5和Qf2的数值, 但大于Qf3和Qf4的数值, 前者反映了Qf1地貌面受风化剥蚀作用影响最大, 扇表面与Qf6、 Qf5和Qf2单元相比更为平滑; 而后者反映了Qf1冲沟发育较Qf3和Qf4单元成熟, 冲沟影响了坡度使得粗糙度较大。以上特征均与野外观测结果相符。
此外, 2种不同的冲洪积扇单元可具有相近的起伏度或粗糙度数值(图5), 但其所反映的却是不同的地貌特点。例如, 年轻的冲洪积扇以沙坝和凹槽为主要特征, 而较老的扇体以广泛发育侵蚀冲沟为主要特征, 但是二者可以体现出相似的起伏度或粗糙度结果, 如图6所示。
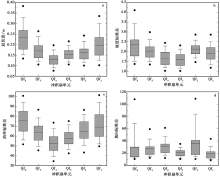
为了能同时体现地貌面的微观和宏观特征, 选取粗糙度曲线变化拐点附近的窗口尺寸作为最佳取样窗口。根据上述原则, 尺寸为8m× 8m的取样窗口基本可以作为研究区整体上各地貌参数的最佳取样窗口, 即地形波长。我们基于8m× 8m的窗口提取了研究区起伏度与各粗糙度指标, 并绘制相应的箱型图(图7)。具体步骤如下: 首先通过栅格重分类将起伏度与粗糙度从最小值至最大值等分为100段, 然后分别统计每一段所占的比例, 再将各段数值与所占比例的乘积依次累加起来进行归一化处理, 最后统计累加至各比例所对应的起伏度与粗糙度的数值。结果显示, 起伏度、 坡度标准差和曲率标准差会先随冲洪积扇的年龄增大而逐渐减小, 当减小到一定数值后, 反而越来越大; 坡向标准差的数据则不具有明显的规律性。上述特征反映了冲洪积扇受到的风化剥蚀作用以及侵蚀冲沟发育过程对地貌面的影响, 即在冲洪积扇发育前期, 风化剥蚀作用可以削平填低, 且冲沟尚未大规模发育, 此时地貌面逐渐趋于平滑; 在冲洪积扇发育后期, 冲沟已经发育到一定规模, 开始对地貌面产生破坏, 导致扇面支离破碎、 凹凸不平。
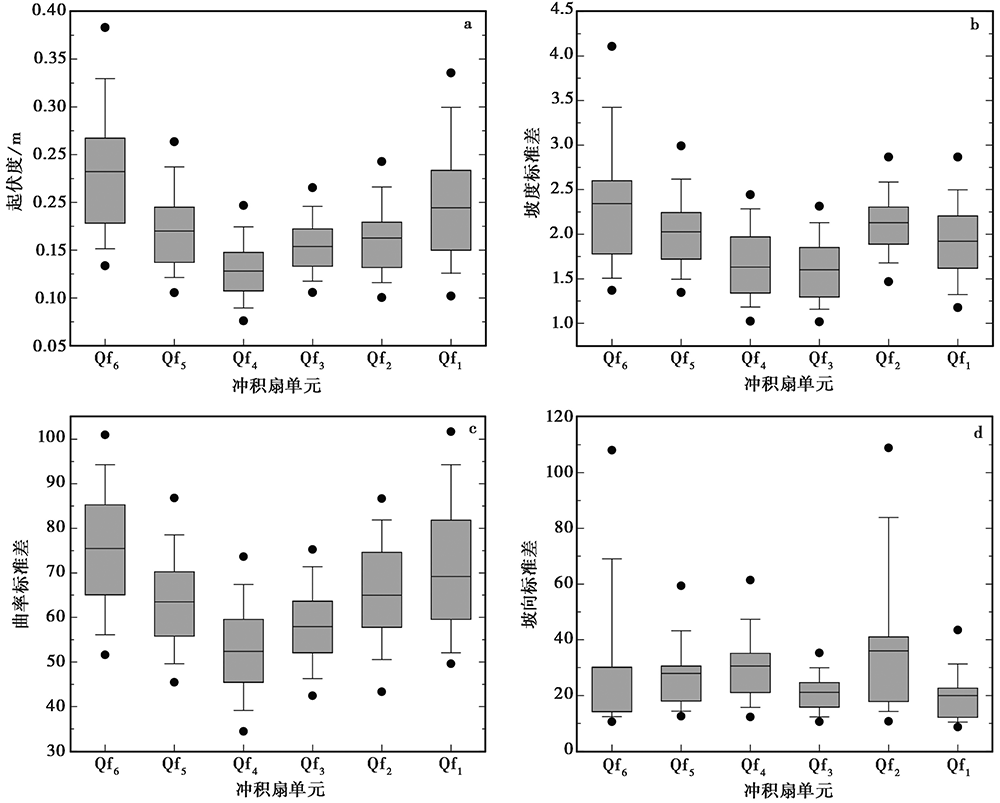 | 图 7 研究区各冲洪积扇单元在8m× 8m 取样窗口下的起伏度(a)、坡度标准差(b)、 曲率标准差(c)和坡向标准差(d)分布箱型图灰色框中的长横线表示起伏度/粗糙度的平均值, 两端黑色实心圆分别对应累加至5%与95%的起伏度/粗糙度数值, 两端的短横线分别对应累加至10%与90%的起伏度/粗糙度数值, 灰色框两端分别对应累积至25%与75%的起伏度/粗糙度数值Fig. 7 Box and whisker plots of relief(a), standard deviation of slope(b), standard deviation of curvature(c) and standard deviation of aspect(d)averaged over 8m× 8m for each alluvial fan unit in the study area. |
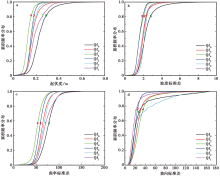
图8为各冲洪积扇单元在8m× 8m取样窗口下起伏度与各粗糙度数据的累积频率分布图, 表示将起伏度/粗糙度数据归一化后从最小值累加至最大值过程中累积频率的分布形式。从起伏度、 坡度标准差和坡向标准差的累积频率分布图中可知, Qf6与Qf1是累加速度最快的地貌单元, 而Qf4与Qf3则是累加速度最慢的地貌单元。前者体现了地貌单元较大的地形与地势差异, 与堆积沙坝和侵蚀冲沟有关; 后者体现了沙坝在一定程度上受到削弱, 且侵蚀冲沟发育程度还不太高, 处于地貌演化的过渡期, 地貌特征在整体上比较平缓。
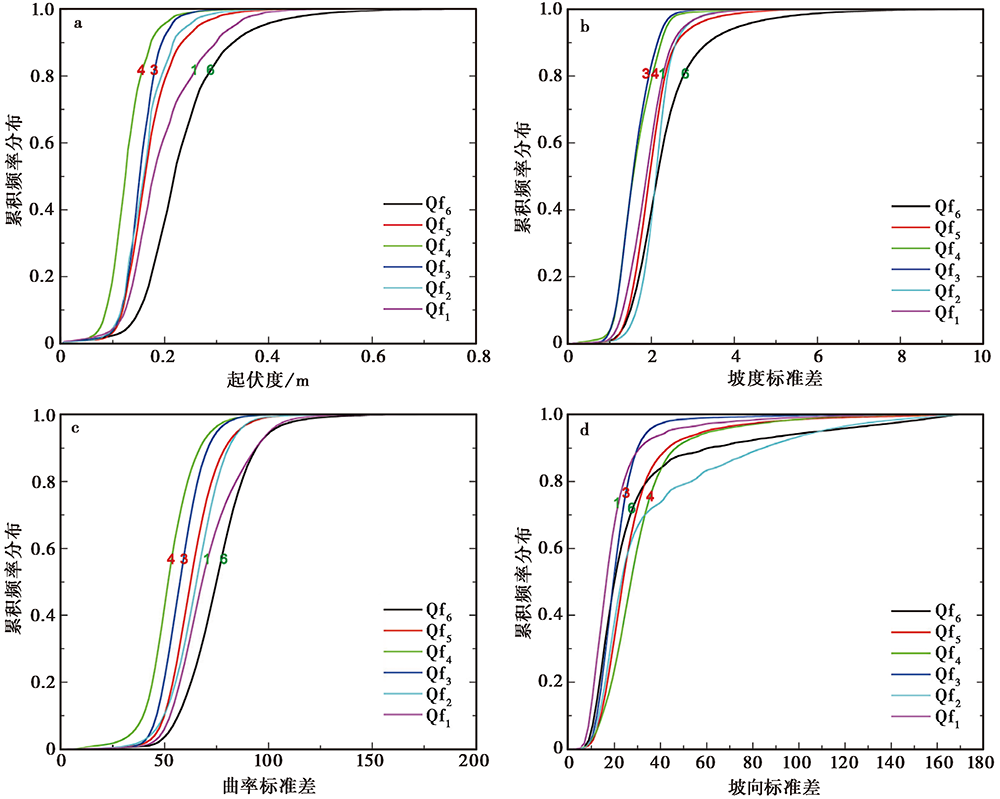 | 图 8 研究区各冲洪积扇单元8m× 8m 取样窗口下的起伏度(a)、 坡度标准差(b)、曲率标准差(c)和坡向标准差(d)的累积频率分布图Fig. 8 Cumulative frequency distributions of relief(a), standard deviation of slope(b), standard deviation of curvature (c)and standard deviation of aspect(d)based on window size of 8m× 8m for each alluvial fan unit in the study area. |
根据上述冲洪积扇的发育特征及起伏度、 粗糙度参数的特点, 可大致将研究区冲洪积扇的地貌演化过程分为4个阶段(图9): 在冲洪积扇形成的初始阶段(图9a), 扇体表面砾石分选差, 冲沟沙坝发育广泛, 造成微观尺度地势起伏不平, 但宏观尺度较为平坦; 随着时间的流逝, 高漫滩开始广泛发育, 且地表冲沟逐渐废弃或变小, 同时沙坝停止发育, 并逐渐被剥蚀削平(图9b); 随后, 冲洪积扇表面逐渐趋于平滑且错综复杂的分支沟逐渐减少, 冲沟逐渐开始下切(图9c); 最后, 冲沟下切程度加深, 形成更高的地形落差, 溯源侵蚀破坏了原来平坦宽广的地貌面(图9d)。沙坝的削平、 地表砾石粒径变化以及冲沟的溯源侵蚀和侧向侵蚀(冲沟规模)是冲洪积扇演化过程中最典型的动态过程, 这也是年轻冲洪积扇随着年龄的增加起伏度与粗糙度逐渐减小, 而较老冲洪积扇随着年龄的增加起伏度与粗糙度逐渐增大的原因。
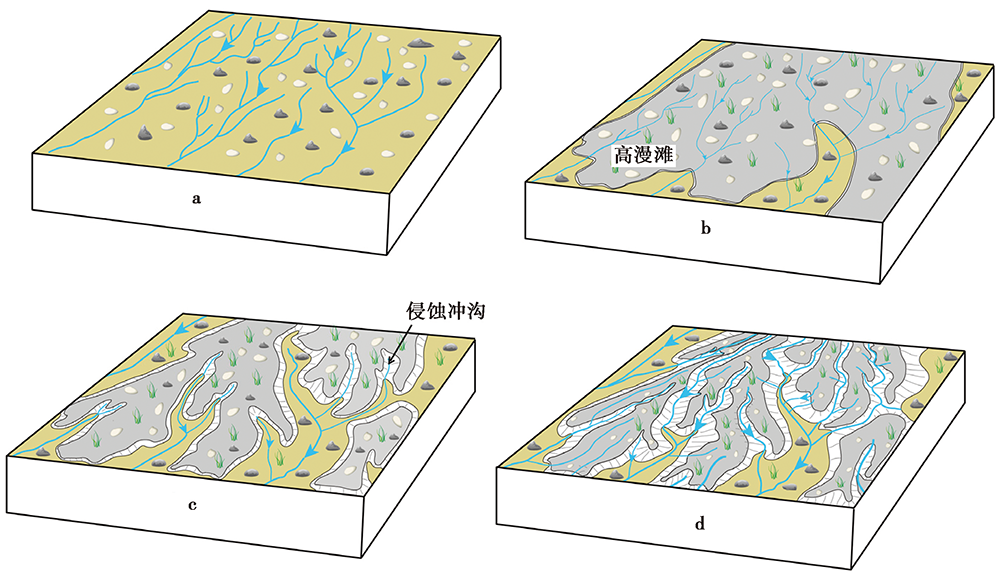 | 图 9 研究区第四纪冲洪积扇地貌演化模式图图中灰色区域表示洪积扇扇面, 蓝色线条及箭头表示水流及方向Fig. 9 Schematic diagram showing the inferred landform evolution of alluvial fans in the study area. |
基于高分辨率数字高程模型的起伏度和各粗糙度指标能够反映不同期次的冲洪积扇单元的地貌发育特征。各冲洪积扇单元不同地貌指标的最佳取样窗口并不固定, 而是介于6~15m之间, 与地形波长相匹配。随着滑动取样窗口的增大, 起伏度会持续增大; 而各粗糙度指标则体现了不同程度的趋于平缓的特征。在尺寸为8m× 8m的滑动取样窗口下, 随着冲洪积扇单元年龄的增加, 起伏度与粗糙度最初呈现减小的趋势, 而当年龄达到一定程度后, 起伏度与粗糙度的变化情况出现了反转。各指标数值最初的减小与冲洪积扇不断受到剥蚀风化而变得逐渐平缓有关, 而后来的反转则是冲沟溯源侵蚀和侧向侵蚀程度加深的结果。本研究的结果表明, 利用高分辨率数字高程模型提取的冲洪积扇相关地貌参数可以在一定程度上反映地貌发育特征, 为地貌单元划分提供定量化的数据约束。
The authors have declared that no competing interests exist.
| 1 |
|
| 2 |
|
| 3 |
|
| 4 |
|
| 5 |
|
| 6 |
|
| 7 |
|
| 8 |
|
| 9 |
|
| 10 |
|
| 11 |
|
| 12 |
|
| 13 |
|
| 14 |
|
| 15 |
|
| 16 |
|
| 17 |
|
| 18 |
|
| 19 |
|
| 20 |
|
| 21 |
|
| 22 |
|
| 23 |
|
| 24 |
|
| 25 |
|
| 26 |
|
| 27 |
|
| 28 |
|
| 29 |
|
| 30 |
|
| 31 |
|
| 32 |
|
| 33 |
|
| 34 |
|
| 35 |
|
| 36 |
|
| 37 |
|
| 38 |
|
| 39 |
|
| 40 |
|
| 41 |
|
| 42 |
|
| 43 |
|
| 44 |
|
| 45 |
|
| 46 |
|
| 47 |
|
| 48 |
|
| 49 |
|
| 50 |
|
| 51 |
|