


利用R语言半自动化提取河流阶地——以米家山黄河阶地为例
[姚文倩1  , 刘静
, 刘静1 , MichaelOskin2 , 韩龙飞1 , 李雪3 , 王恒1 , 徐心悦1 , 李占飞1 , 张金玉1 ]
, 刘静|
|


〔作者简介〕 姚文倩, 女, 1985年生, 2012年于中国石油大学(北京)地球科学学院获理学硕士学位, 现为中国地震局地质研究所构造地质学专业在读博士研究生, 主要从事活动构造和构造地貌方面的研究, 电话: 15001228611, E-mail: wenqian_08@163.com。
构造活跃地区阶地的发育对于分析不同时间域下的构造变形或气候作用具有重要意义。因此, 如何利用有效的定量方法提取和精细刻画这类地貌特征显得极为重要。R语言是一种集统计分析和图形显示于一体的优秀编程语言, 目前已被广泛应用于医学、 生物学等领域, 但尚未应用于地质与地貌学领域。文中以海原断裂带景泰—哈思山段的米家山东侧保存较好的多级黄河河流阶地为研究目标, 初步尝试基于R语言对SfM技术获取的高精度地形数据进行分析和可视化, 完成了对米家山黄河阶地的半自动提取, 共划分出20级河流阶地, 同时揭示出较年轻的阶地具有较好的连续性和延伸性, 而较老阶地的连续性和延伸性则相对较差, 且老阶地变形逐渐趋于明显, 阶地年龄越老, 其似半抛物线形态的翘曲越明显, 反映了米家山东侧多级阶地形成后的不同演化历史。此次试验结果表明R语言有望成为高精度地形数据分析和可视化的有效工具。
, LIU-ZENG JingThe generation, abandonment and preservation of terraces formed in active tectonic areas are important to the analysis of the role of the tectonics and climate along the temporal variations, so it appears significant as how to use the effective quantitative methods to extract and accurately depict these terraces. The increasingly convenient acquisition of high-precision topographic data has greatly promoted the advancement of quantitative research in geoscience, making it possible to analyze mid-micro-geomorphic features on a large scale, especially by studying the temporal and spatial evolution of tectonic deformation through accurate capture of micro-geomorphic features. Over the past decade, the rapid development of LiDAR(Light Detection and Ranging)technology has provided unprecedented opportunity to access high-precision topographic data(up to centimeter in vertical and horizontal directions). However, its relatively high cost and relatively complex data processing techniques limit its widespread application in the field of earth sciences. In recent years, with the continuous innovation and advancement of topographic measurement technology, the three-dimensional structure of motion reconstruction technology(Structure from Motion, SfM)has gradually been introduced into the field of digital topographic photogrammetry due to its rapid advantage in providing quick, convenient and cost-effective methods for obtaining high-density geospatial point data. This method thus shows great potential for providing high resolution topographic data with comparable resolution and precision. Therefore, with the acquisition of more and more high-resolution terrain data in recent years, it is an important development trend to explore automated or semi-automated quantitative geomorphological analysis methods. R language, as an excellent programming language, has not been used in the geology and geomorphology, although is widely applied in medicine and meteorology based on its powerful capability of statistician and graphic visualization. In this paper, we focus on the Yellow River multi-terraces formed to the east of the Mijia Shan, which belongs to the Jingtai-Hasi Shan segment of the Haiyuan Fault. With the analysis and visualization of the high-resolution topographic data collected from the SfM in the environment of the R language, we implement the semiautomatic classification and mapping of the Yellow River multi-terraces. The method identifies 20 terraces with different elevation. Our results also imply that the younger terraces have better continuity and elongation, and the older terraces have more deformation, which can be demonstrated from their gradually notable semi-parabolic shape. Besides this, it also suggests the diverse evolution stages of the Yellow River terraces. Our study indicates that R language is expected to become an efficient tool of statistics and visualization of the high-resolution topographic data.
构造活动活跃区域发育的河流阶地往往会受构造作用的影响或侵蚀作用的改造, 其作为气候变化或构造运动作用在地貌上的响应, 通常被地质学家广泛深入地研究, 以分析理解某地区的气候或构造的演化过程(Maddy et al., 2000, 2001; Pan et al., 2003, 2009; Bridgland et al., 2008)。通过综合分析阶地拔高并对其表面或上覆沉积物进行定年, 可揭示构造变形、 海平面、 古环境等的变化情况(Cabioch et al., 2001; 邢成起等, 2001; Corné e et al., 2006; Pan et al., 2009; Zecchin et al., 2009; Hu et al., 2011)。在很多河流阶地的研究中, 地质工作者们基于精细的地形信息分析了千年尺度范围内的地震复发周期(Armijo et al., 1996; Gesch et al., 2002; Athanassas et al., 2013); 更有研究者利用这类差异抬升阶地的阶梯式地貌信息, 识别出较长地质时间尺度下维持其地貌特征的不同地震构造区(Gesch et al., 2002; Chen et al., 2011)。
高精度地形数据获取的日益便捷化极大地推动了地球科学领域的定量化研究, 使得在大范围内分析中— 微地貌特征, 尤其是通过对微地貌信息的精确捕捉来研究构造变形的时空演化特征(Oskin et al., 2007, 2012; Klinger et al., 2011; Chen et al., 2018)成为可能。较为精确地获取各阶地面拔河高度可以估算阶地相对海平面或侵蚀基准的高程差, 或者自阶地形成以来的构造抬升情况。前人已经通过不同的方法对阶地面的高度进行了估算。例如, 人工确定提取地形剖面上坡度变化的点(阶地内缘, The terrace inner edge)(Regard et al., 2010; Roberts et al., 2013); 利用高精度数字地面模型数据(DTMs)综合分析坡度和粗糙度信息, 并半自动地划分出不同的阶地面(Palamara et al., 2007; Bowles et al., 2012)。尽管现今发现的较年轻的阶地尚未遭受到较为强烈的改造或破坏, 但是较老的阶地在形成后因年轻沉积物(包括风尘和边坡沉积)掩埋、 植被覆盖、 阶地边缘退化以及河流下切等原因而不易被识别(Anderson et al., 1999)。然而, 构造活动活跃地区的较老阶地对于分析长时间尺度下的构造变形或气候作用起着重要作用, 因此, 如何利用更为精细有效的方法提取和刻画这类地貌特征显得极为重要。
传统获取地形数据的方法包括利用全站仪、 激光测距仪以及差分GPS测量, 而基于这些方法想要获取较高精度的数据都比较费时费力, 且难以获得较大范围的高精度地形数据。在过去的十多年里, 激光雷达测距(LiDAR, Light Detection and Ranging)技术的迅速发展为快速获取高精度地形数据(垂向和水平方向上的精度达cm级)提供了空前便捷的途径。LiDAR技术的最大优势在于可以穿透植被进行大范围、 高密度的激光扫描, 从而获得高精度的点云数据, 并且可以对地表形态进行三维高精度可视化展示(Zielke et al., 2010; Klinger et al., 2011; Oskin et al., 2012; 刘静等, 2013; 陈涛等, 2014)。然而, 其相对高昂的成本以及较为复杂的数据处理技术限制了它在地球科学领域中的广泛应用。近年来, 随着地形测量技术的不断创新和进步, 三维结构的运动重建技术(Structure from Motion, SfM)因其更方便快捷、 成本更低的优势逐渐被引入数字地形摄影测量学领域, 帮助地质工作者们更便捷地获取到高精度地形数据。该技术将数码相机搭载于一些低成本空中平台(如热气球、 风筝、 小型无人飞行器等)上, 可获取不同尺度、 拍摄方位和焦距的高清图像, 利用多视角图像叠加的高效特征匹配算法提取出重叠区域的三维地形数据, 从而更加方便有效地以较低成本获取高精度地形数据并应用于构造地貌填图、 古地震等研究中(Arrowsmith et al., 2009; Bird et al., 2010; Oskin et al., 2012; Bemis et al., 2014; Johnson et al., 2014; Reitman et al., 2015)。其中, 低成本、 小体积的小型无人飞行器(small Unmanned Aerial Vehicle, sUAV), 即无人机(drones), 尤其是日益发展的自带GPS系统的新型sUAV越来越普遍地应用于野外填图、 地质灾害、 古地震、 滑坡体等地学研究领域(Lejot et al., 2007; Niethammer et al., 2012; Bemis et al., 2014; Jordan, 2015; Bi et al., 2017; 邵延秀等, 2017)。
随着近年来越来越多高精度、 高分辨率地形数据的获取, 探索自动化或半自动化的定量地貌分析方法成为当前重要的发展趋势。本文尝试应用新技术方法更便捷、 更精准地识别并划分多级河流阶地。在利用SfM方法获取的高精度地形数据的基础上引入了统计学分析技术— — R语言。该技术因其高效、 开源和具备可视化功能的优势已经被广泛应用于医学、 气象学等领域。本文将以海原断裂上米家山东侧多级河流阶地为例, 介绍高精度地形数据的获取及通过R语言半自动提取多级河流阶地技术的试验性应用。
海原断裂是青藏高原东北缘一条重要的走滑断裂, 其几何形态复杂, 沿线发育了一系列规模不等的盆地和隆起, 这些地貌体的发育与海原断裂的发育与演化有重要关系(Deng et al., 1984; Ding et al., 2004; Duvall et al., 2013)。
米家山位于广义海原断裂老虎山段与狭义海原断裂西段的交接位置、 1920年海原大地震的发震断层哈斯山南麓断层南侧, 其四周被不同性质的分支断裂以纺锤体状包围, 且断裂从哈思山扩展至米家山并穿其而过时, 走向和倾向均发生了变化(国家地震局地质研究所等, 1990)(图1)。这种复杂的断裂几何形态及其产状变化均揭示出米家山作为海原断裂上重要的构造结对海原断裂的活动性起着重要的控制作用。另一方面, 黄河是青藏高原东北缘惟一的外流河体系, 亦是中国北方最大的河流, 流经黄土高原、 华北平原, 最终向E流入渤海, 其形成与演化反映了东亚新生代以来构造隆升、 气候演变以及水系形态自身调整等重要信息, 因而受到了普遍关注与重视(李吉均等, 1996; 张珂, 2012; 王书兵等, 2013)。在青藏高原内, 黄河以SW-NE流向经陇西高地, 穿过红山峡、 黑山峡、 中卫-中宁盆地和牛首山西缘, 并在上游区段流经多个盆地时形成多级阶地, 如共和盆地、 贵德盆地、 兰州盆地(Li et al., 1997; Pan et al., 2009; Hu et al., 2011), 其中, 针对兰州盆地的研究最广为人知。而在自南向北穿过米家山— 哈思山隆起区的过程中, 其发生的约90km的左行拐弯被当作是海原断裂最大位移量的一个指标(Gaudemer et al., 1995)。同时, 在穿过海原断裂的部位、 介于哈思山— 米家山隆起区中部处形成了比较窄的深切河谷, 并在米家山基岩隆起区东侧形成了一系列分布于不同拔高的走向近SN且与哈斯山南麓断裂走向近垂直的多级基座阶地, 这些阶地详细记录了米家山隆起的抬升历史, 为定量研究分析其抬升历史提供了有利的素材。
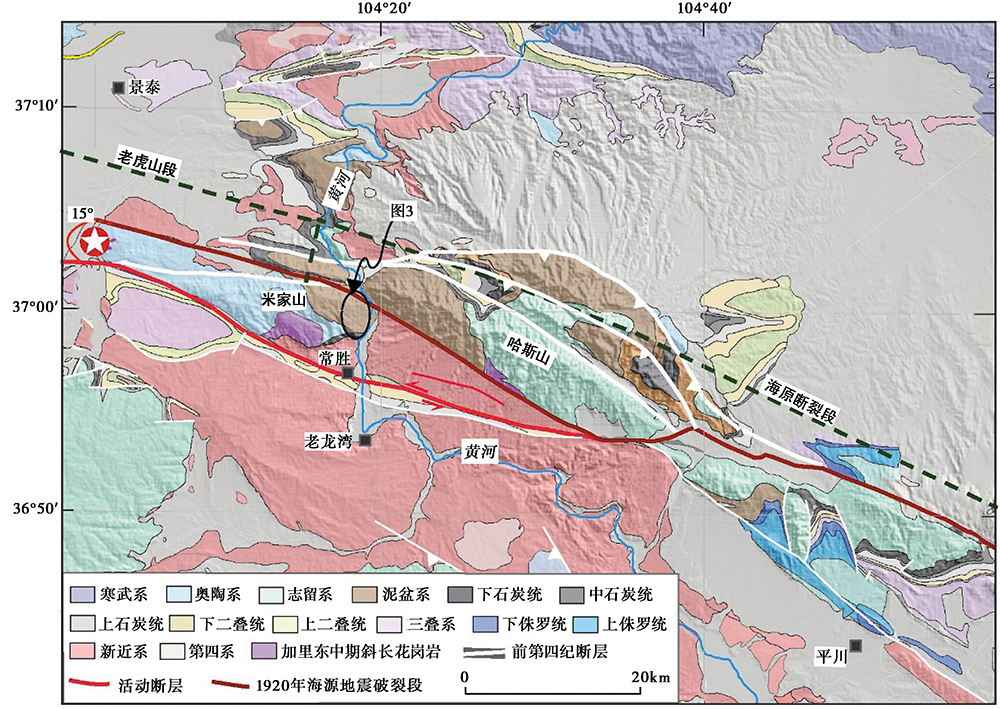 | 图 1 海原断裂米家山— 哈斯山段地质图黑色椭圆标注为米家山隆起区东侧的多级阶地Fig. 1 Geological map of the Mijia Shan-Hasi Shan section of the Haiyuan Fault. |
因此, 对米家山隆起区的多级河流阶地进行识别和划分, 对于揭示其演化历史、 变形模式以及该区域断层的活动性有着重要的指示作用。前人对米家山东侧的多级阶地进行阶地级数划分的结果差别较大, 分别为21级(邢成起等, 2001)和12级阶地(李占飞, 2016)。野外地质调查也表明这些阶地几乎均为基座阶地, 且随着拔高的增加, 较老阶地经历了较长时间的侵蚀或边坡冲积物覆盖等, 其识别度也逐渐降低, 仅能看到一些残余的侵蚀基座。
此次高精度地形数据获取的工作流程包括以下几个步骤:
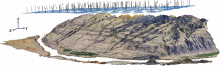
(1)采用DJI精灵4系列四旋翼飞行器作为相机搭载平台进行拍摄, 飞行总面积为7.72km2。在设计好飞行路线的基础上沿阶地走向进行2次匀速扫描拍摄, 相机设置成连续拍摄模式, 飞行高度设为恒定406m, 飞行过程中保证相机充分对焦, 照片重叠率在70%以上(图2)。
 | 图 2 Agisoft Photoscan处理生成的米家山高密度点云数据透视图Fig. 2 Perspective view of the high-density point cloud data of Mijia Shan processed with Agisoft Photoscan. |
(2)基于商业软件平台Agisoft Photoscan对照片进行后期处理。首先逐一检查所拍摄的正摄影像的质量, 剔除一些质量较差的图像, 如不清晰、 严重变形或颜色异常等, 然后将剩余照片统一导入至Photoscan软件中, 同步导入的数据还包括相机和所摄照片的基本信息, 如焦距、 光圈值、 ISO、 坐标和照片精度等。
(3)利用照片的匹配叠加算法进行三维地形数据再现(图2), 该步骤中可以生成高密度点云数据、 多边形Mesh网模型和纹理模型。
(4)生成具有地理坐标系的数字高程模型(DEM)和正摄影像数据, 其中DEM数据在之后的阶地半自动提取流程中将会被使用。
获取了高精度数字地形数据之后, 主要利用ArcGIS①(①https://www.esri.com。)和R语言②(②https://www.r-project.org/。)2类软件平台交互式地开展多级河流阶地的半自动提取工作。R语言是由新西兰奥克兰大学的Ross Ihaka和Robert Gentleman共同研发的一种自由有效的统计绘图语言和环境(Crawley, 2007)。一方面, 与传统的计算机语言(如C语言、 Java等)相比, R语言作为一种统计分析工具, 可在多种操作系统上(UNIX、 Windows、 MacOS)运行, 具有更强的数据分析、 统计建模以及数据可视化等功能, 可提供广泛的统计分析技术, 如建立线性和非线性模型, 进行经典的统计学测试, 时间序列分析、 聚类、 分类以及制图等。另一方面, R语言的开源性吸引了各行各业的用户在其环境下编写和分享函数包, 且这些函数包均可在CRAN(Comprehensive R Archive Network)镜像③(③https://cran.r-project.org/mirrors.html。)下载, 体现了其较强的扩展性。目前, R语言已被广泛应用于医学、 气象学研究中(汪洋等, 2013; 刘培宁等, 2014), 但在地质学以及地貌学中的应用尚未被开发。下文将介绍综合利用ArcGIS和R语言处理高精度数字地形数据及半自动提取多级阶地的具体步骤。
首先, 将生成的DEM数据导入到ArcGIS软件平台中进行预处理, 该过程综合使用了邻域分析工具集、 表面分析工具集和条件分析工具集等。操作流程主要包括: 1)对于原始的DEM数据进行平滑处理, 得到新的栅格文件; 2)对新的栅格文件进行坡度提取; 3)定义坡度< 15° 为阶地, 进而保留坡度为0° ~15° 的栅格文件(图3中绿色填充的部分); 4)进一步对坡度栅格文件进行平滑处理, 以期最大程度扣除深切冲沟较平坦沟底的干扰(图3中橙色填充的部分); 5)进行空函数处理并将保留的数据转换为shapefile文件; 6)利用转换工具将该shapefile文件转换为栅格数据; 7)对提取的新的阶地栅格数据与原始的DEM数据进行相除、 相乘以获得初始的具有高程信息的阶地分布图。在初次提取阶地面后, 考虑到本次获得高精度数字地形数据的过程中未加载地面控制点对数据进行校正, 且为了方便后续计算, 我们利用黄河面高程对米家山多级阶地的海拔高程进行了整体高程校正, 即在ArcGIS中逐一使用剪切、 转换和趋势面插值法获得了校正后的相对黄河面拔高的多级阶地面栅格数据。进一步对该栅格数据进行重采样和采样, 获得了具有阶地面点坐标、 相对黄河拔高的.txt文件(共1i387i387个数据点, 最大相对高程为408.5m)。
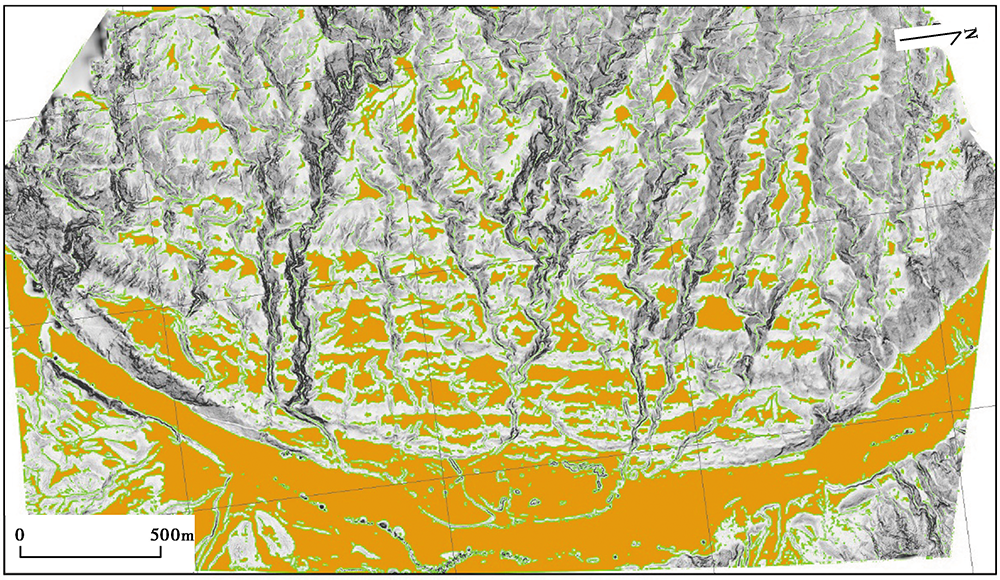 | 图 3 ArcGIS中2次坡度处理叠加图, 底图为山影图底部绿色填充为首次筛选坡度图, 上覆橙色填充为2次筛选坡度图, 最大限度排除深切冲沟底部平坦面对总体坡度数据的影响Fig. 3 Overlapped mapping of the slope processed in ArcGIS. |
在完成前期数据准备工作后, 将具有点坐标信息和相对高程信息的.txt文件导入到R语言环境中。
#读取数据
tp=read.csv(‘ C:/Users/LJ-Group/Desktop/Tspoints.txt’ )
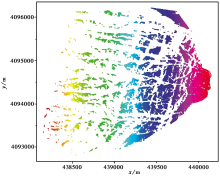
对原始数据体进行重新定义, 从而建立R语言环境下可识别的数据框架, 并生成初步的数据点平面分布图(图4)。
 | 图 4 阶地初始数据点平面分布图Fig. 4 The planar distribution map of the initial data of terraces. |
#建立新的数据框架, 其中x、 y、 z分别为R语言环境下的坐标及高程信息, X、 Y、 correctedTs_1是原始数据点坐标及相对高程信息
xyz=data.frame(x=tp$X, y=tp$Y, z=tp$correctedTs_1)
#创建阶地面数据点初始平面分布图
plot(xyz$x, xyz$y)
为了更直观地展示阶地面沿走向的发育情况以及相对黄河拔高的变化梯度, 同时保证提取的所有点都能被包络, 我们设定以原始平面直角坐标(4i092i500, 439i000)为参考坐标, 并以黄河流经米家山前的走向为参考旋转角度, 将以上数据整体顺时针旋转20° , 并引入了新的变量d(数据点相对黄河的拔高), 绘制成图(图5)。
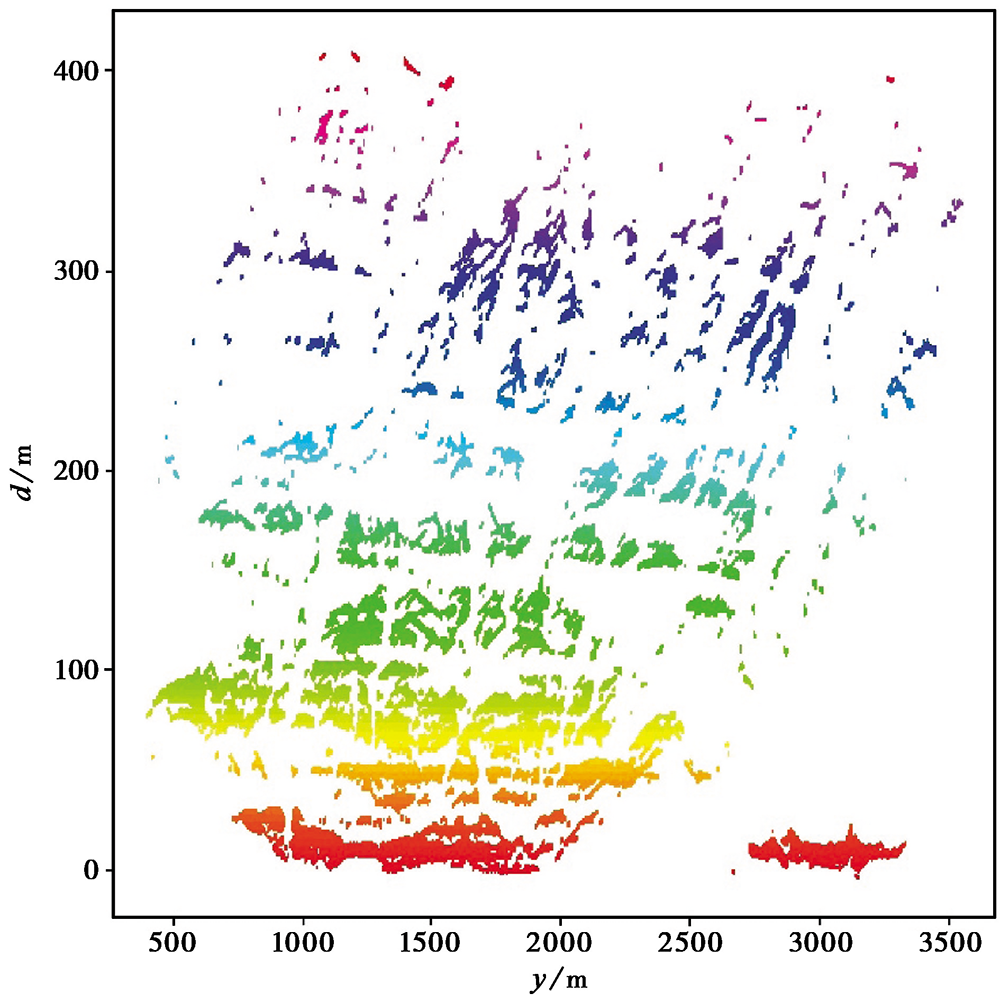 | 图 5 阶地面相对拔高沿阶地走向变化图横轴为阶地走向方向, 纵轴为阶地面相对黄河拔高Fig. 5 Graph showing the relative elevation change along the direction of terraces. |
#引入新变量d并对整体数据进行旋转成图
xyz$d=(xyz$y-4092500)× cos(20× pi/180)-(xyz$x-439000)× sin(20× pi/180)
单从野外观察和拍摄的阶地图像来看, 米家山隆起东侧的多级阶地表现为一系列延展性较好、 近直线展布的特征(图6), 阶地内部似乎没有受到构造变形的影响, 且除了一些相对年轻的阶地较易识别, 较老的阶地面基本无法识别, 初始推测该多级阶地的形成是因米家山整体抬升造成的。然而, 依据本次基于R语言环境生成的阶地分布情况来看, 相对拔高较低的阶地呈线状延伸, 且连续性较好, 但是随着相对拔高增大, 年代越老的阶地却呈现出明显的似半抛物线形态的不同程度的翘曲(图5)。为了将阶地相对拔高投影到三维地形上, 我们在R语言里依据阶地的半抛物线形态建立了包含变形量、 抬升量在内的数学公式, 从而构建了与三维地形相匹配的阶地分布图, 并将生成后的具有坐标信息以及校正拔高的数据体导入ArcGIS中叠加在山影图上, 从而完成了米家山隆起区多级阶地的半自动提取工作(图7)。
 | 图 6 米家山多级阶地野外实景Fig. 6 Field photograph showing multi-terraces of the Mijia Shan. |
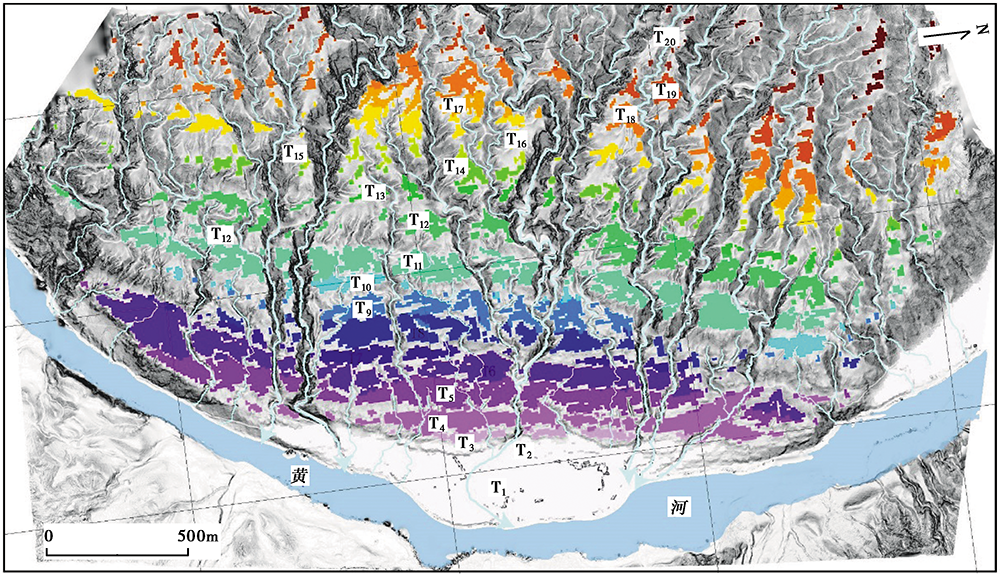 | 图 7 半自动提取的河流阶地分布图, 底图为山影图Fig. 7 Map showing semi-automated terrace classification, covering on the shaded relief. |
精细刻画地貌形态是构造地貌和活动构造研究的基础。因此, 构造地貌和活动构造研究对高空间分辨率数字地形数据的获取以及自动化定量分析有较高的需求。通过LiDAR 和SfM多视角移动摄影测量方法可快速构建较为真实的高分辨率三维地形, 获得的数据往往是dm级甚至cm级的极高空间分辨率和高密度的海量数字型数据, 这些数据不仅可服务于活动断层的精细解译, 还能用于刻画微地形地貌(Oskin et al., 2012; 刘静等, 2013; 魏占玉等, 2014)。自动化或半自动化的定量地貌分析方法可更加有效地利用高分辨率数据。一方面, 其不仅可使构造地貌填图工作从传统的纯手工方式过渡到基于算法和特征阈值的自动识别方式, 提高工作效率, 降低人为解译的不确定性; 另一方面, 这类基于计算的自动化-半自动化的方法使得地貌面填图具有室内可重复性, 增加了检验的客观性。目前, 已经有一些研究尝试开发自动-半自动提取方法以识别具有一定延续性的较平坦的地貌面, 如Palamara等(2007)基于坡度和高度参数对新西兰东南部Shag point较单一的海岸阶地边界进行了自动识别; Bowles等(2012)基于ArcGIS软件平台对加利福尼亚州Mendocino-Sonoma较平缓和低起伏度的海岸阶地的LiDAR数据进行坡度和粗糙度特征的综合计算分析, 并开发了半自动阶地面提取方法; Walker等(2016)在实现对安哥拉海岸阶地的自动提取工作中, 利用新算法对SRTMGL1数字高程模型的地形梯度进行了强化平滑处理, 从而避免了阶地面表面低起伏地形对自动识别的影响, 最大程度地保证和实现了自动提取阶地的连续性和完整性。值得注意的是, 这些提取方法主要是针对较为连续、 平缓的简单阶地, 且无法精细识别侵蚀严重和坡度较大的阶地。因此, 对于米家山东侧的具有级数较多、 部分因侵蚀严重而难以识别等特征的阶地, 这些方法并不适用。
本文基于SfM方法获取了米家山隆起区东侧河流阶地的高精度数字地形数据, 交互式综合利用ArcGIS软件和R语言环境实现了河流阶地的半自动提取工作。首先, 虽然前人也对米家山多级阶地进行过划分, 但是受限于当时的研究方法— — 仅靠野外肉眼划分, 尚未能准确地进行填图(邢成起等, 2001)。本文引入半自动提取技术初步完成了该地区的精确填图, 不仅对延伸性较好的年轻阶地进行了细致的划分, 对于较老的遭受严重侵蚀的阶地也进行了提取, 最终成功识别出了多达20级的河流阶地, 最高级阶地平均相对黄河拔高450m(图7); 其次, 从提取的初始相对拔高变化图(图5)中可清晰地发现, 随着阶地面变老, 其阶地变形程度也逐渐增大, 呈现出不同曲率的似半抛物线形态, 且阶地面的延伸性和连续性逐渐变差, 这与野外实际观测到的现象一致(图6); 最后, 本文主要尝试了R语言在实现阶地的半自动提取过程中的简单和初步应用, 虽然涉及到一些形象化的数学模型, 但是代码相对简单。因此, 基于R语言优异的数据挖掘和处理能力以及图像显示功能, 下一步将尝试将该方法推广和应用到更多的地形地貌学高精度数字地形数据的分析工作中。
The authors have declared that no competing interests exist.
| 1 |
|
| 2 |
|
| 3 |
|
| 4 |
|
| 5 |
|
| 6 |
|
| 7 |
|
| 8 |
|
| 9 |
|
| 10 |
|
| 11 |
|
| 12 |
|
| 13 |
|
| 14 |
|
| 15 |
|
| 16 |
|
| 17 |
|
| 18 |
|
| 19 |
|
| 20 |
|
| 21 |
|
| 22 |
|
| 23 |
|
| 24 |
|
| 25 |
|
| 26 |
|
| 27 |
|
| 28 |
|
| 29 |
|
| 30 |
|
| 31 |
|
| 32 |
|
| 33 |
|
| 34 |
|
| 35 |
|
| 36 |
|
| 37 |
|
| 38 |
|
| 39 |
|
| 40 |
|
| 41 |
|
| 42 |
|
| 43 |
|
| 44 |
|
| 45 |
|
| 46 |
|
| 47 |
|
| 48 |
|
| 49 |
|
| 50 |
|
| 51 |
|
| 52 |
|
| 53 |
|
| 54 |
|
| 55 |
|
| 56 |
|
| 57 |
|
| 58 |
|
| 59 |
|
| 60 |
|
| 61 |
|
| 62 |
|
| 63 |
|