


四川宜宾地区地震定位及速度结构
[张致伟1)  , 龙锋
, 龙锋1) , 王世元1) , 宫悦1) , 吴朋1) , 王辉2) , 江国茂2) ]
, 龙锋|
|


〔作者简介〕 张致伟, 男, 1983年生, 2009年于中国地震局兰州地震研究所获固体地球物理专业硕士学位, 高级工程师, 主要从事地震活动性及数字地震学研究, 电话: 028-85440713, E-mail: zzw1983107@163.com。
文中基于2008年1月—2015年5月四川、 云南区域台网及宜宾地方台网记录的地震观测资料, 对四川宜宾的地震密集区开展了地震定位和速度结构反演工作, 研究该区域地震活动的三维空间分布和不同深度的速度结构特征。 重新定位结果显示, 宜宾地区的地震活动具有明显的空间丛集性, 主要集中分布在长宁—珙县和珙县—筠连, 2个地震密集区均呈现不对称的共轭分布, 地震活动在密集区最东段出现相向扩展的现象。 长宁—珙县的地震活动区位于长宁背斜核部, 在珙县附近存在稀疏段, 其东南侧的地震活动频次和强度明显高于西北侧, 且震级较大的地震震源深度相对较深, 远离珙县的地震震源深度逐渐变浅。 P波速度结果显示, 地震密集区在10km的优势深度范围内均表现出相对较高的P波速度, 尤其在珙县北西侧和筠连以东地区, 珙县东南侧的P波速度呈现随深度增大逐渐增加的特征, 特别是在深6km处呈现相对较高的波速。 这些高速区一般与地下较脆、 较强的岩体有关, 往往是应力最为集中的区域。 地震活动主要发生在高、 低速过渡的区域, 速度结构的不均匀性可能是控制该区地震分布的因素之一。
Small earthquakes have been recorded in Yibin area, Sichuan Province since 1970, the frequency and intensity of seismicity have shown an increasing trend in recent ten years, and the earthquakes are distributed mainly in Changning, Gongxian and Junlian areas. Based on the seismic data from January 2008 to May 2015 recorded by Sichuan and Yunnan regional networks and Yibin local network, seismicity analysis, precise location and velocity structure inversion for earthquakes in Yibin area are carried out, the three-dimensional spatial distribution of seismic activity and the velocity structure at different depths in this region are investigated, trying to analyze the seismic activity law and seismogenic mechanism in Yibin area.
The earthquake relocation result shows that the spatial cluster distribution of earthquakes is more obvious in Yinbin area, the earthquakes are concentrated in Changning-Gongxian and Gongxian-Junlian regions. The seismic activity presents two dominant directions of NW and NE in Changning-Gongxian region, and shows asymmetric conjugate distribution, the long axes of NW-trending and NE-trending seismic concentration area are about 30km and 12km respectively, and the short axes are about 5km. There is a seismic sparse segment near Gongxian, the frequency and intensity of seismicity in the southeast side are obviously higher than that in the northwest side, and the earthquakes with larger magnitude are relatively deep, the focal depth is gradually shallower with the distance away from Gongxian. Seismic activity is sparse in the west and dense in the east in Gongxian-Junlian region, the predominant direction of earthquakes in the seismic dense area of the eastern segment is NE. Seismic activity extends in opposite direction in the easternmost part of the two earthquake concentrated area.
The P-wave velocity structure at different depths in the study area is obtained using joint inversion method of source and velocity structure. In view of the predominant focal depth in this region, this paper mainly analyzes the velocity structure of the upper crust within 10km. Within this study area, the P-wave velocity of earthquake concentration areas is relatively high within 10km of the predominant focal depth, especially in the northwest of Gongxian and eastern Junlian area, the P-wave velocity on the southeast of Gongxian increases gradually with depth, especially at 6km depth. These high-velocity zones are generally related to brittle and hard rocks, where the stress is often concentrated.
Comparing earthquake distribution and velocity structure, seismic activity in this area mainly occurs in high-low velocity transition areas, the inhomogeneity of velocity structure may be one of the factors controlling earthquake distribution. The transition zone of high and low velocity anomalies is not only the place where stress concentrates, but also the place where the medium is relatively fragile, such environment has the medium condition of accumulating a large amount of strain energy and is prone to fracture and release stress.
四川的地震活动具有西强东弱的显著特征, 6级以上的强烈地震几乎全部发生在四川西部高原和山区的活动断裂上, 东部盆地属于历史中等地震活动区(钱洪等, 1992)。 自1970年有地震台网观测记录以来, 四川盆地的地震活动始终呈现较弱的状态, 但近十多年来该区的地震活动频次和强度呈上升趋势, 且具有明显的空间丛集性, 集中分布在四川长宁— 珙县— 筠连、 威远— 资中— 荣县及重庆荣昌等区域。
1970年以来四川宜宾地区就有小震活动记录, 主要分布在长宁、 珙县及筠连一带。 随着地震台网监测能力的提高, 自2000年起更多的小震活动被观测到。 2006年以来长宁— 珙县地区的地震活动频次和强度明显增强, 并于2013年4月25日发生了长宁ML5.2地震。 众多科研人员针对该区域的地震活动、 震源机制及孕震机理等方面开展了相关研究。 阮祥等(2008)研究认为长宁盐矿长时间的注水可能渗入先存的长宁背斜微裂隙, 加速了附近区域微构造地层的破裂, 引发了小震群活动; 朱航等(2014)认为长宁地区3级以上地震的震源机制在注水采盐期间相对散乱, 区域应力强度无明显增加, 且对破裂方向也无明显的约束作用; 吴朋等(2017)分析了宜宾地区的S波分裂特征, 结果显示局部区域的快波偏振方向存在差异, 慢波延迟时间在中等地震前有明显上升的趋势; Sun等(2017)分析了长宁地区地震的孔隙压扩散特征, 认为注水过程中流体主要沿地表裂隙和垂直于注水点以下的裂隙扩散。
鉴于四川宜宾地区还未开展地震定位及速度结构的相关研究, 本文以宜宾地震密集区(27.8° ~28.6° N, 104.2° ~105.3° E)为研究区域, 基于2008年1月— 2015年5月四川、 云南区域地震台网及宜宾地方台网记录的地震观测报告, 开展了地震精定位和速度结构反演工作, 并分析地震活动的三维空间分布和不同深度的速度结构特征, 尝试为研究宜宾地区的地震活动规律和发震机理提供科学依据。
伴随着印-亚板块的持续碰撞, 高原物质不断隆升并向SE方向逃逸, 在四川盆地的西缘受到扬子地台刚性基底的阻挡, 形成龙门山隆升带。 四川盆地的构造变形样式则受到构造运动的叠加影响, 形成盆地内断褶构造的格局。 其地表构造则呈一系列平缓、 低陡的背斜与向斜相间排列的样式, 地表断裂较少, 常与背斜构造相伴生, 为断裂弯曲背斜或断层扩展背斜构造成因, 地下盖层中常存在地腹构造(李勇等, 1994; 钱洪, 1995)。
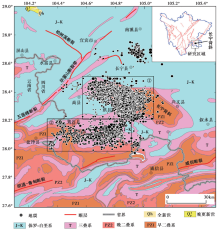
长宁背斜为研究区域的主要地质构造(图1)。 该背斜核部岩性主要为古生界的灰岩、 砂岩和页岩, 两翼地层主要为新生界的砂岩和泥岩。 长宁背斜东起叙永县以西, 主要分布于兴文县和长宁县, 西至高县一带, EW长约100km, SN宽约20km, 为不对称的复式背斜。 主轴走向总体呈NW-SE向, 北西翼陡, 倾角约40° ~60° , 南东翼缓, 倾角约17° ~32° 。 背斜轴宽阔平缓, 地表出露于上西乡— 双河镇一带。 长宁背斜属于多断裂构造的背斜, 断裂多发育在由古生界地层组成的背斜核部或两翼, 以小断裂为主, 呈高角度压性逆冲断层, 断层与褶皱紧密相伴, 延伸方向与褶皱线行迹一致。
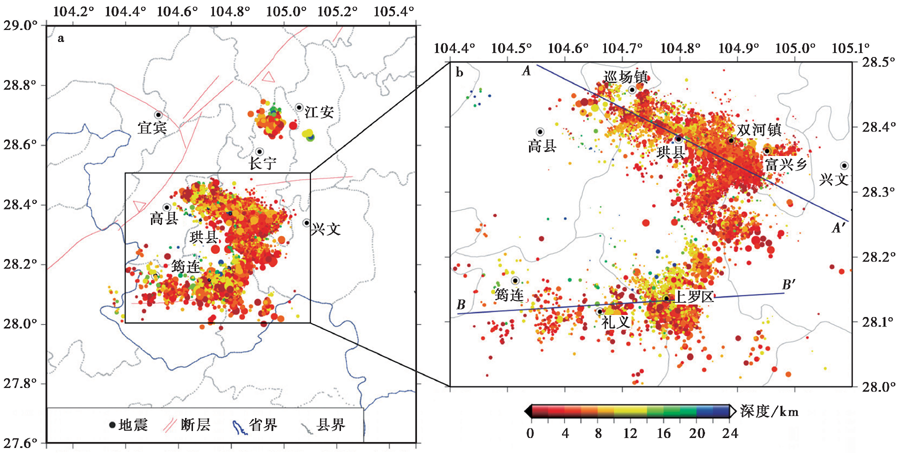
 | 图 1 研究区域地质构造及地震分布Fig. 1 The geologic structure and earthquake distribution in the study area. |
据四川地震台网测定, 自2000年以来四川宜宾地区地震活跃, 震中主要集中分布在长宁— 珙县(区域①)和珙县— 筠连(区域②)2个区域(图1)。 其中长宁— 珙县地震活动密集区位于长宁背斜西段, 长轴走向与长宁背斜的主轴走向一致; 珙县— 筠连地震活动密集区的走向近EW。 截至2015年5月, 地震密集区共发生0级以上地震12i125次, 其中0.0~1.9级10i609次, 2.0~2.9级1i318次, 3.0~3.9级175次, 4.0~4.9级22次, 5.0~5.9级1次, 震级最大的为2013年4月25日长宁县ML5.2地震。 该区域主要以小震活动为主, 2.0级以下地震占地震总数的87%。
图 2给出了上述2个区域的地震活动随时间变化的情况。 长宁— 珙县区域的地震M-T图、 N-T图显示, 2000年1月— 2006年3月该区地震活动的频次和强度相对较弱, 仅发生过1次4.0级以上地震, 即2001年9月28日珙县ML4.3地震; 2006年4月— 2010年12月小震活动增强, 发生了7次4.0级以上地震, 震级最大的为2008年2月1日长宁县ML4.8地震; 2011年以来该区小震活动频次再次出现显著增强, 截至2015年5月31日, 共发生12次4.0级以上地震, 其中1次5级以上地震, 即2013年4月25日长宁县ML5.2地震(图2a)。 珙县— 筠连区域的地震M-T图、 N-T图显示, 2000年1月— 2014年11月, 该区的地震活动频次和强度均相对较弱, 活动水平为2~3级; 自2014年12月以来地震活动显著增强, 发生了2015年4月24日珙县ML4.2地震(图2b)。
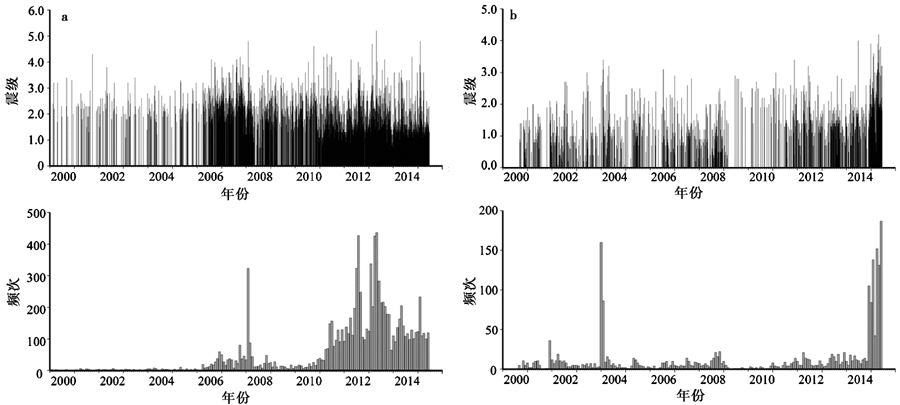 | 图 2 自2000年以来研究区0级以上地震的M-T、 N-T图 a 区域①; b 区域②Fig. 2 M-T and N-T maps of earthquakes with ML≥ 0.0 since 2000 in the study area. |
地震定位是地震学中最经典、 最基本的问题之一。 震源位置的精度主要受地震台网的布局、 可用于定位的震相、 地震波到时读数的精度以及选取的地壳速度结构模型等因素的影响(Pavlis, 1986; Gomberg et al., 1990)。 为了获得地震的精确位置, 减小定位误差, 在提高地震台网布局密度的同时, 地震科研人员一直致力于发展和改进地震定位方法。 Long等(2015)将现有的绝对和相对定位方法相结合, 通过修正数据和速度模型以及不同阶段的反复迭代, 可有效减小定位误差并获得较为理想的定位结果。
该定位方法分为4个阶段, 由HYPOINVERSE2000、 “ 最小一维模型” 以及双差定位3种方法组合而成。 具体步骤为:
(1)以宜宾所在区域已有的一维速度模型作为初始值, 首先采用HYPOINVERSE2000(Klein, 1989)对研究区内的地震进行初始定位, 获得震源位置和台站方位角等信息。
(2)挑选其中被6个以上台站所记录且方位角间隙< 150° 的地震事件震相资料, 采用基于“ 最小一维模型” 的VELEST方法(Kissling, 1988; Kissling et al., 1994, 1995)反演研究区域新的速度模型和台站校正值。
(3)利用新的速度模型和台站校正值, 再次利用HYPOINVERSE2000进行定位, 并检测定位精度是否得到改善。
(4)最终再通过HypoDD方法(Waldhauser et al., 2000)对精度改善后的地震进行相对定位, 获得地震之间高精度的相对位置。
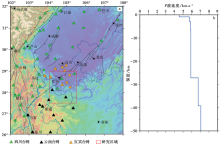
本文使用了四川、 云南区域台网及宜宾地方台网(图3a)的地震观测资料, 其中宜宾数字测震台网(黄色三角)由10个子台组成, 台站均匀分布于地震活动密集区, 在地震定位和速度结构反演中发挥了重要作用。 鉴于宜宾地方台网于2008年开始正式运行, 我们整理了2008年1月— 2015年5月研究区域内所发生地震的震相记录。 以赵珠等(1987)给出的四川东部盆地地壳上地幔平均速度为初始模型(图3b)。
 | 图 3 研究区域及邻区台站分布(a)和初始速度模型(b)Fig. 3 Station distribution(a)and initial velocity model(b)in the study area and adjacent area. |
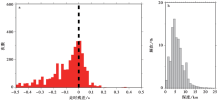
为了检验定位精度是否得到改善, 将步骤(2)中获得的新速度模型、 台站延迟以及定位结果再次代入HYPOINVERSE2000程序中, 并将同一地震的定位结果与步骤(1)的结果做比较, 绝大部分地震定位结果的走时残差表现为负值(图4a), 说明地震定位精度有了明显改善。 震源深度统计结果显示该研究区域地震震源深度相对较浅, 90%的地震集中分布在深度10km以内(图4b)。
 | 图 4 定位走时误差改正情况(a)及深度统计直方图(b)Fig. 4 Travel time error correction in location(a)and depth statistical histogram(b). |
地震定位结果能够精细地刻画地震空间分布特征, 重新定位后地震的丛集性更加明显(图5)。 长宁— 珙县区域的地震活动明显存在NW和NE 2个优势方向, 且呈不对称的共轭分布, 其中NW和NE向地震密集带的长轴长度分别约30km和12km, 短轴长度均约5km(图5b)。 珙县— 筠连区域的地震活动表现为西疏东密, 且东段密集区的地震优势方向呈NE向(图5b)。 地震活动在2个密集区最东段出现相向扩展的现象。
 | 图 5 研究区域内地震重新定位结果Fig. 5 The earthquake relocation results in the study area. |
为了进一步研究地震活动的三维空间分布特征, 分别以上述2个地震密集区的长轴作为剖面(图5b), 绘制了沿不同剖面上地震深度分布及其随时间的变化图(图6)。 其中A— A'为沿长宁— 珙县地震密集区长轴走向的剖面(图6a), 结果显示该区域的地震活动在珙县附近存在稀疏段, 其东南侧的地震活动频次和强度明显高于西北侧, 且震级较大的地震震源深度相对较深, 远离珙县的地震震源深度逐渐变浅。 而珙县西北侧的地震活动主要集中分布在珙县至巡场镇一带, 震源深度基本在15km以内。 B— B'为沿珙县— 筠连地震密集区长轴走向的剖面(图6b), 剖面西段的地震分布零散, 东段地震活动密集。 从时间演化过程来看, 整个区域的地震呈现由分散到集中的活动特征, 2015年以来区域①的地震主要集中分布在珙县的巡场镇— 长宁县的富兴乡一带, 区域②的地震则集中分布在珙县上罗区。
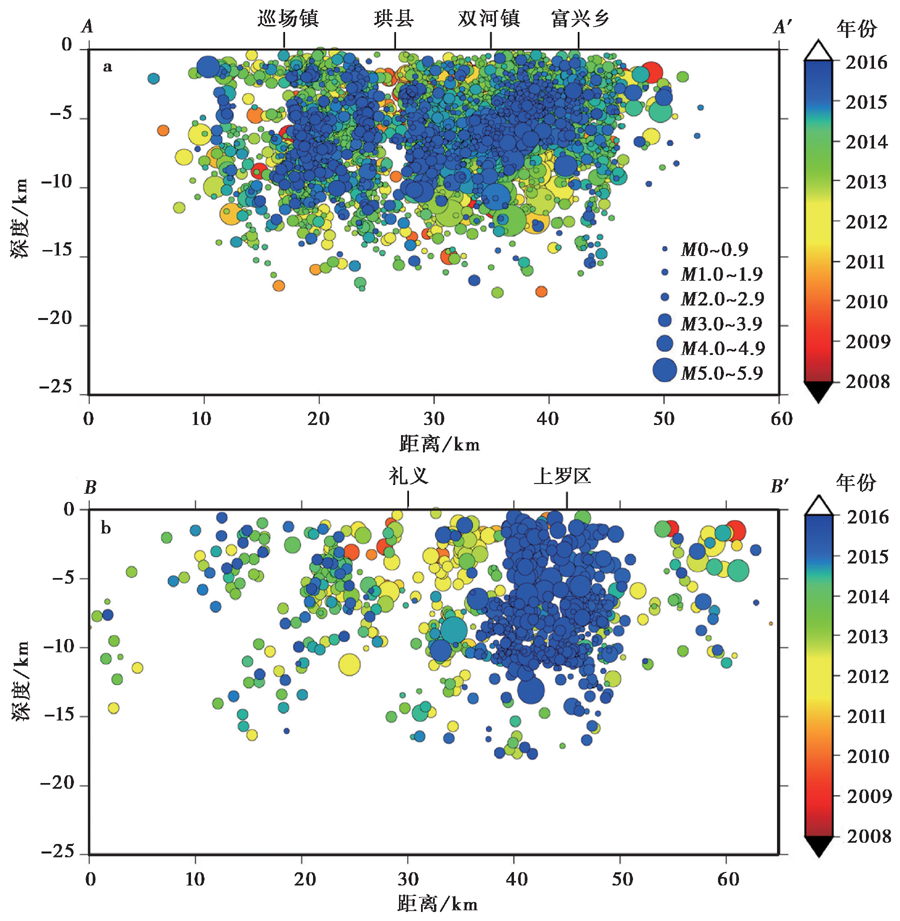 | 图 6 研究区域地震深度剖面图Fig. 6 The depth profile of earthquakes in the study area. |
在震源位置和速度结构的联合反演过程中, 走时残差
式中,
式中,
根据联合反演的基本公式(式(2)), 速度参数和震源参数是相互耦合的。 要在同一个方程中同时反演2种不同量纲的参数, 除了将增加算法的数值不稳定性外, 在实际中需要占用大量的计算机内存和机时, 因此必须进行参数分离(Pavlis et al., 1980; Spencer et al., 1980; 刘福田, 1984)。 本文采用刘福田等(1989)提出的正交投影算子, 将式(2)分解为分别求解速度参数和震源参数的方程组:
式中,
基于宜宾地区2008年1月— 2015年5月四川、 云南区域地震台网及宜宾地方台网记录的地震观测资料, 采用震源与速度结构联合反演的方法得到了研究区的P波速度结构, 下文将探讨不同深度平面和不同剖面上的速度结构特征及其与地震活动的关系。
3.2.1 解的分辨率分析
本文采用检验板方法(Humphreys et al., 1988; Inoue et al., 1990)来估计解的分辨率。 其基本原理是在给定速度模型参数的基础上, 对各节点进行正负相同的扰动, 然后根据实际射线分布通过正演计算得到理论走时数据, 为理论走时数据引入一定的随机误差后作为观测数据进行反演, 要求反演方法与实际成像的方法一致, 最后比较反演结果和检验板的相似程度, 作为解的可靠性估计。 文中加入的扰动值不超过正常值的± 3%。 图 7给出了震源优势深度为3km和6km的检测板结果, 由于地震活动主要集中分布在珙县及其附近的局部区域, 因此检验板也仅在地震活动密集区具有较高的分辨率。
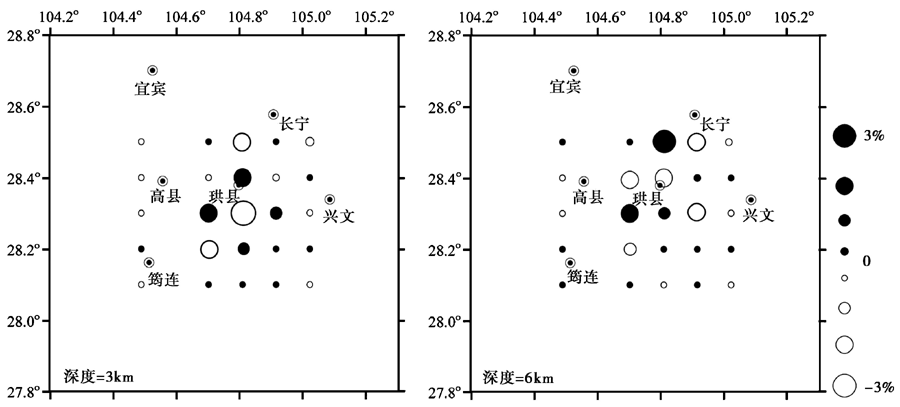 | 图 7 P波检验板分辨检测结果Fig. 7 Checkboard resolution test of P-wave. |
3.2.2 P波速度结构特征
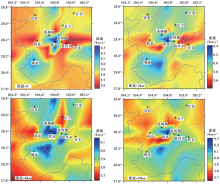
采用震源与速度结构联合反演的方法得到了研究区域不同深度的地壳P波速度结构, 同时考虑该区域地震震源的优势深度, 本文主要针对深度10km以内的上地壳速度结构进行分析。 图 8分别给出了深度为0km、 3km、 6km和10km的P波速度结构。 仅针对该研究区域而言, 地震密集区在10km的优势深度范围内均表现出相对较高的P波速度, 尤其在珙县西北侧和筠连以东地区, 这些高速区一般与地下较脆、 较强的岩体有关, 且往往是应力最为集中的区域。 吕子强等(2016)研究濮阳震群时发现小震集中区同样呈现高速异常, 认为高速异常体内的脆性介质容易聚集应力。 珙县东南侧的P波速度呈随深度增大逐渐增加的特点, 尤其在深6km处呈现相对较高的波速, 根据Kauster等(1974)的理论分析, 弹性波速度和裂隙状孔隙的刚度有很大的关系, 裂隙状孔隙刚度的增大将导致岩石的弹性波速度明显增加。
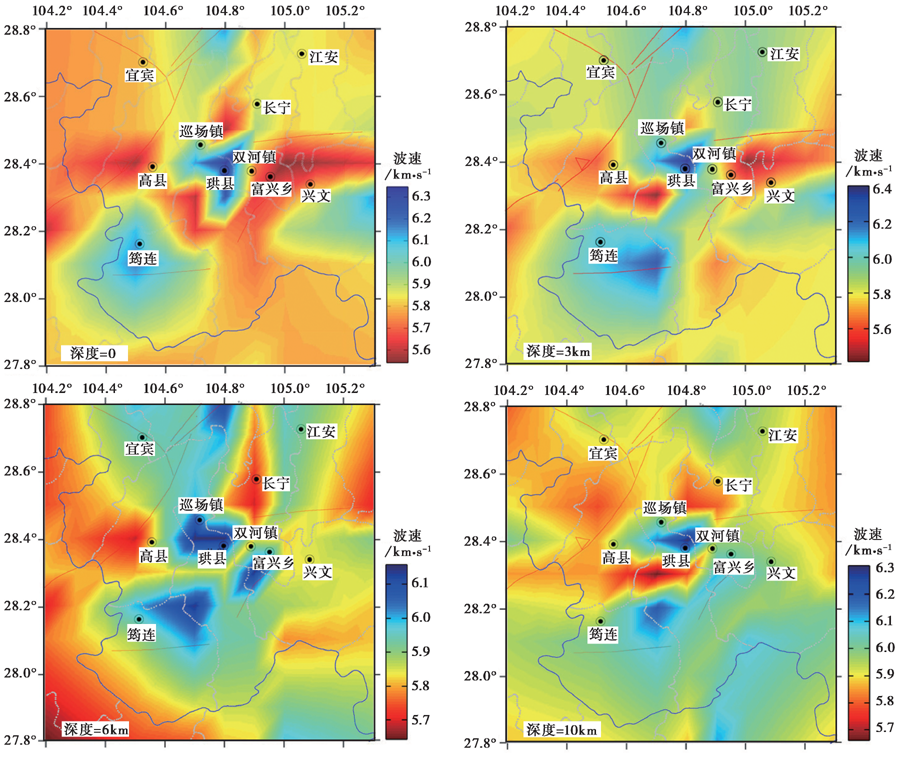 | 图 8 不同深度P波速度平面图Fig. 8 P-wave velocity plan in different depths. |
为进一步分析研究区的P波速度与地震活动的分布特征, 本文绘制了沿2条剖面的深部速度结构和距离剖面5km范围内的地震分布图(图9)。 沿A— A'剖面的深部速度结构显示, 珙县附近地下介质的P波速度略高于周边区域, 离珙县越远则P波速度越小, 地震密集活动带主要分布在高、 低波速过渡带; 沿B— B'剖面的速度结果显示, 以珙县上罗区附近为界, 西侧的P波速度略高于东侧, 地震活动发生在高、 低速过渡的区域。 对比速度结构与地震分布可以看出, 速度结构的不均匀性可能是控制地震分布的主要因素, 高、 低速异常体的过渡地带既是应力集中的区域, 又是介质相对比较脆弱的区域, 这样的环境具备了积累大量应变能的介质条件, 容易发生破裂并释放应力。
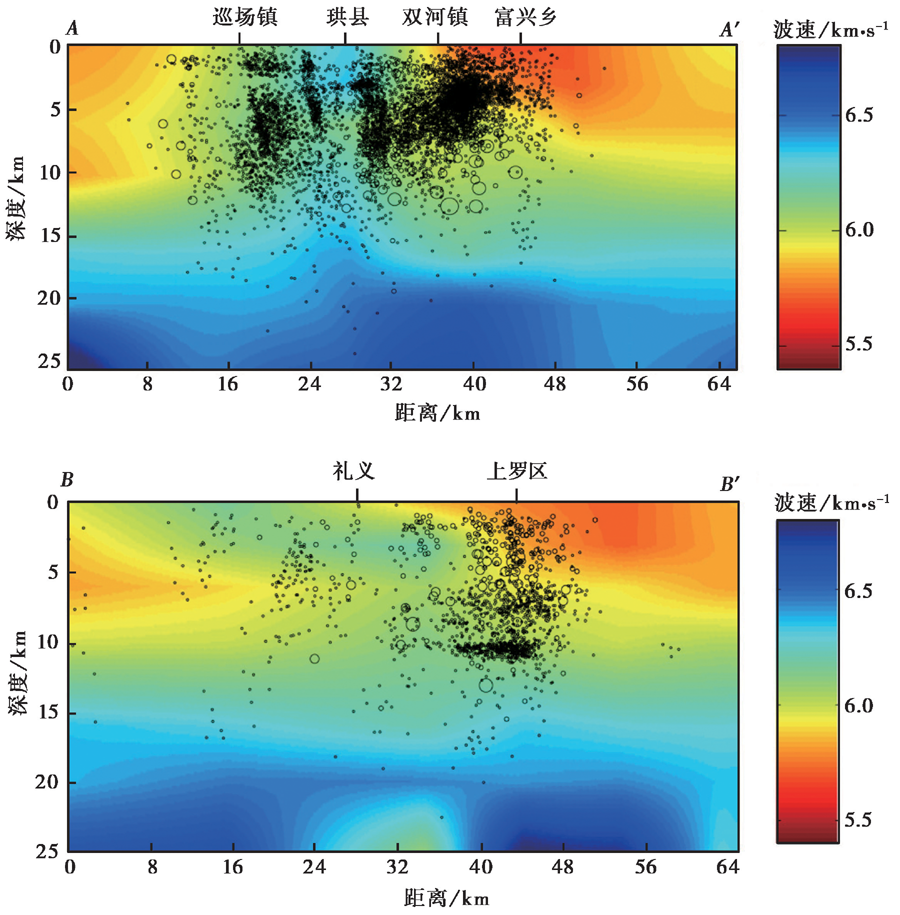 | 图 9 沿不同剖面的P波速度和地震分布Fig. 9 P-wave velocity and earthquake distribution along different profiles. |
本研究基于2008年1月— 2015年5月四川、 云南区域地震台网及宜宾地方台网记录的地震观测资料, 对四川宜宾地震密集区开展了地震定位和速度结构反演工作, 分析了地震活动的三维空间分布和不同深度的速度结构特征, 尝试为研究宜宾地区的地震活动规律和发震机理提供科学依据。 获得的主要认识如下:
(1)重新定位后, 宜宾地区地震空间丛集性更加明显, 集中分布在长宁— 珙县和珙县— 筠连2个区域, 其中长宁— 珙县地震密集区位于长宁背斜核部, 长轴走向与长宁背斜的主轴走向一致, 存在NW和NE 2个优势方向, 且呈不对称的共轭分布。 珙县— 筠连的地震活动表现出西疏东密的特点, 且东段密集区的地震优势方向为NE向。 2个地震密集区的地震活动在最东段出现相向扩展的现象。 震源深度剖面结果显示, 长宁— 珙县区域的地震活动在珙县附近存在稀疏段, 其东南侧的地震活动频次和强度明显高于西北侧, 且震级较大的地震震源深度相对较深, 远离珙县的地震震源深度逐渐变浅。
(2)P波速度显示, 仅对该研究区域而言, 宜宾地震密集区在10km的优势深度范围内均表现出相对较高的P波速度, 尤其在珙县西北侧和筠连以东地区, 这些高速区一般与地下较脆、 较强的岩体有关, 往往是应力集中的区域。 珙县东南侧的P波速度略有不同, 呈现随深度增大逐渐增加的特征, 特别是在深6km处呈现相对较高的波速。 研究区域内的地震主要发生在高、 低速过渡的区域, 分析认为速度结构的不均匀性可能是控制该区域地震分布的因素之一。
致谢 四川省地震监测中心、 宜宾市防震减灾局为本研究提供了地震观测资料; 中国地震台网中心周龙泉博士提供了震源与速度结构联合反演程序; 本文图片采用GMT软件(Wessel et al., 1991)绘制; 审稿专家为本文提出了中肯的修改意见。 在此一并表示感谢!
| [1] |
|
| [2] |
|
| [3] |
|
| [4] |
|
| [5] |
|
| [6] |
|
| [7] |
|
| [8] |
|
| [9] |
|
| [10] |
|
| [11] |
|
| [12] |
|
| [13] |
|
| [14] |
|
| [15] |
|
| [16] |
|
| [17] |
|
| [18] |
|
| [19] |
|
| [20] |
|
| [21] |
|
| [22] |
|
| [23] |
|
| [24] |
|
| [25] |
|
| [26] |
|
| [27] |
|
| [28] |
|