
地表破裂的几何结构与同震位移的相关性
[郝海健 , 何宏林
, 何宏林* , 魏占玉]
, 何宏林, 魏占玉]
|
|


〔作者简介〕 郝海健, 男, 1987年生, 2014年于中国地质大学(武汉)获构造地质学专业硕士学位, 主要从事活动构造和构造地貌学研究, 电话: 010-62009031, E-mail: zhetian-1.1@163.com。
研究地震地表破裂的几何结构与同震位移分布的空间关联性, 对于理解断层面几何形貌与地震活动的相关性具有重要意义。 文中运用滑动窗口方法, 对28个震例的地表破裂非规则几何结构特征(走向变化、 阶区大小和粗糙度)和同震位移分别进行了量化和均值计算, 并计算了二者之间的相关性, 最后分析讨论了走滑型和倾滑型震例的相关性之间的差异性及成因。 研究结果表明: 1)相对于倾滑型, 走滑型地震地表破裂的几何结构与同震位移的相关性更高, 表明走滑型断层(破裂)的几何特征在分段中具有更高的参考价值; 2)在走滑型震例中, 地表破裂的几何结构与同震位移之间存在负相关关系, 即地表破裂上某段的阶区、 走向变化、 粗糙度的特征值越大, 其对应的同震位移量越小; 3)走滑型地震的地表破裂非规则几何结构特征中, 与同震位移分布的相关程度由高到低依次为阶区大小、 走向变化、 粗糙度。
The existence of asperity has been confirmed by heterogeneously distributed seismic activities along the slipping surface associated with recent huge earthquakes, such as the M8.0 2008 Wenchuan earthquake and M9.0 2011 Tohoku-Oki earthquake. The location of asperity embedded in the seismogenic depth always corresponds to the area of high value of the co-seismic displacement and stress drop where the elastic energy is accumulated during the inter-seismic periods. Fault segmentation is an essential step for seismic hazard assessment. So far, the fault trace is dominantly segmented by considering its geometric features, such as bends and steps. But the connection between the asperity and geometric feature of the slipping surface is under dispute. Research on correlation between geometric feature of surface rupture and co-seismic displacement is of great significance to understand the relationship of seismicity distribution to geometric morphology of sliding surface. To scrutinize the correlation between the geometric feature and co-seismic displacement, we compiled 28 earthquake cases among which there are 19 strike-slip events and 9 dip-slip events. These cases are mainly collected from the published investigation reports and research papers after the earthquake occurred. All the earthquakes’ magnitude is between MW5.4~8.1 except for the MW5.4 Ernablla earthquake. The range of the rupture length lies between 4.5~426km. Each case contains surface rupture trace mapped in detail with corresponding distribution of co-seismic displacement, but the rupture maps vary in projected coordinate system. So, in order to obtain uniform vector graphics for the following data processing, firstly, vectorization of the surface rupture traces associated with each case should be conducted, and secondly, the vector graphics are transformed into identical geographic coordinate system, i.e. WGS1984-UTM projected coordinate system, and detrended to adjust its fitted trend line into horizontal orientation. The geometric features of surface rupture trace are characterized from three aspects, i.e. strike change, step and roughness. Previous studies about the rupture geometry always describe the characteristics from the whole trace length, consequently, the interior change of the geometric characteristics of the rupture is overlooked. In order to solve this problem, a technique of moving window with a specified window size and moving step is performed to quantify the change of feature values along the fault strike. The selected window size would directly affect the quantified result of the geometric feature. There are two contrary effects, large window size would neglect the detail characteristics of the trace, and small window size would split the continuity of the target object and increase the noise component. So we tested a set of sizes on the Gobi-Altay case to select a proper value and choose 1/25 of the whole rupture length as a proper scaling. Here, we utilize the included angle value of the fitted line in the adjoining windows, Coefficient of variation and the intercept value of the PSD(Power Spectra Density)for characterizing the change of strike, step size and roughness. The rupture trace is extracted within every moving window to calculate the aforementioned feature values. Then we can obtain three sets of data from every rupture trace. The co-seismic displacement is averaged in piecewise with uniform interval and moving step along the fault strike. Then, the correlations between three kinds of feature value and the co-seismic displacement are calculated respectively, as well as the P-value of correlation coefficient significant test.
We divided cases into two groups according to the slip mode, i.e. strike-slip group and dip-slip group, and contrast their results. In the correlation result list, there is an apparent discrepancy in correlation values between the two groups. The values of the strike-slip group mostly show negative, which indicates that geometric feature of the rupture trace is in inverse proportion to the displacement. In dip-slip group, the values distribute around zero, which suggests the geometric features is irrelevant to the displacement. Through the analysis of the correlation between the surface rupture and co-seismic displacement, the following conclusions can be reached: 1)In comparison with the dip-slip earthquake type, the characteristics of surface rupture of strike-slip earthquakes have a higher-level of correlation with the distribution of the co-seismic displacement, which suggests that the geometric features of strike-slip active faults may have a higher reference value in the fault-segmentation research than the dip-slip type; 2)In most strike-slip events, there is a negative correlation between the geometric features and the co-seismic displacement, which implicates that the higher the feature values of the steps, strike change and roughness, the lower the corresponding co-seismic displacement is; 3)Among the three quantified features of the surface rupture trace, the ranking of relevancy between them and the co-seismic displacement is: step size>strike change>roughness.
震后野外调查获得的地表破裂带与同震位移分布是研究地震破裂过程及评价地震危险性的基础资料(Clark, 1972; Petersen et al., 1994; Frankel et al., 2002; Xu et al., 2009)。 通过这些基础资料并结合反演破裂模型分析可知, 同震位移与余震震源在破裂面上的分布都具有显著的非均一性。 近期的特大地震, 如2008年M8.0汶川大地震(Xu et al., 2009)与2011年M9.0东日本大地震(Shen et al., 2009; Ammon et al., 2011; Wang et al., 2011)等, 都证实了这种非均一性的存在。 基于这种非均一特征, 地震学家提出的控制地震活动的凹凸体与障碍体模型(Aki, 1979, 1984; Voisin et al., 2002)已成为目前地震活动研究的基本假设。 大量震后地表破裂带调查结果显示, 除同震位移外, 同震地表破裂的几何结构在空间分布上也存在非均一性, 这种非均一性通常表现为阶区和走向变化等(Clark, 1972; Deng et al., 1984; Zhang et al., 1991; Candela et al., 2012)。 对这些地表破裂的几何结构进行定量化研究, 一方面可为模拟破裂及断裂力学过程提供准确的约束条件(马瑾等, 1996; Duan, 2010), 另一方面对研究孕震断层的运动学、 动力学及演化过程也具有重要意义(Scholz, 1982a, b; King et al., 2007)。
基于断层的几何结构特征划分几何段落, 可为一定区域内的地震破裂研究提供分析单元, 使区域地震危险性分析的技术思路更为明确(Schwartz et al., 1984; 丁国瑜, 1995)。 同时, 同震位移量的分布可用来判定凹凸体位置, 即破裂带上滑动量大于均值1.5倍的区域对应凹凸体的位置(Somerville et al., 1999)。 但基于几何结构特征划分的几何段落与同震位移对应的凹凸体之间是否具有明确的空间相关性, 是一一对应还是部分对应, 一直是人们关注的科学问题。 另外, 断层的几何结构如何控制地震活动、 哪种几何结构是主要控制因素等问题仍未解决。 近几十年来, 通过震后野外调查积累的地表破裂迹线和同震位移分布数据(Manighetti et al., 2005; Wesnousky, 2008), 为回答上述问题提供了重要的数据基础。 在对破裂带非规则几何结构特征的研究过程中, 人们主要采用了以下定量描述方法: 1)通过相邻段落间的走向夹角描述破裂带内走向变化(Sanders, 1989); 2)通过计算单位长度破裂带内的阶区数(Wesnousky, 1988), 阶区两侧断层的深度(D)或长度(L)、 其间的隔离量(S)和重叠度(O)来描述破裂带阶区的几何特征(Deng et al., 1986); 3)利用能谱密度(PSD)曲线的斜率和截距值来衡量地震破裂带的复杂度和粗糙度(Brown, 1987; Candela et al., 2009)。
为了分析地震的地表破裂几何结构与同震位移的相关性, 本文收集了28个震例的地表破裂与同震位移分布数据, 并分别从走向变化、 阶区大小和粗糙度3个方面量化地表破裂的几何结构特征, 计算了其各自与同震位移分布的相关性。 最后, 通过对结果的讨论获得了关于地表破裂几何结构与同震位移相关性的新认识。
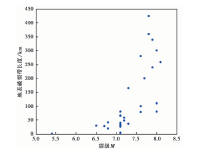
通过收集震后野外调查文献, 我们汇编了具有地表破裂几何结构与同震位移分布记录的28个震例(表1), 其中走滑型地震19例、 倾滑型地震9例。 震例的发震时间为1915— 2013年, 此期间调查技术方法从野外人工填图与测量逐渐变为野外考察与遥感、 测绘等技术相结合(Xu et al., 2009; Shi et al., 2012)。 与早期野外调查成果相比, 由于技术手段的进步, 后期获得的地表破裂迹线的分辨率与同震位移的测量精度更高。 震例的震级范围为MW5.4~8.1。 一般情况下, M> 6.5的地震会在地表产生破裂与同震位移(邓起东等, 1992), 在本文的震例集合中, 除逆断型Ernabella地震(MW5.4)外其余震例的震级均大于M6.5。 地表破裂的长度为4.5~426km, 各震例的地表破裂长度与最大同震位移量均随着震级的增加而增大(图1), 这与前人的经验统计结果相同(Wells et al., 1994)。
| 表1 同震地表破裂数据 Table1 Dataset of co-seismic surface ruptures |
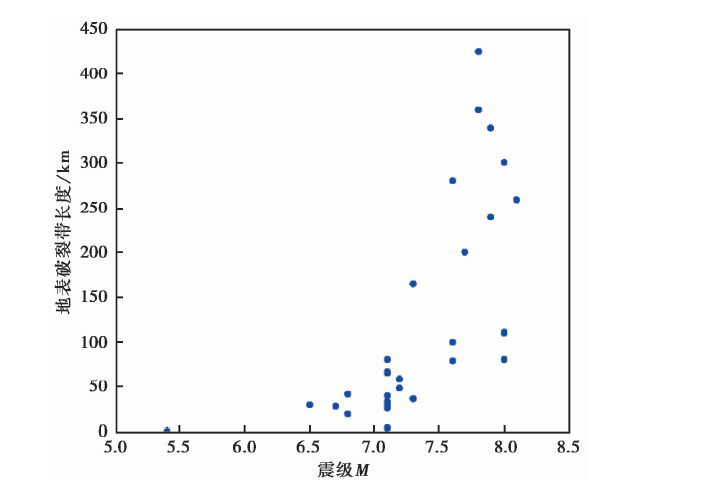 | 图 1 地表破裂长度随震级变化的分布Fig. 1 Distribution of surface rupture length as a function of earthquake magnitude. |
为便于量化分析地表破裂几何结构特征, 我们对收集的数据进行如下预处理: 1)通过矢量化将文献中的破裂迹线变为计算机可处理的矢量图形。 为了保证矢量图形与原数据的一致性, 在采样过程中将采样点间隔尽可能控制在100m以内。 2)通过投影变换将矢量图形的坐标系(地理坐标系或投影坐标系)转化为WGS1984-UTM投影坐标系。 3)使用线性法(Linear Method)对断层迹线矢量图形进行等间隔插值(间隔1m), 将其转化为可量化处理的矩阵。 4)去趋势, 即拟合破裂迹线获得其总体走向线, 然后将走向线调至水平。
参考前人对破裂带的研究方法(何宏林等, 1995), 本文从走向变化、 阶区大小和粗糙度3个方面对同震地表破裂的非规则几何结构特征进行量化描述。 前人的分析方法虽然能反映破裂带整体或某一局部范围的非规则几何结构特征, 但无法表现几何结构特征从破裂一端到另外一端在走向上的变化趋势, 这种变化趋势代表着破裂内部几何结构特征分布的非均一性。 为了描述这种变化趋势, 本文采取滑动窗口方法, 即在地表破裂总体走向上依次滑动窗口, 并逐个计算窗口内3种几何结构的特征值。
本文的数据处理总体思路可以分为3步(图2): 首先, 将地表破裂的几何结构特征划分为3个方面, 即走向变化、 阶区大小和粗糙度; 然后, 结合滑动窗口的方法, 在走向(水平)方向上分别计算每个窗口内破裂带迹线3种几何结构的特征值, 获得反映破裂带沿走向变化趋势的数据; 同时, 采用相同方法计算每个窗口内的平均同震位移数据; 最后, 计算3组数据各自与同震位移数据的相关系数与P值, 通过显著性检验得到各相关系数的显著性结果。 下文将具体介绍对窗口内走向变化、 阶区大小、 粗糙度及同震位移的量化处理, 滑动窗口尺度及滑动步长的确定以及相关性结果的分析方法。
 | 图 2 数据处理流程图Fig. 2 Data processing flow chart. |
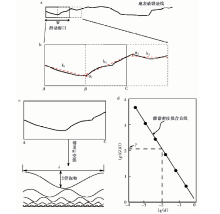
采用计算段落走向之间夹角的方法量化描述窗口内迹线走向的变化(Sanders, 1989)。 如图3a和3b所示, 对窗口内迹线走向变化的计算步骤分为3步: 1)等分窗口内的迹线; 2)分别对等分的2条迹线进行最小二乘线性拟合, 获得2条迹线的走向; 3)计算2条迹线走向的夹角, 并用其代表相应窗口内迹线走向的变化程度(图3b中k1与k2的夹角α 1)。
 | 图 3 数据处理示意图 a 地表破裂迹线; b 求解滑动窗口内走向变化的示意图; c 自然波的傅里叶变换; d 求解能谱密度(PSD)截距值的示意图Fig. 3 Schematic diagram of data processing. |
本文用窗口内迹线采样点(插值点)的离散程度来描述阶区特征。 当窗口内存在阶区时, 迹线采样点的离散程度就会增加, 导致其变异系数值变大, 且变异系数随着窗口内阶区宽度的增加而增大。 因此, 变异系数可作为描述阶区大小的参数, 其表达公式为
其中, SD为标准方差, Mean为平均值。 变异系数(CV)无量纲, 与直接使用标准方差(SD)描述离散程度相比, 其可消除单位和样本均值不同带来的影响, 从而使断层上各滑动窗口之间迹线采样点的离散程度具有可比性。
本文使用能谱密度(PSD)曲线拟合直线的截距来描述窗口内破裂迹线的粗糙度。 能谱密度方法首先将一个时间序列或者空间序列利用快速傅里叶变换转化为频率域内的一组正弦波, 这些正弦波具有不同的波长、 振幅与相位(图3c)。 振幅的平方代表正弦波的能量, 能量随频率的变化即为能谱图, 在频率上对能谱进行归一化处理即为能谱密度。 断层迹线的尺度性和起伏程度可通过能谱密度曲线的斜率与截距来表示, 其中斜率表示断层迹线形貌随尺度的变化特征, 截距值代表单位长度上迹线的起伏程度。 在100m及以上尺度, 能谱密度曲线代表迹线本身的形貌特征, 而100m以下尺度则受到数插值方法及噪声控制(郝海健等, 2017)。 因此, 我们采用能谱密度曲线拟合直线在100m处的截距值(图3d中的γ 值)表征迹线在该尺度上的起伏程度。 断层迹线的数据处理步骤包括断层迹线的拼接、 去趋势和傅里叶变换等, 具体描述参见文献(郝海健等, 2017)。
同震位移数据的处理步骤共包括3步: 1)为了提高结果的正确性, 首先对同震位移与地表破裂在空间分布上进行匹配, 以确保两者的对应性, 如果在破裂两端无测量点, 就设定破裂两端测量点为默认值0; 2)等间隔插值同震位移数据测量点(或者包络线), 插值间隔取1m; 3)求解窗口内数据点的均值, 用该均值代表对应窗口内的同震位移值。
滑动窗口尺度及滑动步长的大小会直接影响断层迹线几何结构特征的量化结果。 窗口尺寸过大将忽略迹线上的细节特征, 使局部特征不明显; 太小则会割裂目标对象内部的连续性, 增加噪音成分(Sung et al., 2004; Bi et al., 2012; He et al., 2016)。 Malinverno(1990)利用滑动窗口进行自仿射曲线的均方值(RMS)粗糙度计算时, 建议窗口尺寸应该控制在总长度的1/5 以内, 但至少应包含10个数据点(重采样点), 滑动步长为窗口尺度的1/2。 本研究中, 我们参考前人研究经验, 选取1957年戈壁-阿尔泰(Gobi-Altay)地震作为研究实例, 采用总长度的1/5、 1/10、 1/15、……、1/50作为窗口尺度计算其几何结构特征, 以确定最优窗口尺度。 计算结果可参见补充文档①(https://www.researchgate.net/publication/339301165_supplemental_file_the_selection_of_moving_window_sizw。)。 通过对比不同窗口尺度的特征值可以发现, 大尺度窗口(1/5)的结果数值近似相等, 存在趋同化的不足; 小尺度窗口(1/50)的结果数值具有相邻点值变化大、 总体离散程度高的特点, 表明其具有较高的噪音成分。 对比后发现将总长度的1/25 作为窗口尺度的计算结果既能保留迹线上的细节特征, 又能保持研究对象内部的连续性、 抑制噪音成分。 因此, 确定总长度的1/25 作为本研究中的最优窗口尺度, 滑动步长为窗口尺度的1/2。
总体而言, 数据处理可进一步概括为: 利用确定的窗口尺度与滑动步长, 并结合对地表破裂走向变化、 阶区大小与粗糙度的研究方法量化地表破裂迹线的非规则几何结构特征, 获得3组分别反映迹线走向变化、 阶区大小与粗糙度的数据; 用相同窗口尺度与滑动步长, 在对应的同震位移中获得一组位移数据; 然后, 分别求解3组数据与同震位移数据的相关系数和检验P值, 当P< 0.05时, 该相关系数通过显著性检验。 因此, 我们可以得知破裂迹线的3种非规则几何结构特征各自与同震位移的相关性是否显著, 进而讨论几何段落与凹凸体之间的关联性。
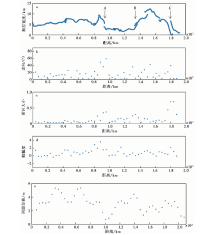
本节以1957年MW8.1戈壁-阿尔泰(Gobi-Altay)地震为例, 展示具体震例的数据处理结果。 戈壁-阿尔泰(Gobi-Altay)地震发生在博格达(Bogd)左行走滑断裂带上, 通过震后精细填图可知, 本次地震产生的地表破裂长约260km, 平均位错量为3.5~4m(Choi et al., 2012)。 同震地表破裂的几何分布与同震位移分别见图4a和4e。 借助滑动窗口, 按照本文介绍的数据处理方法对该地表破裂的几何结构特征进行量化描述, 分别获得反映走向变化、 阶区大小和粗糙度的结果, 见图4b— d。 在图4a中, 标注为A、 B和C的3点为野外调查中的人工分段点, 计算结果数值的异常高值与此3点的位置具有较好的对应关系。
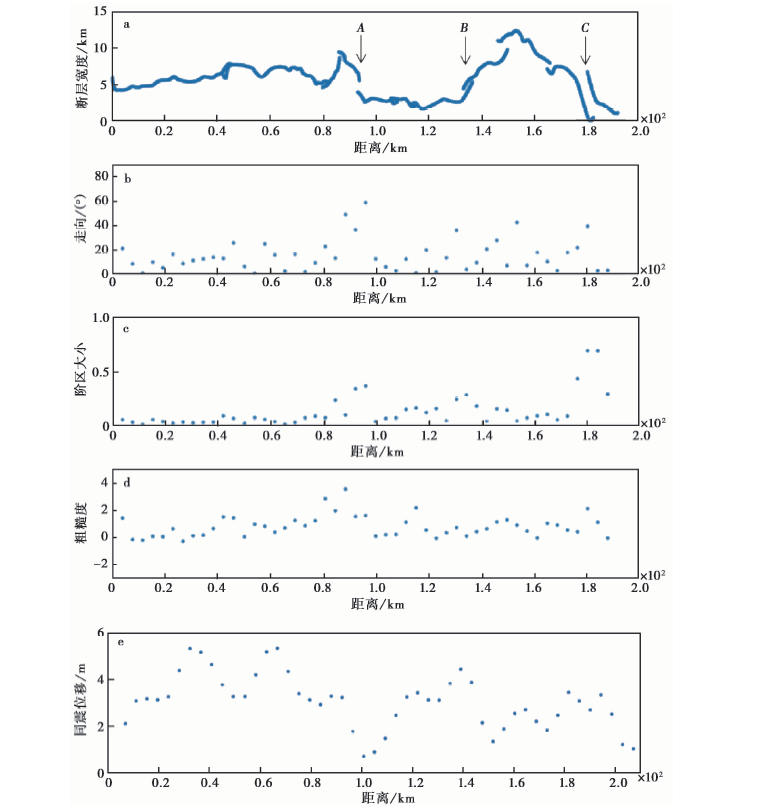 | 图 4 戈壁-阿尔泰(Gobi-Altay)地震数据处理结果Fig. 4 The processing result of Gobi-Altay earthquake data. |
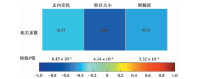
地表破裂几何结构的特征值与同震位移的相关性结果如图 5所示。 结果显示, 走向变化、 阶区大小和粗糙度与同震位移的相关系数分别为-0.37、 -0.60和-0.41, 均呈负相关。 同时, 图 5中间部分给出对应的检验P值分别为8.45× 10⁻³、 4.14× 10⁻⁶ 和3.32× 10⁻⁴, 表明3个几何结构特征值与同震位移的相关关系都具有显著性。
 | 图 5 地表破裂几何结构与同震位移的相关性结果Fig. 5 The correlation between the rupture geometry and co-seismic displacement. |
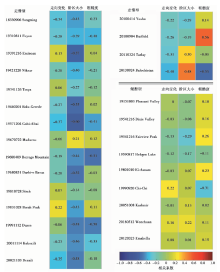
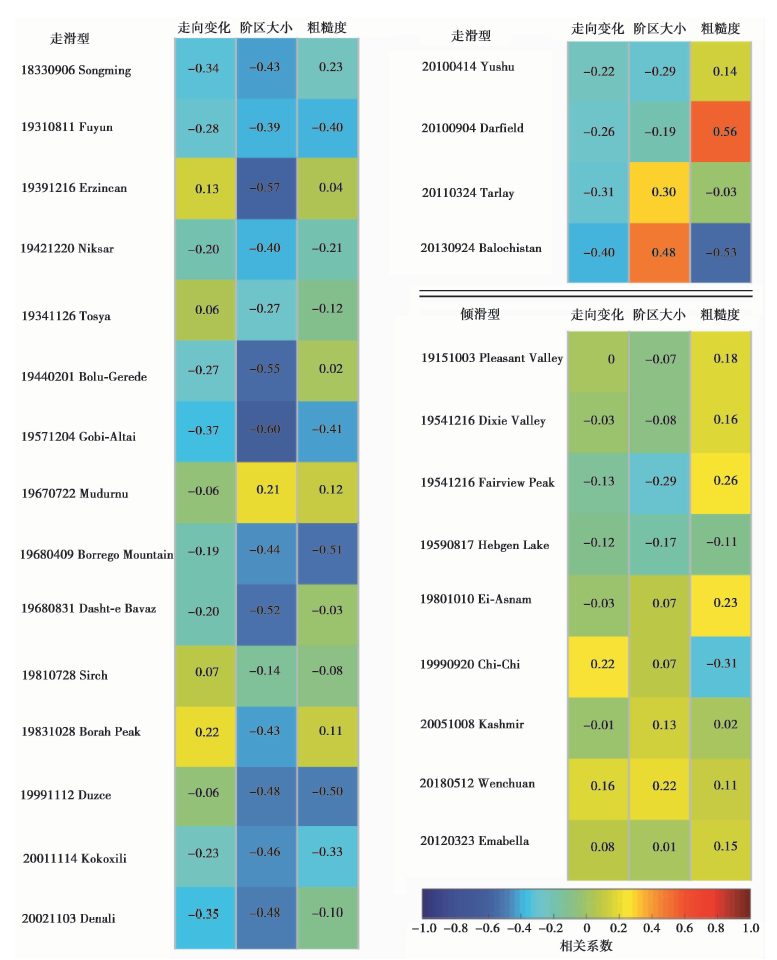
按照处理戈壁-阿尔泰(Gobi-Altay)震例数据的方法, 我们对收集到的所有震例数据均进行了处理, 获得了相关系数图(图6)与对应的P值结果(表2)。 为比较不同震源机制类型的震例所得结果的差异, 按照走滑型与倾滑型对结果进行了分类, 并按照发震时间顺序列于图 6与表2中。 图 6显示, 倾滑型与走滑型震例各自的相关性结果在色调上明显不同。 走滑型震例的颜色多呈现蓝— 深蓝色, 表示多数相关系数< 0, 呈负相关趋势; 而倾滑型以绿色为主, 表明相关系数多在0值附近分布, 呈不相关状态。 对显著性检验P值(表2)进行统计后发现, 有15/19 的走滑型震例和2/9的倾滑型震例呈负相关, 且通过了相关显著性检验, 走滑型的比例明显高于倾滑型。
| 表2 相关系数的检验P值 Table2 P-value of correlation coefficient significance test |
 | 图 6 地震数据集中所有震例的相关性分析结果Fig. 6 The correlation analysis result of all compiled earthquake data. |
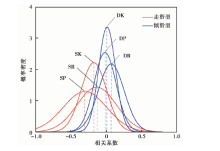
为了更加直观地体现相关系数值的分布规律, 我们对走滑型和倾滑型震例各自的相关系数值做了进一步统计分析。 首先, 利用Kolmogorov-Smirnov(K-S)方法检验倾滑型和走滑型各相关系数的数组, 结果显示各数组均符合正态分布; 然后, 分别求解各数组的正态概率密度分布曲线(图7), 结果显示走滑型的相关系数(红色)分布在-0.2附近, 倾滑型的相关系数(蓝色)趋于0。
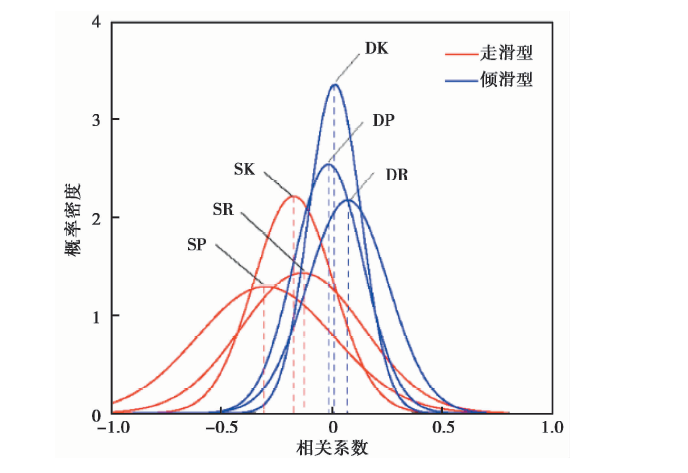 | 图 7 走滑型与倾滑型各数据组的正态概率密度分布 SK 走滑型走向变化; SP 走滑型阶区; SR 走滑型粗糙度; DK 倾滑型走向变化; DP 倾滑型阶区; DR 倾滑型粗糙度Fig. 7 Probability density distribution of strike-slip and dip-slip earthquake data sets. |
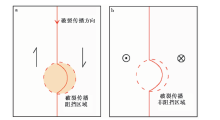
我们认为断层两盘相对滑动的方向与几何非规则体的空间展布走向是否一致, 是造成走滑型与倾滑型震例在相关性上存在差异的主要原因。 如图8中的模型所示, 在滑动方向与走向一致时(破裂模型Ⅲ )(Scholz, 2002), 当破裂传播到弯折、 阶区、 粗糙度高值区域等几何非规则体时受到阻挡, 继而在该区域周围形成局部应力增强与应变累积, 造成同震位移量的降低; 当滑动方向垂直于走向时(破裂模型Ⅱ )(Scholz, 2002), 沿断层走向分布的几何非规则体就不会对断层两盘的相对滑动产生阻挡作用, 在这种情况下, 断层两盘的相对运动与断层的几何结构展布无关。 因此, 与走滑型震例相比, 倾滑型震例的地表破裂与同震位移的相关性更小。
 | 图 8 几何非规则体影响地震破裂传播的模式图 a 走滑型; b 倾滑型Fig. 8 Schematic diagram of geometric features affecting seismic slip. |
相关性计算结果(图6)显示, 在走滑型震例中存在非负相关的情况, 也有少量负相关关系的震例属于倾滑型。 我们认为造成这种现象的原因主要有以下2点: 1)大多数地震的震源机制并非纯走滑或者纯倾滑, 而是两者兼具。 因此, 该现象可能是由于破裂过程中次要倾滑分量(或次要走滑分量)的作用所致。 2)沿断层走向分布的岩性存在差异, 不同岩性具有不同的岩石物理学性质, 尤其会表现出不同的能干性, 在相同的应力场中会发生截然不同的岩石变形行为。 在这种情况下, 岩性的差异就会超越孕震断层几何构造, 成为控制滑动面上非均一性的主要成因, 从而引起地表破裂几何结构与同震位移分布的非相关性。
虽然地表破裂的非规则几何结构特征与同震位移分布之间存在相关性, 但是它们之间并没有因果关系。 其可能均为孕震断层中凹凸体、 障碍体与动态破裂作用在空间上相互叠加后呈现在地表的一种结果(Candela et al., 2011a)。 其中, 同震地表破裂的几何结构特征更多地继承了发震断层原有的几何结构特征, 而同震位移分布的非均一性则受到发震断层的几何构造、 断层两盘围岩的物理性质与断裂应力状态的空间差异的共同控制(Mai et al., 2002; Lavalle'e et al., 2005; Schmittbuhl et al., 2006; Candela et al., 2011b)。
在走滑型地表破裂几何结构中, 阶区大小、 走向变化和粗糙度的特征值在空间分布上均与同震位移呈显著相关。 那么这三者与同震位移的相关程度是否存在强弱差异?我们求取走滑型震例3列相关系数数组95%置信度的置信区间, 结果分别为(-0.17± 0.09)、 (-0.30± 0.15)和(-0.13± 0.13)。 该结果表明, 在走滑型地表破裂的非规则几何结构特征中, 与同震位移分布的相关程度由高到低依次为阶区大小、 走向变化和粗糙度。
通过相关性分析及讨论, 我们可以得到以下结论: 1)相对于倾滑型地震, 走滑型地震的地表破裂几何结构与同震位移的相关性更高, 表明走滑型断层中的几何结构在分段中更具有参考价值; 2)在走滑型震例中, 地表破裂的几何结构与同震位移之间存在负相关关系, 即地表破裂中的阶区、 走向变化、 粗糙度的特征值越大, 对应的同震位移量越小; 3)在走滑型地震中, 地表破裂的非规则几何结构特征与同震位移分布的相关程度由高到低依次为阶区大小、 走向变化和粗糙度。
| [1] |
|
| [2] |
|
| [3] |
|
| [4] |
|
| [5] |
|
| [6] |
|
| [7] |
|
| [8] |
|
| [9] |
|
| [10] |
|
| [11] |
|
| [12] |
|
| [13] |
|
| [14] |
|
| [15] |
|
| [16] |
|
| [17] |
|
| [18] |
|
| [19] |
|
| [20] |
|
| [21] |
|
| [22] |
|
| [23] |
|
| [24] |
|
| [25] |
|
| [26] |
|
| [27] |
|
| [28] |
|
| [29] |
|
| [30] |
|
| [31] |
|
| [32] |
|
| [33] |
|
| [34] |
|
| [35] |
|
| [36] |
|
| [37] |
|
| [38] |
|
| [39] |
|
| [40] |
|
| [41] |
|
| [42] |
|
| [43] |
|
| [44] |
|
| [45] |
|
| [46] |
|
| [47] |
|
| [48] |
|
| [49] |
|
| [50] |
|
| [51] |
|
| [52] |
|
| [53] |
|
| [54] |
|
| [55] |
|
| [56] |
|
| [57] |
|
| [58] |
|
| [59] |
|
| [60] |
|
| [61] |
|
| [62] |
|
| [63] |
|
| [64] |
|
| [65] |
|
| [66] |
|
| [67] |
|