重庆地区地壳各向异性及其构造启示
高见1), 杨宜海2),*, 黄世源1), 杨聪3), 张元生4), 柳存喜5), 李少睿2), 花茜2)
1) 重庆市地震局, 重庆 401147
2) 陕西省地震局, 西安 710068
3) 成都理工大学地球物理学院, 成都 610059
4) 甘肃省地震局, 兰州 730000
5) 雅砻江流域水电开发有限公司, 成都 610051
*通讯作者: 杨宜海, 男, 1988年生, 助理研究员, 主要从事地震各向异性、 构造应力场和壳幔速度结构研究, E-mail: yangyh529@163.com

〔作者简介〕 高见, 男, 1988年生, 2013年于中国地震局兰州地震研究所获固体地球物理学专业硕士学位, 工程师, 主要从事地震活动性和地壳介质研究, 电话: 023-67086623, E-mail: dzggjj@163.com

摘要

文中搜集了重庆地震台网14个宽频带地震台站记录的远震波形资料, 利用接收函数Pms到时的方位变化首次获取了重庆地区的地壳各向异性结果, 同时采用接收函数 H- Kappa方法获得了研究区的地壳厚度及泊松比。 结果显示: 重庆地区的地壳厚40~50km, 在大巴山推覆构造带附近存在明显的梯度变化; 地壳泊松比平均为0.23~0.31, 在重庆中部泊松比值达到最大。 重庆地区的地壳快慢波时间延迟为0.08~0.48s, 平均为0.22s; 绝大部分地区地壳的快波方向与断裂走向比较一致。 结合GPS观测、 构造应力场和XKS分裂测量等研究资料, 分析认为: 川东褶皱带和川黔断褶带的地壳和岩石圈上地幔为解耦变形, 其南、 北段具有不同的变形特征; 盆山边界可能存在复杂的深部构造变形, 影响了局部地区平均方位各向异性的快波方向, 不同走向的断裂活动还弱化了部分区域的平均各向异性强度; 大巴山推覆构造带南部的地壳变形可能主要受到断裂带构造的影响。

关键词: 重庆地区; 接收函数; 各向异性; 地壳结构
中图分类号:P315.2 文献标志码:A 文章编号:0253-4967(2020)01-0147-16
CRUSTAL ANISOTROPY AND ITS TECTONIC IMPLICATIONS IN THE CHONGQING REGION
GAO Jian1), YANG Yi-hai2), HUANG Shi-yuan1), YANG Cong3), ZHANG Yuan-sheng4), LIU Cun-xi5), LI Shao-rui2), HUA Qian2)
1) Chongqing Earthquake Agency, Chongqing 401147, China
2) Shaanxi Earthquake Agency, Xi'an 710068, China
3) College of Geophysics, Chengdu University of Technology, Chengdu 610059, China
4) Gansu Earthquake Agency, Lanzhou 730000, China
5) Yalong River Hydropower Development Co., Ltd., Chengdu 610051, China
Abstract

The receiver function which carries the information of crustal materials is often used to study the shear-wave velocity of the crust as well as the crustal anisotropy. However, because of the low signal-to-noise ratio in Pms(P-to-S converted phase from the Moho), the crustal anisotropy obtained by shear-wave splitting technique for a single receiver function usually has large errors in general. Recent advance in the analysis method based on Pms arrival time varying with the back-azimuth change can effectively overcome the above defects. Thus in this paper, we utilize the azimuth variations of the Pms to study the crustal anisotropy in Chongqing region for the first time. According to the earthquake catalogue provided by USGS, seismic waveform of earthquakes with magnitude larger than 5.5 and epicenter distance range of 30°~90° between January 2015 and December 2016 are collected from 14 broadband seismic stations of Chongqing seismic network. We carry out the bootstrap resampling to test the reliability of the radial maximum energy method for the observation data. In addition, we also applied the receiver function H- Kappa analysis in this paper to study the crustal thickness and Poisson's ratio.
Our results show the crustal thickness ranges from 40~50km, and there is a thin and thick crust in the southern and northern Chongqing, respectively. The crustal average Poisson's ratio ranges from 0.23~0.31, the Poisson's ratio reaches the maximum value in the central part of Chongqing, while the Poisson's ratio in the northern and southern parts of Chongqing is obviously low. We obtain the crustal anisotropy from 9 stations in total. The delay time of crustal anisotropy distributes between 0.08s and 0.48s, with the average value of 0.22s. Among them, the CHS, QIJ and WAZ stations in central Chongqing have relatively large crustal delay time(>0.3s), followed by ROC station in the western Chongqing(0.25s), while the delay time in CHK station in northern Chongqing and WAS station in southern Chongqing are 0.08s, showing relatively weak crustal anisotropy. The fast polarization directions(FPDs)also change obviously from south to north. In southern Chongqing, FPDs are dominant in NNE-SSW and NEE-SWW, while the FPDs in WAZ station change to NWW-SEE, and the FPDs appear to be NW-SE in CHK in the northern Chongqing. In general, the FPDs are sub-parallel to the strikes of faults in most areas of Chongqing areas.
Combined with other results from GPS observations, tectonic stress field and XKS splitting measurements, the main conclusions can be suggested as following: The cracks preferred orientation in the upper crust is not the main source of crustal anisotropy in Chongqing area. The crust and lithospheric upper mantle in the eastern Sichuan fold belt(ESFB)and Sichuan-Guizhou fault fold belt(SGFFB)are decoupled, and the deformation characteristics in the north and south parts of ESFB and SGFFB is different. The complex tectonic deformation may exist beneath the mountain-basin boundary, causing the fast directions of crustal anisotropy different from that in other areas of ESFB and SGFFB. The faults with different strikes may weaken the strength of average crustal anisotropy in some areas. The crustal deformation in southern Dabashan nappe belt(DNB)may be mainly controlled by the fault structure.

Keyword: Chongqing region; receiver function; seismic anisotropy; crustal structure
0 引言

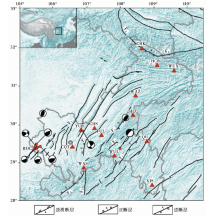
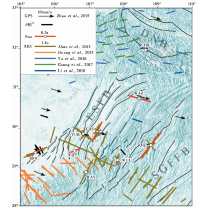
重庆地区(28° ~33° N, 105° ~111° E)位于扬子克拉通的西部, 区内不同走向的地质构造比较发育(图1), 其构造格架大致可分为一系列NE向断裂及褶皱构造和NWW向弧形推覆构造(主要为秦岭南缘大巴山褶皱-冲断推覆构造的南段)。 按地壳结构划分, 重庆地区自西向东大致可分为3段: 西段属四川盆地; 中段为川东褶皱带, 以华蓥山断裂(图1, F1)为界; 东段为川黔断褶带, 以彭水断裂(图1, F5)为界(胡建平等, 2005)。 重庆地区地处长江中游地震带, 地震活动以小震频繁、 强震较弱为主要特征, 历史上仅发生5级以上中强地震7次(最大为1856年黔江小南海6 1/4级地震), 而近几年相继发生了2016年垫江4.3级、 荣昌4.9级以及2017年武隆5.0级地震, 地震活动性有增强的现象。 前人在此区域通过GPS、 震源机制解和现代地壳形变测量资料获得了区域构造应力场和应力环境结果(丁仁杰等, 2004; 李峰等, 2013; 陈涛等, 2018)。 近年来, 通过开展XKS的分裂测量研究获得了重庆及周边地区的壳幔各向异性参数(Zhao et al., 2013; Huang et al., 2015; Yu et al., 2016; Chang et al., 2017; Li et al., 2018), 但目前尚未针对该区的地壳各向异性特征开展过专门的研究, 该区的地壳深部结构和动力学机制仍不明确。

图 1 重庆地区的构造背景及台站分布
红色三角形表示重庆地震台网的宽频带固定台站; 黑色震源球为4级及以上历史地震的震源机制(重庆市地震局, 2018, 重庆市2019年度地震趋势研究报告。)
F1华蓥山断裂带; F2长寿-遵义断裂; F3七曜山-金佛山断裂; F4方斗山断裂; F5彭水断裂; F6城口断裂
Fig. 1 Tectonic setting and location of seismic stations in the Chongqing region.

在构造应力场作用下, 上地壳中大量裂隙定向排列使地壳介质呈现方位各向异性的特征。 中下地壳中的云母及角闪石具有显著的各向异性, 在剪切应力作用下这些矿物会形成晶格定向排列, 从而表现出各向异性特征。 因此, 可通过地壳各向异性来研究地壳的介质特性和应力状态, 从而分析应力场变化、 开展地震预测研究等(吴晶等, 2009)。 各向异性可由多种地震学方法获取, 包括面波频散(Montagner et al., 1986; Simons et al., 2002; Yao et al., 2010; 易桂喜等, 2010)、 Pn波走时的方位变化(McNamara et al., 1997; Hess et al., 2003; Liang et al., 2004; Pei et al., 2007)、 接收函数(McNamara et al., 1993; Sun et al., 2012, 2015; Chen et al., 2013b; Wang et al., 2016)和剪切波分裂(Silver et al., 1991; Silver, 1996; 高原等, 2008, 2018; Gao et al., 2009, 2011)等。

接收函数携带了地壳内的介质信息, 通常被用来研究地壳各向异性。 然而在实际观测中, Pms震相存在信号弱、 信噪比不高的情况, 对单个接收函数使用剪切波分裂测量技术获取的各向异性参数往往存在较大误差。 近年来发展的基于接收函数到时方位变化的分析方法可有效克服上述缺陷(Liu et al., 2012; Wu et al., 2015), 目前已被应用于多个地区的地壳各向异性研究中(Sun et al., 2012, 2015; Kong et al., 2016; Wang et al., 2016; 韩明等, 2017; Zheng et al., 2018)。 本文搜集了重庆地区的宽频带地震记录, 采用该方法首次对重庆地区的地壳各向异性进行研究, 并结合GPS观测、 构造应力场和XKS分裂测量等研究资料, 对地壳各向异性特征和深部动力学过程进行探讨。

1 数据与方法
1.1 数据

本文搜集了2015年1月— 2016年12月重庆地区14个宽频带固定台站记录的波形资料, 根据美国地质调查局(USGS)提供的地震目录, 选取了438个震级> 5.5、 震中距为30° ~90° 的远震记录(图2)。 选取的远震事件具有较好的方位覆盖, 有利于减小采用接收函数研究地壳各向异性带来的误差。 对原始三分量地震记录进行波形截取(P波初动前10s至初动后60s)、 去仪器响应、 带通滤波(0.05~2.0Hz)及坐标系旋转(从ZNE旋转至ZRT坐标系)后, 对RZ分量采用时间域迭代反褶积提取P波的接收函数(Herrmann, 2013), 其中高斯滤波系数设定为2.5。 对所提取的各台的接收函数进行挑选, 删除信噪比低、 Pms波形震相不清晰的接收函数。

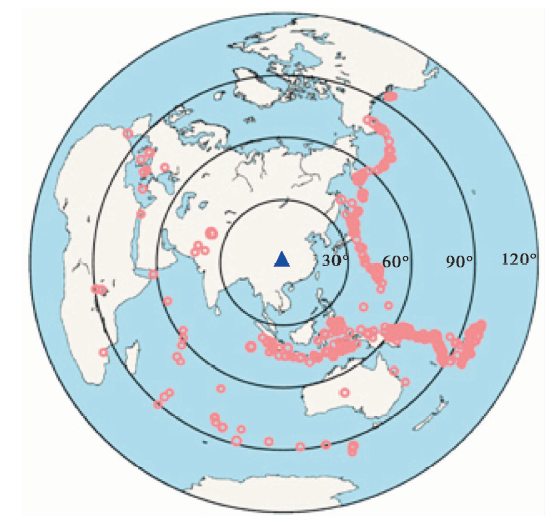
图 2 本文选取的远震事件分布图
蓝色三角形表示台网的中心位置; 红色圆圈表示地震震中
Fig. 2 Distribution of tele-seismic events used in this study.

1.2 方法

对于同一台站提取的接收函数, 其Pms震相相对P波的到时差不仅取决于台站下方的地壳各向异性, 而且还与事件的震中距和震源深度相关。 例如, 据估算, 对于厚度为50km、 波速比为1.78的地壳, 震中距为30° 和90° 的事件所产生的Pms震相到时差约0.4s(Chen et al., 2013a)。 由此可见, 在利用接收函数分析获取地壳各向异性参数前需进行时差校正, 将提取得到的接收函数波形校正到同一震中距和震源深度上。

因此, 本文首先采用了接收函数叠加扫描(H-Kappa)方法获取了各台的地壳厚度及平均波速比(VP/VS)(Zhu et al., 2000), 以便进行接收函数时差校正。

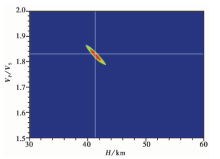
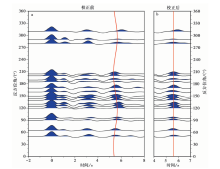
利用H-Kappa方法进行计算时, 对Pms、 PpPs和PpSs+PsPs分别赋予0.7、 0.2和0.1的权重, 设定P波速度为6.3km/s; 地壳厚度的搜索范围为30~60km, 搜索间隔为0.1km, 平均波速比的搜索范围为0.5~2.0, 搜索间隔为0.001(图3)。 根据获取的地壳模型(地壳厚度及平均波速比), 以震中距为60° 、 震源深度为0的参考位置计算时差并对波形进行校正。 校正时, 在保持采样率不变的前提下, 仅对P至Pms段的波形进行拉伸或压缩(Chen et al., 2013a)。 对经过时差校正的接收函数按10° 的反方位角间隔进行叠加, 叠加后的接收函数波形按反方位角排列将呈现余弦曲线的特征, 如图 4所示(以CHS台为例)。

图 3 CHS台的接收函数H-Kappa搜索结果
蓝、 绿、 红色表示Pms波及其多次转换波PpPs和PpSs+PsPs 的叠加振幅; 2条白线相交的位置为振幅最大值
Fig. 3 H-Kappa analysis result of receiver functions at station CHS.

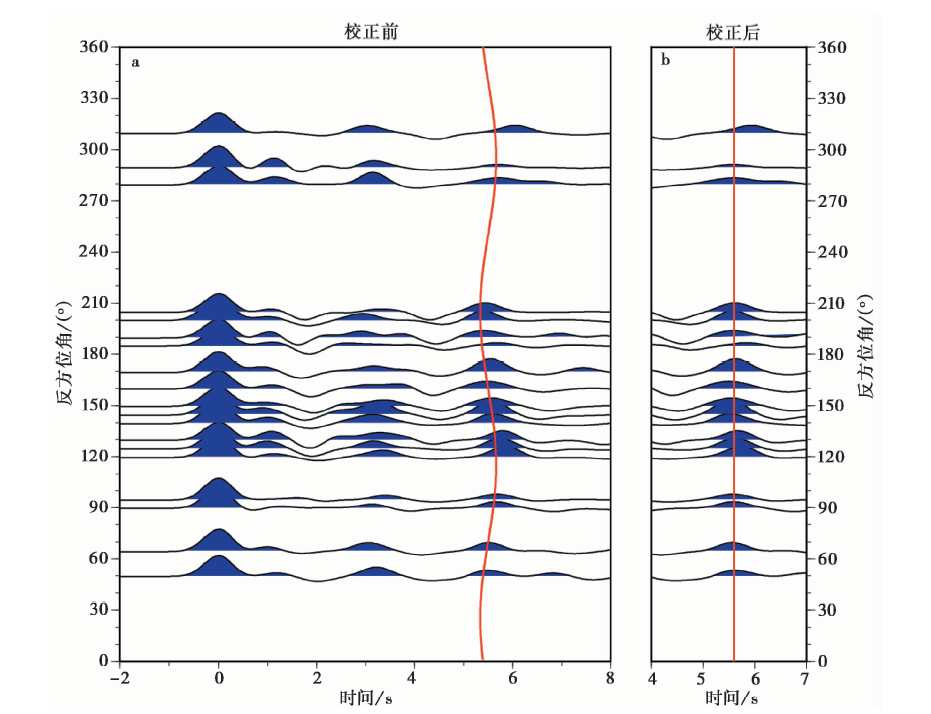
图 4 以10° 的反方位角间隔进行叠加后CHS台提取的接收函数波形(a)及各向异性校正后的Pms波形(b)Fig. 4 Receiver functions recorded at station CHS by binned in 10° azimuthal caps(a)and Pms phases after the crustal anisotropy correction(b).

参考Liu等(2012)提出的方法, 本文采用径向能量最大法获取地壳的各向异性参数。 当剪切波穿过具有水平对称轴的单层各向异性介质时, 其分裂的剪切波到时可表述为(Rumpker et al., 2014)

te=t0+Δt=t0-δt2cos[2(φ-φf)](1)

其中, Δ t为相对各向同性介质中Pms的到时, 即t0的方位时差; φ fδ t分别为描述各向异性介质的2个参数— — 快波偏振方向和快慢波时间延迟。 可采用余弦函数校正到时差, 通过计算一定窗口内校正前后Pms波叠加振幅的比值的最大值获取各向异性参数(Liu et al., 2012):

Ir={j=1NFrjt-δt2cos2(φj-φf)}max2{j=1NFrjt}max2, ttb, te(2)

其中, φ j为第j个接收函数的反方位角; N为接收函数总数, max表示Pms转换波在时间窗口 tb, te内振幅的最大值。 采用网格搜索法求取Ir的最大值, 其中φ f的搜索范围为0° ~180° , 搜索间隔为1° ; δ t的搜索范围为0~1.5s, 搜索间隔为0.01s。 仍以CHS台为例, 如图5所示, 当Ir达到最大值时, 对应的φ fδ t(φ f=26° , δ t=0.33s)即是所求解的地壳各向异性参数。 采用类似时差校正的方法, 再次利用获取的各向异性参数对各接收函数的波形进行校正。 图4b显示移除各向异性后Pms震相基本排列在一条直线上。

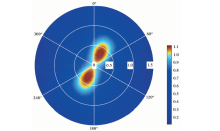
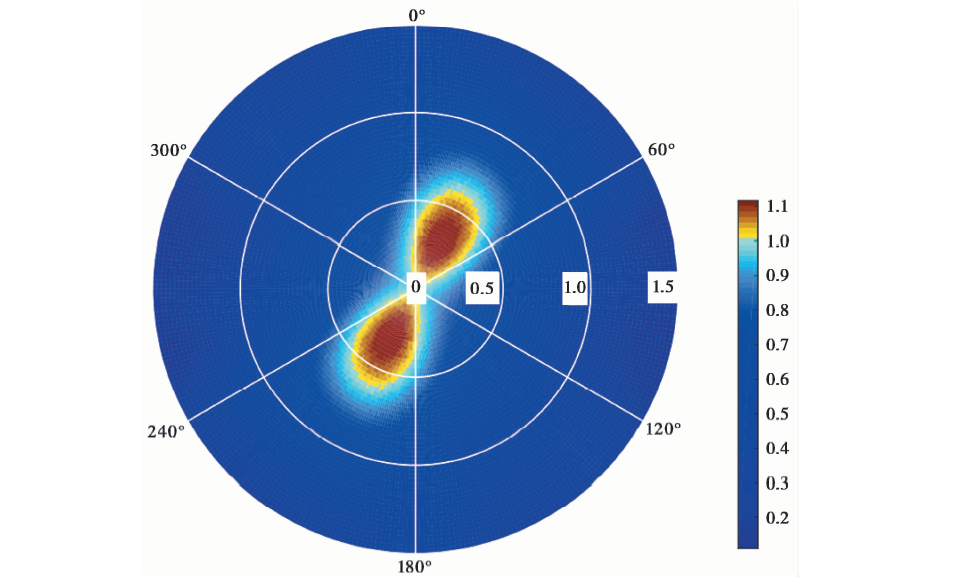
图5 网格搜索各向异性校正前后接收函数Pms叠加能量的比值分布图(CHS台)Fig. 5 Ratio diagram of stacked Pms energy before and after the anisotropy correction from the grid search(station CHS).

1.3 可靠性测试

由于Pms震相普遍存在能量较弱、 信噪比不高的缺点, 同时实际观测资料很难完整覆盖台站的所有方位, 因此本文采用bootstrap resampling方法测试了径向最大能量法在实际观测资料中应用的可靠性。 首先给定一维水平单层地壳模型(表1), 以5° 为间隔合成覆盖反方位角为0° ~360° 的72条接收函数, 并对所有接收函数加入10%的实际噪声。 然后, 从72条接收函数中随机挑选15条作为一组, 共挑选100组记录。 最后采用接收函数集分析方法获取各组的各向异性参数。

表1 合成接收函数采用的单层水平地壳模型 Table1 Single layered horizontal crust model used for the synthetic receiver function data

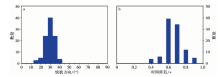
图 6 为这100组记录的测试结果, 其中快波方向主要分布在25° ~35° , 时间延迟主要分布在0.6~0.8s, 均较收敛于模型给定值附近, 两者的均方差分别为5.4和0.11。 因此可以认为, 本文采用的接收函数集分析方法适用于实际观测资料的处理。

图 6 Bootstrap resampling方法获取的各向异性快波方向(a)和时间延迟(b)分布图Fig. 6 Distributions of fast-wave direction(a)and delay time(b) from bootstrap resampling method.

此外, 为保证结果的可靠性, 采用以下标准对利用接收函数集分析方法获取的各台站结果进行筛选: 1)提取的接收函数Pms震相清晰, 具有较高的信噪比; 2)Pms震相按照反方位角排列呈现清晰的余弦曲线特征; 3)接收函数方位覆盖较好; 4)校正后的Pms震相到时排列在一条直线上。

2 结果
2.1 地壳厚度与平均泊松比

利用接收函数H-Kappa方法获取了重庆地区14个台站下方的地壳厚度与平均波速比, 通过计算进一步得到了地壳的平均泊松比(表2), 图 7为地壳厚度与泊松比分布图。 重庆地区的地壳厚度主要分布在40~50km, 其中重庆南部地区的地壳厚度基本小于45km, 而北部的大巴山推覆构造带处地壳增厚, 约50km, 地壳厚度在该地区显示出明显的变化梯度带(图7a)。 此外, 重庆西部华蓥山断裂带的地壳厚度小于其它地区, 其地壳厚度变化梯度(变化量约3km)比北部的大巴山构造带小。 总体而言, 重庆地区的地壳厚度呈现南部薄、 北部厚的分布特征, 与前人的研究结果比较一致(王小龙等, 2010)。

表2 本文获取的各台下方的地壳厚度、 平均VP/VS、 快波方向及时间延迟 Table2 Crustal thickness, average VP/VS ratio, fast wave polarization direction and delay time beneath each station determined by this study

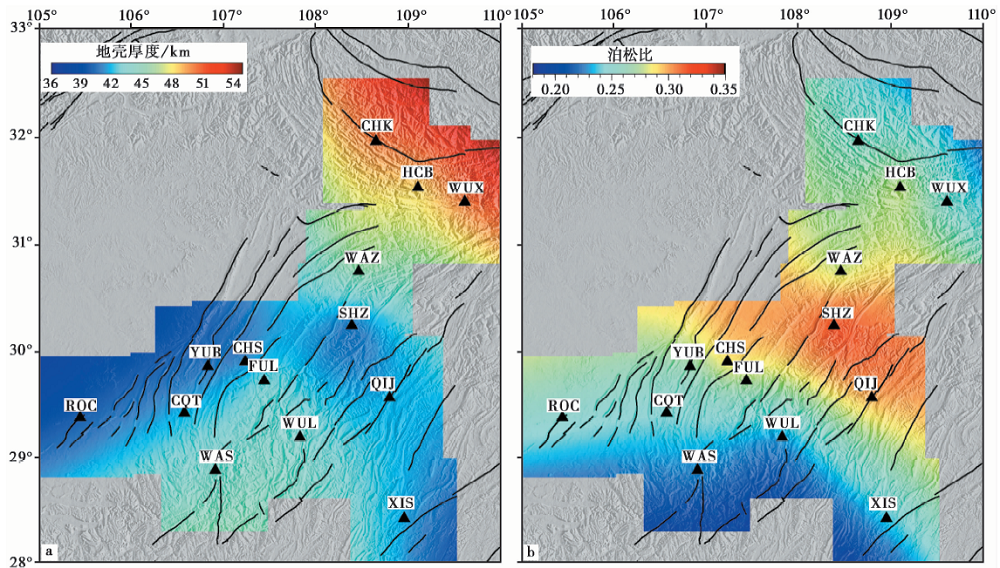
图 7 重庆地区地壳厚度(a)与地壳平均泊松比(b)分布图Fig. 7 Thickness(a) and average Poisson's ratio(b) of the crust beneath Chongqing region.

从地壳泊松比的分布(图7b)来看, 高泊松比主要集中在重庆中部地区, 近条带状沿NW-SE向展布。 泊松比值在重庆中部的SHZ台达到最大, 约0.31。 相对于中部地区, 重庆北部和南部地区的泊松比明显偏低, 其中北部3个台站的泊松比值为0.25~0.28, 而位于南部的3个台站具有更低的泊松比(约0.23), 显示出刚性的克拉通地壳特征。 因此, 重庆地区的地壳泊松比呈现中部高、 两侧低的分布特征, 与地壳厚度的分布特征有所差异。

2.2 地壳各向异性

本文最终共获取9个台站下方的地壳各向异性参数(表2), 地壳各向异性分布如图 8所示。 时间延迟为0.08~0.48s, 平均为0.22s。 在重庆中部的高泊松比(> 0.28)地区, CHS、 QIJ和WAZ台均具有较大的地壳时间延迟(> 0.3s)。 此外, 位于秦岭南缘的CHK台和重庆南部的WAS台, 其时间延迟均为0.08s, 表现出较弱的地壳各向异性。 在四川盆地边缘, ROC和CQT台的地壳泊松比值虽然都较低(约0.25), 但其时间延迟分别为0.25s和0.18s。 可见, 地壳时间延迟不完全受泊松比值的影响。

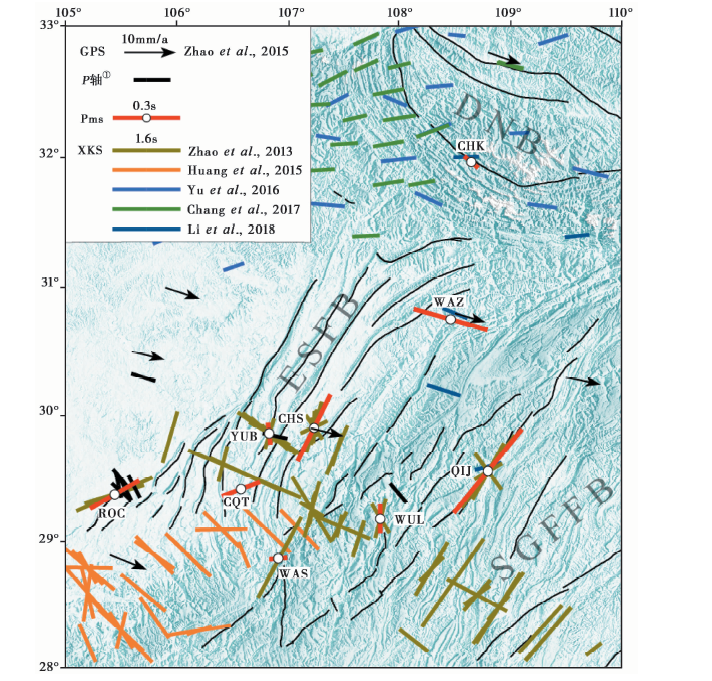
图 8 本文获取的地壳各向异性与GPS观测(依据国际地球参考框架, ITRF 2008)、 主压应力轴(重庆地震局, 2018, 重庆市2019年度地震趋势研究报告。)和XKS分裂测量获取的各向异性结果(https://splitting.gm.univ-montp.fr/。)的对比
DNB 大巴山推覆构造带; ESFB 川东褶皱带; SGFFB 川黔断褶带
Fig. 8 Comparison of crustal anisotropy determined in this study with GPS observation(ITRF 2008, International Terrestrial Reference Frame), P-axis and seismic anisotropy derived from XKS splitting measurements.

地壳快波方向由南向北发生明显变化。 在重庆南部, 快波方向呈现NNE-SSW和NEE-SWW 2个优势方向; 中部, WAZ台的快波方向转为NWW-SEE向; 而在重庆北部, 快波方向在CHK台又转为NW-SE向。 此外, 在ROC、 YUB、 CHS、 QIJ、 WUL和CHK等台站, 快波方向与断裂走向较一致; 而CQT、 WAS和WAZ 3个台站的快波方向与断裂走向存在明显差异。 由此可见, 在大部分地区, 快波方向与断裂走向具有较好的一致性。

3 讨论

地壳各向异性可由一系列机制导致, 大致可分为应力诱导各向异性和构造诱导各向异性(Boness et al., 2006)。 应力诱导各向异性会造成上地壳岩石的微裂隙张开或先前存在的宏观裂隙闭合, 导致快波方向与主压应力场方向平行(Crampin, 1991; Boness et al., 2004); 而构造诱导各向异性与断裂带构造、 沉积层理面或矿物排列相关, 表现为快波方向与构造面平行(Alford, 1986; Mueller, 1991; Sayers, 1994)。

GPS可测量不同块体间的相对运动, 提供地表形变的基本信息。 根据Zhao等(2015)的研究可知, 重庆地区的地表形变主要为NWW-SEE向。 震源机制解提供了区域主压应力场信息, 是研究深部构造应力场的基础资料(杨宜海等, 2015; 张致伟等, 2015; Yang et al., 2017, 2018; 祁玉萍等, 2018a, b)。 历史地震(4级以上)的震源机制解显示(重庆地震局, 2018, 重庆市2019年度地震趋势研究报告), 重庆地区的主压应力场方向总体呈NWW-SEE向, 与GPS测得的地表形变方向基本一致, 但与快波方向存在显著差异(图8)。 因此可以推断, 上地壳岩石裂隙的定向排列不是重庆地区地壳各向异性的主要原因。

XKS分裂测量是研究壳幔各向异性的常用方法。 近年来在重庆及周边地区开展的一系列壳幔各向异性研究表明(Zhao et al., 2013; Huang et al., 2015; Yu et al., 2016; Chang et al., 2017; Li et al., 2018), 重庆南部的岩石圈具有较强的各向异性, 其时间延迟普遍约1.6s; 而在北部的大巴山褶皱-冲断推覆构造一带, 时间延迟基本在0.6s以下, 各向异性强度不到南部的一半(图8)。 因此, 重庆的南部与北部具有不同的壳幔各向异性特征。 在四川盆地的东南边缘, Huang等(2015)研究发现壳幔快波方向主体呈NW-SE向, 垂直于断裂走向及附近造山带的方向, 认为各向异性可能受到青藏高原扩张的影响, 推测强各向异性与该地区的岩石圈厚度较大有关。 然而, 在川东褶皱带和川黔断褶带(其南、 北段以CHS至QIJ台一带为界, 以北为北段, 以南为南段), 其南段的壳幔快波方向以NE-SW为优势方向, 与区域构造走向和造山带方向基本一致(Zhao et al., 2013); 而北段台站的快波方向则转为NWW-SEE向(Li et al., 2018), 可见川东褶皱带和川黔断褶带的南、 北段也具有不同的岩石圈变形特征。

此外, 已有的XKS分裂测量研究在川东褶皱带和川黔断褶带获取的壳幔快波方向具有多个优势方向, 表明这些地区的岩石圈存在多层各向异性。 对比本文获取的地壳各向异性与XKS分裂测量结果, 相同台站的地壳快波方向与某些壳幔快波方向比较一致或接近, 而与另外一些存在明显差异, 由此推测川东褶皱带和川黔断褶带的地壳和岩石圈上地幔具有不同的快波方向, 地壳和岩石圈上地幔为解耦变形(图8)。 川东褶皱带至川黔断褶带在NWW-SEE向主压应力场的作用下, 地壳及整个岩石圈总体沿近NNE-SSW向伸展变形, 导致这些地区中下地壳及岩石圈上地幔的矿物定向排列, 为地壳乃至整个岩石圈各向异性的形成提供了动力学机制。 而重庆中部(川东褶皱带及川黔断褶带北段)的高泊松比地壳物质, 使该地区的地壳时间延迟普遍较大。

值得注意的是, CQT、 YUB和WAS台的地壳各向异性与XKS分裂测量的结果存在明显差异, 推测是由于这些台站处于盆山边界, 台站下方可能存在较为复杂的构造变形, 从而影响了地壳平均方位各向异性的快波方向, 此前的研究也发现了类似的现象(杨妍等, 2018)。 此外, WAS台附近不同走向的断裂分布及其构造活动可能还使局部应力复杂化, 导致台站下方平均各向异性强度偏小。

在大巴山推覆构造带的南部, 地质构造在城口一带呈向SW凸出的弧形展布, 至巫溪附近转为近EW向(董云鹏等, 2008)。 城口-房县断裂(图 1中的F6)是南大巴山的北边界, CHK台所处的中段为右旋走滑性质(李王鹏等, 2015)。 本文的研究显示, CHK台的地壳时间延迟仅有0.08s, 其快波方向与构造走向具有很好的一致性, 但是与XKS分裂测量结果差异较大。 已有的S波分裂研究发现, 主要断裂的剪切变形可使直接处于断裂上的台站的快波偏振方向与构造走向平行(Boness et al., 2006); 此外, 大量研究结果表明, 上地壳各向异性产生的时间延迟基本在0.2s以内(石玉涛等, 2013; 常利军等, 2015)。 CHK台的地壳各向异性符合以上特征, 因此推测其地壳各向异性主要受断裂带构造的影响。 需要指出的是, XKS分裂测量结果表明, 大巴山推覆构造带的壳幔各向异性自西向东存在明显变化(图8), 由于本文在该地区只获得1个台站的结果, 因此不排除CHK台以外地区的地壳变形特征存在差异的可能。

4 结论

本文搜集了重庆地区的宽频带地震资料, 利用接收函数Pms到时的方位变化特征首次分析获取了重庆地区的地壳各向异性结果, 同时利用接收函数H-Kappa方法对地壳厚度及泊松比的分布特征进行了研究。 结合大地测量、 构造应力场和壳幔各向异性等研究资料, 得出以下主要结论: 川东褶皱带和川黔断褶带的地壳和岩石圈上地幔为解耦变形, 其南、 北段也具有不同的变形特征; 盆山边界可能存在复杂的深部构造变形, 影响了局部地区的平均方位各向异性的快波方向, 不同走向的断裂活动还弱化了部分区域的平均各向异性强度; 大巴山推覆构造带南部的地壳变形可能主要受到断裂带构造的影响。

致谢 审稿专家对本文提出了建设性的修改意见; 本文中接收函数的提取采用了CPS程序包(Herrmann, 2013), 部分图件采用GMT(Wessel et al., 1995)绘制。 在此一并表示感谢!

参考文献
[1] 常利军, 丁志峰, 王椿镛. 2015. 2013年芦山 MS7. 0地震震源区横波分裂的变化特征[J]. 中国科学(D辑), 45(2): 161168.
CHANG Li-jun, DING Zhi-feng, WANG Chun-yong. 2015. Variations of shear wave splitting in the 2013 Lushan MS7. 0 earthquake region[J]. Science in China(Ser D), 45(2): 161168(in Chinese). [本文引用:1]
[2] 陈涛, 张锐, 黄世源. 2018. 三峡重庆地区形变场及构造应力场研究[J]. 大地测量与地球动力学, 38(2): 129132.
CHEN Tao, ZHANG Rui, HUANG Shi-yuan. 2018. Study on deformation field and tectonic stress field in Chongqing area of the Three Gorges[J]. Journal of Geodesy and Geodynamics, 38(2): 129132(in Chinese). [本文引用:1]
[3] 丁仁杰, 李克昌. 2004. 重庆地震研究 [M]. 北京: 地震出版社.
DING Ren-jie, LI Ke-chang. 2004. Research of Earthquakes in Chongqing [M]. Seismological Press, Beijing(in Chinese). [本文引用:1]
[4] 董云鹏, 查显峰, 付明庆, . 2008. 秦岭南缘大巴山褶皱-冲断推覆构造的特征[J]. 地质通报, 27(9): 14931508.
DONG Yun-peng, ZHA Xian-feng, FU Ming-qing, et al. 2008. Characteristics of the Dabashan fold-thrust nappe structure at the southern margin of the Qinling, China[J]. Geological Bulletin of China, 27(9): 14931508(in Chinese). [本文引用:1]
[5] 高原, 石玉涛, 陈安国. 2018. 青藏高原东缘地震各向异性、 应力及汶川地震影响[J]. 科学通报, 63(19): 19341948.
GAO Yuan, SHI Yu-tao, CHEN An-guo. 2018. Crustal seismic anisotropy and compressive stress in the eastern margin of the Tibetan plateau and the influence of the MS8. 0 Wenchuan earthquake[J]. Chinese Science Bulletin, 63(19): 19341948(in Chinese). [本文引用:1]
[6] 高原, 石玉涛, 梁维, . 2008. 剪切波分裂系统分析方法SAM(2007): 软件系统[J]. 中国地震, 24(4): 345353.
GAO Yuan, SHI Yu-tao, LIANG Wei, et al. 2008. Systematic analysis method of shear-wave splitting SAM(2007): Software system[J]. Earthquake Research in China, 24(4): 345353(in Chinese). [本文引用:1]
[7] 韩明, 李建有, 徐晓雅, . 2017. 按方位叠加接收函数分析青藏高原东南缘的地壳各向异性[J]. 地球物理学报, 60(12): 45374556.
HAN Ming, LI Jian-you, XU Xiao-ya, et al. 2017. Analysis for crustal anisotropy beneath the southeastern margin of Tibet by stacking azimuthal receiver functions[J]. Chinese Journal of Geophysics, 60(12): 45374556(in Chinese). [本文引用:1]
[8] 胡建平, 赵军龙, 汪文秉, . 2005. 三峡重庆库区深部地球物理特征与断裂构造[J]. 地球科学与环境学报, 27(3): 4954.
HU Jian-ping, ZHAO Jun-long, WANG Wen-bing, et al. 2005. Relation of deep geophysics fields and rupture construct in Yangtse Gorges Chongqing Reservoir area[J]. Journal of Earth Sciences and Environment, 27(3): 4954(in Chinese). [本文引用:1]
[9] 李峰, 张效亮, 刘华国. 2013. 重庆市主要构造地震危险性评价[J]. 地震地质, 35(3): 518531. doi: DOI: 103969/j. issn. 0253-4967. 2013. 03. 006.
LI Feng, ZHANG Xiao-liang, LIU Hua-guo. 2013. Seismic hazard analysis of the main faults in Chongqing urban area[J]. Seismology and Geology, 35(3): 518531(in Chinese). [本文引用:1]
[10] 李王鹏, 刘少峰, 钱涛. 2015. 城口-房县断裂带的构造变形分析[J]. 大地构造与成矿学, 39(5): 755768.
LI Wang-peng, LIU Shao-feng, QIAN Tao. 2015. Analysis of structural deformation of the Chengkou-Fangxian fault zone[J]. Geotectonica et Metallogenia, 39(5): 755768(in Chinese). [本文引用:1]
[11] 祁玉萍, 龙锋, 肖本夫, . 2018a. 2017年九寨沟7. 0 级地震序列震源机制解和构造应力场特征[J]. 地球学报, 39(5): 622634.
QI Yu-ping, LONG Feng, XIAO Ben-fu, et al. 2018a. Focal mechanism solutions and tectonic stress field characteristics of the 2017 MS7. 0 Jiuzhaigou earthquake sequence[J]. Acta Geoscientica Sinica, 39(5): 622634(in Chinese). [本文引用:1]
[12] 祁玉萍, 张致伟, 龙锋, . 2018b. 大凉山次级块体及邻区震源机制解与区域应力场特征分析[J]. 地震地质, 40(2): 377395. doi: DOI: 103969/j. issn. 0253-4967. 2018. 02. 007.
QI Yu-ping, ZHANG Zhi-wei, LONG Feng, et al. 2018b. Earthquake focal mechanisms in the Daliangshan sub-block and adjacent areas and characteristics of the regional stress field[J]. Seismology and Geology, 40(2): 377395(in Chinese). [本文引用:1]
[13] 石玉涛, 高原, 张永久, . 2013. 松潘-甘孜地块东部、 川滇地块北部与四川盆地西部的地壳剪切波分裂[J]. 地球物理学报, 56(2): 481494.
SHI Yu-tao, GAO Yuan, ZHANG Yong-jiu, et al. 2013. Shear-wave splitting in the crust in eastern Songpan-Garzê block, Sichuan-Yunnan block and western Sichuan Basin[J]. Chinese Journal of Geophysics, 56(2): 481494(in Chinese). [本文引用:1]
[14] 王小龙, 倪四道, 刘渊源, . 2010. 利用远震接收函数分析三峡库区重庆段地壳厚度变化[J]. 地震地质, 32(4): 543551. doi: DOI: 103969/j. issn. 0253-4967. 201004. 002.
WANG Xiao-long, NI Si-dao, LIU Yuan-yuan, et al. 2010. Study of crustal thickness variation in Chongqing section of Three Gorges reservoir area from teleseismic receiver function method[J]. Seismology and Geology, 32(4): 543551(in Chinese). [本文引用:1]
[15] 吴晶, 太龄雪, 高原, . 2009. 辽宁岫岩 MS5. 9地震前应力积累的讨论[J]. 地震, 29(3): 3744.
WU Jing, TAI Ling-xue, GAO Yuan, et al. 2009. Discussions on stress accumulation before the 1999 Xiuyan MS5. 9 earthquake in Liaoning, China[J]. Earthquake, 29(3): 3744(in Chinese). [本文引用:1]
[16] 杨妍, 姚华建, 张萍, . 2018. 用接收函数方法研究华北克拉通中部造山带及其邻域地壳方位各向异性[J]. 中国科学(D辑), 48(7): 912923.
YANG Yan, YAO Hua-jian, ZHANG Ping, et al. 2018. Crustal azimuthal anisotropy in the trans-North China orogen and adjacent regions from receiver functions[J]. Science in China(Ser D), 48(7): 912923(in Chinese). [本文引用:1]
[17] 杨宜海, 梁春涛, 苏金蓉. 2015. 用接收函数建立区域模型的震源机制反演及其在芦山地震序列研究中的应用[J]. 地球物理学报, 58(10): 35833600.
YANG Yi-hai, LIANG Chun-tao, SU Jin-rong. 2015. Focal mechanism inversion based on regional model inverted from receiver function and its application to the Lushan earthquake sequence[J]. Chinese Journal of Geophysics, 58(10): 35833600(in Chinese). [本文引用:1]
[18] 易桂喜, 姚华建, 朱介寿, . 2010. 用Rayleigh面波方位各向异性研究中国大陆岩石圈形变特征[J]. 地球物理学报, 53(2): 256268.
YI Gui-xi, YAO Hua-jian, ZHU Jie-shou, et al. 2010. Lithospheric deformation of continental China from Rayleigh wave azimuthal anisotropy[J]. Chinese Journal of Geophysics, 53(2): 256268(in Chinese). [本文引用:1]
[19] 张致伟, 周龙泉, 龙锋, . 2015. 汶川8. 0和芦山7. 0级地震序列应力场时空特征[J]. 地震地质, 37(3): 804817. doi: DOI: 103969/j. issn. 0253-4967. 2015. 03. 011.
ZHANG Zhi-wei, ZHOU Long-quan, LONG Feng, et al. 2015. Spatial and temporal characteristic of stress field for Wenchuan MS8. 0 and Lushan MS7. 0 earthquake sequence[J]. Seismology and Geology, 37(3): 804817(in Chinese). [本文引用:1]
[20] Alford R M. 1986. Shear data in the presence of azimuthal anisotropy[C]∥Annual International Meeting of the Society of Exploration Geophysicists, Expand ed Abstracts, 56: 476479. [本文引用:1]
[21] Boness N L, Zoback M D. 2004. Stress-induced seismic velocity anisotropy and physical properties in the SAFOD Pilot Hole in Parkfield, CA[J]. Geophysical Research Letters, 31(15): L15S17. [本文引用:1]
[22] Boness N L, Zoback M D. 2006. Mapping stress and structurally controlled crustal shear velocity anisotropy in California[J]. Geology, 34(10): 825828. [本文引用:2]
[23] Chang L J, Ding Z F, Wang C Y, et al. 2017. Vertical coherence of deformation in lithosphere in the NE margin of the Tibetan plateau using GPS and shear-wave splitting data[J]. Tectonophysics, 699: 93101. [本文引用:2]
[24] Chen Y, Niu F. 2013a. Ray-parameter based stacking and enhanced pre-conditioning for stable inversion of receiver function data[J]. Geophysical Journal International, 194(3): 16821700. [本文引用:2]
[25] Chen Y, Zhang Z J, Sun C Q, et al. 2013b. Crustal anisotropy from Moho converted Ps wave splitting analysis and geodynamic implications beneath the eastern margin of Tibet and surrounding regions[J]. Gondwana Research, 24(3-4): 946957. [本文引用:1]
[26] Crampin S. 1991. Wave propagation through fluid-filled inclusions of various shapes: Interpretation of extensive-dilatancy anisotropy[J]. Geophysical Journal International, 104(3): 611623. [本文引用:1]
[27] Gao Y, Wu J, Cai J A, et al. 2009. Shear-wave splitting in the southeast of Cathaysia block, South China[J]. Journal of Seismology, 13(2): 267275. [本文引用:1]
[28] Gao Y, Wu J, Fukao Y, et al. 2011. Shear-wave splitting in the crust in North China: Stress, faults and tectonic implications[J]. Geophysical Journal International, 187(2): 642654. [本文引用:1]
[29] Herrmann R B. 2013. Computer programs in seismology: An evolving tool for instruction and research[J]. Seismological Research Letters, 84(6): 10811088. [本文引用:2]
[30] Hess R A, Macdowall R J. 2003. Scattering of interplanetary radio waves at kilometric wavelengths[J]. Journal of Geophysical Research: Space Physics, 108(A8): 1313. [本文引用:1]
[31] Huang Z, Wang L, Xu M, et al. 2015. Teleseismic shear-wave splitting in SE Tibet: Insight into complex crust and upper-mantle deformation[J]. Earth and Planetary Science Letters, 432: 354362. [本文引用:3]
[32] Kong F S, Wu J, Liu K H, et al. 2016. Crustal anisotropy and ductile flow beneath the eastern Tibetan plateau and adjacent areas[J]. Earth and Planetary Science Letters, 442: 7279. [本文引用:1]
[33] Li H Y, Song X D, Lu Q T, et al. 2018. Seismic imaging of lithosphere structure and upper mantle deformation beneath east-central China and their tectonic implications[J]. Journal of Geophysical Research: Solid Earth, 123(4): 28562870. [本文引用:3]
[34] Liang C T, Song X D, Huang J L. 2004. Tomographic inversion of Pn travel times in China[J]. Journal of Geophysical Research, 109(B11): B11304. [本文引用:1]
[35] Liu H, Niu F. 2012. Estimating crustal seismic anisotropy with a joint analysis of radial and transverse receiver function data[J]. Geophysical Journal International, 188(1): 144164. [本文引用:3]
[36] Mcnamara D E, Owens T J. 1993. Azimuthal shear wave velocity anisotropy in the Basin and Range Province using Moho Ps converted phases[J]. Journal of Geophysical Research: Solid Earth, 98(B7): 1200312017. [本文引用:1]
[37] Mcnamara D E, Walter W R, Owens T J, et al. 1997. Upper mantle velocity structure beneath the Tibetan plateau from Pn travel time tomography[J]. Journal of Geophysical Research: Solid Earth, 102(B1): 493505. [本文引用:1]
[38] Montagner J P, Nataf H C. 1986. A simple method for inverting the azimuthal anisotropy of surface waves[J]. Journal of Geophysical Research: Solid Earth, 91(B1): 511520. [本文引用:1]
[39] Mueller M C. 1991. Prediction of lateral variability in fracture intensity using multicomponent shear-wave seismic as a precursor to horizontal drilling[J]. Geophysical Journal International, 107(3): 409415. [本文引用:1]
[40] Pei S P, Zhao J, Sun Y, et al. 2007. Upper mantle seismic velocities and anisotropy in China determined through Pn and Sn tomography[J]. Journal of Geophysical Research: Solid Earth, 112(B5): B05312. [本文引用:1]
[41] Rumpker G, Kaviani A, Latifi K. 2014. Ps-splitting analysis for multilayered anisotropic media by azimuthal stacking and layer stripping[J]. Geophysical Journal International, 199(1): 146163. [本文引用:1]
[42] Sayers C M. 1994. The elastic anisotropy of shales[J]. Journal of Geophysical Research, 99(B1): 767774. [本文引用:1]
[43] Silver P G. 1996. Seismic anisotropy beneath the continents: Probing the depths of geology[J]. Annual Review of Earth and Planetary Sciences, 24(1): 385432. [本文引用:1]
[44] Silver P G, Chan W W. 1991. Shear wave splitting and subcontinental mantle deformation[J]. Journal of Geophysical Research: Solid Earth, 96(B10): 1642916454. [本文引用:1]
[45] Simons J P, Hilst R D V D, Montagner F J, et al. 2002. Multimode Rayleigh wave inversion for heterogeneity and azimuthal anisotropy of the Australian upper mantle[J]. Geophysical Journal International, 151(3): 738754. [本文引用:1]
[46] Sun Y, Liu J, Zhou K, et al. 2015. Crustal structure and deformation under the Longmenshan and its surroundings revealed by receiver function data[J]. Physics of the Earth and Planetary Interiors, 244: 1122. [本文引用:2]
[47] Sun Y, Niu F, Liu H, et al. 2012. Crustal structure and deformation of the SE Tibetan plateau revealed by receiver function data[J]. Earth and Planetary Science Letter, 349-350(4): 186197. [本文引用:2]
[48] Wang Q, Niu F L, Gao Y, et al. 2016. Crustal structure and deformation beneath the NE margin of the Tibetan plateau constrained by teleseismic receiver function data[J]. Geophysical Journal International, 204(1): 167179. [本文引用:2]
[49] Wessel P, Smith W H F. 1995. New version of the generic mapping tools[J]. Eos, Transactions American Geophysical Union, 76(33): 329. [本文引用:1]
[50] Wu J, Zhang Z J, Kong F S, et al. 2015. Complex seismic anisotropy beneath western Tibet and its geodynamic implications[J]. Earth and Planetary Science Letters, 413: 167175. [本文引用:1]
[51] Yang Y H, Liang C T, Fang L, et al. 2018. A comprehensive analysis on the stress field and seismic anisotropy in eastern Tibet[J]. Tectonics, 37(6): 16481657. [本文引用:1]
[52] Yang Y H, Liang C T, Li Z Q, et al. 2017. Stress distribution near the seismic gap between Wenchuan and Lushan earthquakes[J]. Pure and Applied Geophysics, 174(6): 22572267. [本文引用:1]
[53] Yao H, Van D H R D, Montagner J. 2010. Heterogeneity and anisotropy of the lithosphere of SE Tibet from surface wave array tomography[J]. Journal of Geophysical Research: Solid Earth, 115(B12): B12307. [本文引用:1]
[54] Yu Y, Chen Y J. 2016. Seismic anisotropy beneath the southern Ordos block and the Qinling-Dabieorogen, China: Eastward Tibetan asthenospheric flow around the southern Ordos[J]. Earth and Planetary Science Letter, 455: 16. [本文引用:2]
[55] Zhao B, Huang Y, Zhang C H, et al. 2015. Crustal deformation on the Chinese mainland during 1998—2004 based on GPS data[J]. Geodesy and Geodynamics, 6(1): 715. [本文引用:1]
[56] Zhao L, Zheng T, Lu G. 2013. Distinct upper mantle deformation of cratons in response to subduction: Constraints from SKS wave splitting measurements in eastern China[J]. Gondwana Research, 23(1): 3953. [本文引用:3]
[57] Zheng T, Ding Z F, Ning J Y, et al. 2018. Crustal azimuthal anisotropy beneath the southeastern Tibetan plateau and its geodynamic implications[J]. Journal of Geophysical Research: Solid Earth, 123(11): 97339749. doi: DOI:10.1029/2018JB015995. [本文引用:1]
[58] Zhu L, Kanamori H. 2000. Moho depth variation in southern California from teleseismic receiver functions[J]. Journal of Geophysical Research: Solid Earth, 105(B2): 29692980. [本文引用:1]