


喜马拉雅东构造结主要断裂的地震矩亏损与危险性评估
[田镇1)  , 杨志强
, 杨志强1), * , 王师迪2) ]
, 杨志强, 王师迪|
|


〔作者简介〕 田镇, 男, 1990年生, 2016年于长安大学获大地测量学与测量工程专业硕士学位, 长安大学大地测量学与测量工程专业在读博士研究生, 主要从事地壳形变监测与地球动力学研究, E-mail: zhen.tian1990@hotmail.com。
喜马拉雅东构造结是研究青藏高原构造演化的关键地区, 地震活动频繁。 文中基于地震矩平衡理论, 利用GPS资料与历史地震目录分析东构造结地区的地震矩亏损, 继而评估该区未来的地震活动。 结果表明: 研究区总体的地震矩累积率高于青藏高原的平均水平, 近200a内的累积总量达(1.15±0.03)×1022N·m, 明显高于地震矩的释放总量(5.50±2.54)×1021N·m。 而地震矩亏损量最高的主前缘断裂不丹段具备发生 MW8.1以上地震的可能, 那加山断裂及嘉黎断裂通麦段则不排除未来发生震级大于 MW7.5与 MW7.3地震的可能, 其余断层发生强震( MW7.1以上)的概率相对较低。 而对于米什米断层与主前缘断层东段, 虽然察隅 MS8.6地震发生于此, 但这2条断层未来的地震危险性仍不容忽视, 且无论察隅地震发生于哪条断层, 其复发周期均为660~1 030a。
The Eastern Himalayan Syntaxis(EHS)is a critical region for studying the tectonic evolution of Tibetan plateau, which was affected by the intense seismic activities. We use the theory of moment balance, GPS velocities and historical earthquake records to analyze the moment deficits in the EHS, assess the future seismicity and further to predict the recurrence interval of the 1950 Chayu MS8.6 earthquake.
We first collected multiple sets of GPS velocity fields and combined them to reduce the systematic bias. Then a micro-blocks model, constrained by GPS velocities, was built by TDEFNODE software to simultaneously invert the fault elastic strain parameters and rigid motion parameters based on the grid research and simulated annealing methods. The long-term slip rates on the faults were further estimated by the differential motions between the neighboring blocks. The results show that the nearly NS dextral strike-slip faults, Naga Fault and Sagaing Fault, slip with the average rates of ~10.6 and ~16.6mm/a, which are consistent with the lateral extrusion in the Tibetan plateau. However, the Main Frontal Thrust shows a distinguished sinistral strike-slip feature(6~10mm/a), possibly caused by the NNE pushing from the Indian plate to the Eurasian plate. On the other hand, because the EHS is located in frontal area of the collision between Indian and Eurasian plate, most faults show thrusting feature. The most obvious one is the Mishimi Fault, slipping with the rate of 23.3mm/a, implying that the convergence rate of the Indo-European plates is largely absorbed by this fault. The moment accumulation rate in the EHS is higher than the average rate in the Tibetan plateau and the total moment accumulation is(1.15±0.03)×1022 N·m in the last 200a. About 59.7% and 21.6% of the moment accumulation rate concentrate on the Main Frontal Thrust and Mishimi Fault.
Second, we selected the earthquake records occurring on the upper crust since 1800AD to analyze the moment release in the EHS based on the data from the International Seismological Centre, United States Geological Survey, and catalogue of historical strong earthquakes in China and some other previous studies. In addition, the Global Centroid Moment Tensor Project and linear regression method were adopted to estimate the relationship between body wave magnitude( mb), surface wave magnitude( MS), local magnitude( ML)and the moment( M0). Then we further estimated the total fault moment release in the EHS, (5.50±2.54)×1021N·m, which is significantly lower than the total moment accumulation. About 79.2% of the moment release occurs on the Mishimi Fault, this is because the 1950 MS8.6 Chayu earthquake is assumed to have ruptured on this fault.
Finally, the present-day moment deficits on the faults in the EHS were calculated by the differences between the moment accumulation and release, which represent the possibility to produce earthquakes on the upper crust faults in the future. The largest moment deficit was found on the Main Frontal Thrust near Bhutan, which is able to rupture with MW8.1+. Similarly, earthquakes with MW7.5+ and MW7.3+ have the potentials to occur on the Naga Fault and the Jiali Fault near Tongmai. However, the future earthquake scales may be less than MW7.1 on the remaining faults. Moderate minor earthquakes are the main activity in the area near the Yarlung Zangbo Suture zone and the southern Sagaing Fault. Although the Chayu MS8.6 earthquake occurred near the Mishimi Fault and the eastern MFT, the earthquake risk on those two faults cannot be ignored. Meanwhile, no matter which fault produced the Chayu earthquake, its recurrence will likely be 660a to 1 030a.
印度板块向欧亚板块的不断俯冲与推挤, 造就了世界上海拔最高的地区— — 喜马拉雅造山带(Tapponnier et al., 1982; Bilham et al., 1997; Harrison et al., 1997; Feldl et al., 2006)。 而在该造山带的东、 西两端, 其山脉、 水系的走向突然发生约90° 的转折, 隆升高山与深切峡谷相对应, 因而被分别称为东、 西构造结(康国发等, 2013; 程成等, 2017)。 喜马拉雅东构造结位于喜马拉雅山脉的东端, 主要由拉萨地块、 喜马拉雅地块、 缅甸地块和印度板块构成, 是青藏高原东南缘构造最复杂、 地形变化最剧烈的地区(唐方头等, 2010; 宋键等, 2011; Gupta et al., 2015)。
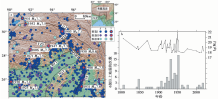
由于该区复杂、 强烈的构造变形, 自1800AD以来发生过多次7级以上地震(图1a), 主要包括1806年、 1871年、 1947年发生在喜马拉雅逆冲断裂上的MW7.7、 MW7.5与MW7.3地震, 1908年和1931年的缅甸MW7.5、 MW7.6地震以及1923年和1930年2次孟加拉MW7.1地震, 在1950年更是发生了察隅MS8.6特大地震, 随后接连在西藏地区发生了1951年MW7.7与1952年MW7.5地震。 在近50a内, 区内主要以中小地震为主。
 | 图1 a 东构造结地区的构造背景与历史地震(M≥ 4); b 6级以上地震的次数及其释放的地震矩(M0) 数据 I: 来自USGS、 ISC; 数据 Ⅱ : 来自国家地震局震害防御司(1995); 数据 Ⅲ : 来自其它文献资料(见2.1节)。 黑色实线为主要断裂带在地表的展布(Gupta et al., 2015)。 MFT 喜马拉雅主前缘断层; YZS 雅鲁藏布江缝合带; JLF 嘉黎断裂; MTF 墨脱断裂; MSMT 米什米断裂; NGF 那加山断裂; SF 实皆断裂Fig. 1 a Tectonic setting and seismicity of the Eastern Himalayan Syntaxis(M≥ 4); b The number and the moment(M0)time series of the earthquakes(M> 6). |
其中, 1950年发生的察隅MS8.6地震是喜马拉雅地区有史以来记录到的最大地震(Devachandra et al., 2014; 尹凤玲等, 2018)。 那么该区未来是否还存在发生强震的可能?察隅地震的复发周期又如何评估?地震矩平衡理论为解决上述问题提供了新的思路。 在震间, 断层面的上地壳部分因闭锁而导致能量(地震矩)不断积累, 当累积的地震矩超过了岩石的破裂强度, 就会以地震的形式释放。 若释放量小于累积量, 便会产生地震矩亏损, 进一步增加未来的地震危险性(Bird et al., 2004; Jenny et al., 2004; McCaffrey et al., 2007; Wang et al., 2011)。
地震矩平衡理论在很多地区得以广泛应用: Meade等(2005)通过分析南加州地区的地震矩亏损分布, 指出该地区未来存在发生MW8地震的可能。 Wang等(2010)则认为在2008年汶川地震之前, 龙门山断裂带较高的地震矩亏损能够很好地解释前震活动并不强烈的 “ 异常” 现象。 D’ Agostino(2014)指出意大利地区的地震矩累积量略大于释放量, 在未来可能发生MW6.5以上地震。 Chousianitis等(2015)则通过对比希腊地区地震矩的累积与释放, 发现科林斯湾附近存在长期的无震蠕滑。 然而, 对于地壳变形复杂且剧烈的东构造结地区, 其现今的地震矩分布状况还未见相关研究报道。 因此, 本文将基于上述理论, 利用GPS资料与历史地震目录分析东构造结地区的地震矩亏损状态, 继而评估未来的地震活动, 并进一步讨论察隅MS8.6地震的复发周期。
针对东构造结地区的断层展布, 中国地震局及其它机构依托 “ 中国地壳运动观测网络(CMONOC I)” 和 “ 中国大陆构造环境监测网络(CMONOC II)” 工程在该区布设了多期GPS站点, 实现了对青藏高原东南部变形的有效监测(Gan et al., 2007; Liang et al., 2013)。 Zheng等(2017)采用PANDA软件处理了CMONOC I、 CMONOC II工程的最新观测数据(1991— 2005年), 并融合了全球2 263个GPS站点的数据(Kreemer et al., 2014)给出了中国、 尼泊尔及印度地区较为完备的GPS速度场资料(图2)。 同时, 唐方头等(2010)在CMONOC I、 CMONOC II工程的基础上, 在该区又新建了12个GPS观测点, 较好地约束了中国境内主要断裂不同构造部位的变形特征(图2)。
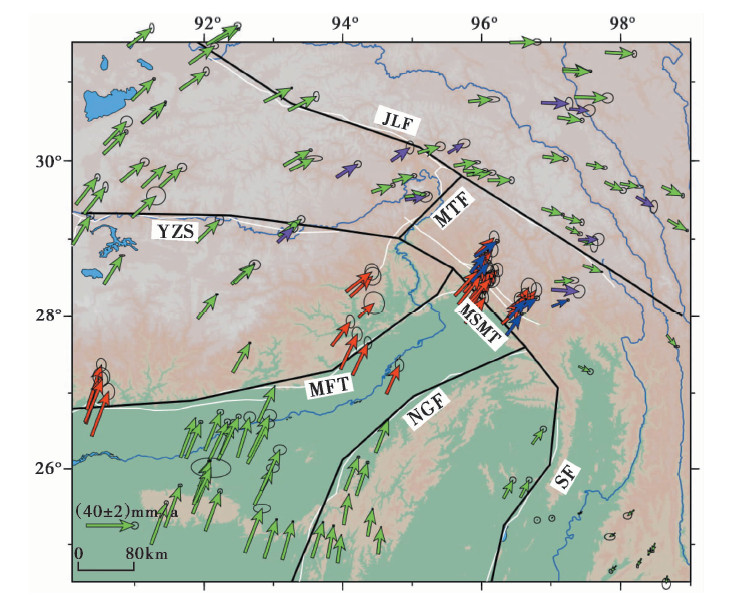 | 图2 GPS速度场分布(欧亚基准, 误差椭圆代表90%置信区间) 不同颜色的箭头代表不同来源的速度场资料: 紫色来自唐方头等(2010); 蓝色来自Devachandra等(2014); 红色来自Gupta等(2015); 绿色来自Zheng等(2017)。 速度场的比例一致。 白色实线代表研究区内主要断裂的展布, 黑色实线代表微块体模型的边界Fig. 2 GPS velocities in the study area(relative to the stable Eurasia, error ellipses represent the 90% confidence level). |
在印度及缅甸等地区, Devachandra等(2014)于2007年起在米什米断层(Mishmi Thrust)两侧布设了10个GPS测点, 并进行了多期观测, 填补了东构造结前缘地区地表形变资料的空白。 同时, 为监测阿萨姆地区及印度东北部长期的地壳变形, 印度地质调查局也于2006— 2013年建立了跨喜马拉雅山的多条GPS剖面, 共计30个站点(Gupta et al., 2015)。 上述GPS形变资料如图 2所示。
由于数据处理软件、 改正模型及参考框架不一致, 不同的GPS资料在相同点位的速度值也会有所差异(Bettinelli et al., 2006; Tian et al., 2019)。 因此, 在分析该区的地壳变形之前首先要对不同来源的GPS速度场进行融合, 以消除系统性偏差。 而不同套的GPS速度场差异可以用一刚性的整体旋转(欧拉矢量)来描述, 因此可首先利用公共站点的速度差异计算出不同速度场之间的整体旋转矢量, 再借助这一旋转矢量完成其余站点的速度转化(Ge et al., 2015; 占伟等, 2015; Tian et al., 2019)。
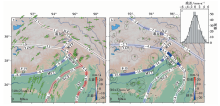
融合后, 公共站点的速度残差均小于2mm/a, 表明融合结果较好, 满足震间变形研究的需求, 且可以忽略时间尺度不一致而产生的差异(Gan et al., 2007; 占伟等, 2015)。 融合后的速度场结果如图3a所示, 参考框架为IGS08(The IGS realization of ITRF2008), 并扣除相对于欧亚板块的整体运动。 自西向东, 速度场的EW向分量逐渐增大, SN向分量逐渐减小, 地壳运动出现明显的顺时针旋转, 表明该区自西向东由印-欧板块的相互推挤转化为高原的横向挤出。
 | 图3 融合后的速度场分布(欧亚基准)与断层现今的走向运动速率(a); 微块体模型的残差分布与断层的倾向运动速率(误差椭圆代表90%置信区间)(b); 残差统计直方图(c)Fig. 3 Combined GPS velocities(relative to the stable Eurasia)and strike-slip rates on the major faults(a); Residuals of the micro-block model and the dip-slip rates(error ellipses represent the 90%confidence level)(b); Histogram of residuals(c). |
震间的地表变形是块体整体性旋转、 断层弹性变形及块体内部永久性应变叠加的结果, 而对于微块体模型, 块体内部的应变往往可忽略不计(McCaffrey et al., 2007; Loveless et al., 2011)。 因此, 在一定的区域内可将GPS速度场作为约束条件构建微块体模型, 对断层的弹性应变参数及块体的刚性运动参数一并进行反演, 再根据相邻块体的差异性运动估算断层长期的滑动速率。 本文采用的TDEFNODE软件即基于上述思路, 利用网格搜索和模拟退火算法进行多次迭代以求取参数的最佳估值, 进而评估研究区内主要断层的运动状态。
微块体的划分主要基于前人提出的模型(Loveless et al., 2011; Devachandra et al., 2014; Vernant et al., 2014; Gupta et al., 2015)、 地质调查结果(邓起东等, 2003)与历史地震的分布(图1a)。 与前人的块体模型相比, 本文考虑了更多活动断层, 主要包括主喜马拉雅前缘断裂(MFT)、 雅鲁藏布江缝合带(YZS)、 嘉黎断裂(JLF)、 墨脱断裂(MTF)、 米什米断裂(MSMT)、 那加山断裂(NGF)与实皆断裂(SF)在内的7条断裂带, 如图 2所示。
研究表明, 印度板块向欧亚板块俯冲的拆离带— — 主喜马拉雅逆冲断裂出露于喜马拉雅山脚的部分称为主前缘断层(MFT), 其进一步向N以低角度(约10° )延伸并次生出主边界断层、 主中央断层等多条逆断层, 而在深部则逐渐变为近水平的延性剪切带(Bettinelli et al., 2006; 马晓静等, 2011; Ader et al., 2012; Ge et al., 2015)。 为简化模型, 本文以主前缘断层代表整个喜马拉雅逆冲断裂带, 并将主前缘断层和米什米断层的倾角设置为10° (Wang et al., 2011; Ader et al., 2012; Devachandra et al., 2014), 将那加山断层的倾角设置为30° (Vernant et al., 2014), 其余断层均视为直立断层(Wang et al., 2017; Tian et al., 2019)。 同时, 本文忽略了主断裂的分支断层, 因此得到的滑动速率代表断层整体的运动状态。
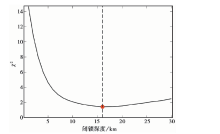
在微块体模型中, 断层的闭锁深度对反演结果影响较大(Loveless et al., 2011; Tian et al., 2019)。 研究表明, 青藏高原地区断层的平均闭锁深度为15~20km(Wang et al., 2010)。 本文通过χ 2检验求取断层的最优闭锁深度:
其中, N为GPS测站数,
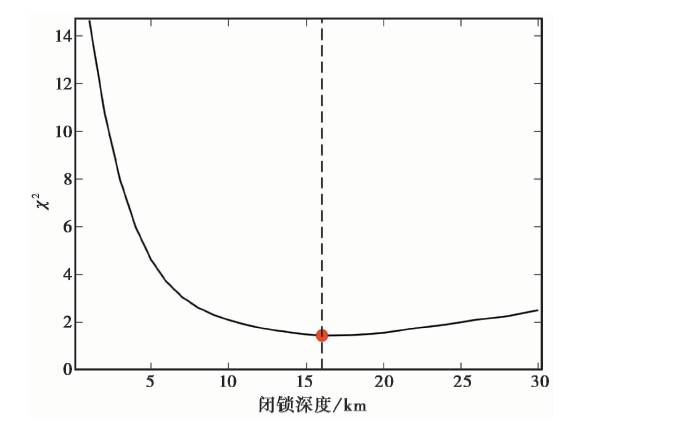 | 图 4 反演残差 χ 2与闭锁深度的关系图Fig. 4 The relation between residuals and locking depths. |
最后, 为了减弱GPS速度误差的影响, 我们移除了速率误差> 4mm/a的站点, 将剩余的144个GPS速度值作为上述微块体模型的约束值, 利用TDEFNODE软件估算断层的滑动速率。 反演的残差结果如图3b所示, 可以看出大部分测站的残差值都在速率误差允许的范围内。 在米什米断层附近的速率残差略为明显, 主要原因是该区域测站的观测期数较少, GPS速率本身的误差较大。 另一方面, 残差的统计直方图(图3c)也趋于正态分布, 65%的测站残差值均小于速率误差的平均值2mm/a, 表明模型的预测值与观测值符合较好, 震间的地表变形得到了较好描述。
图 3为研究区断层的滑动速率分布。 由图3a可以看出, 东构造结地区的走滑断层大都以右旋为主, 这与高原的横向挤出特性一致。 近SN向的那加山断裂和实皆断裂的平均右旋走滑速率甚至约达10.6mm/a和16.6mm/a, 与宋键等(2011)(那加山断裂, 10~11mm/a)和Krishna等(2000)(实皆断裂, 16mm/a)的研究结果一致。 而近EW向的雅鲁藏布江缝合带、 NNW向的嘉黎断裂则表现出相对较弱的右旋滑动。 Tian等(2019)与宋键等(2011)同样指出雅鲁藏布江缝合带东段与嘉黎断裂通麦段的右旋走滑速率较低, 分别约2.0mm/a和1.9mm/a。 相反, 主喜马拉雅前缘断裂则表现出明显的左旋走滑特征(6~10mm/a), 与Vernant等(2014)的结果一致, 这是由于欧亚板块受到印度板块NNE向的推挤作用。 另外, 谢超等(2016)通过野外地质调查发现墨脱断裂晚第四纪以来以左旋走滑运动为主, 与本文的研究结果相近, 这一运动性质同样可能与东构造结的NNE向推挤有关。
另一方面, 由于东构造结处于印度板块向欧亚板块俯冲的前缘地带, 导致该地区的大部分断裂以挤压运动为主(图3b)。 挤压运动最为明显的米什米断层, 其速率达23.3mm/a, 与Devachandra等(2014)的结果相近(约20mm/a), 但小于Gupta等(2015)所推测的速率(32.4mm/a), 这可能是由于Gupta等(2015)的研究中所用的GPS站点在米什米断层附近分布较少。 上述结果表明印-欧板块在东构造结的会聚速率很大程度上被该断层吸收。 而主喜马拉雅前缘断裂的挤压速率为14~16mm/a, 与Vernant等(2014)的结果一致。 SN走向的实皆断裂则几乎没有挤压运动(速率< 1mm/a), 表明其东侧的块体主要以沿断层向S的侧滑运动为主(Krishna et al., 2000)。
根据上述的断层滑动速率, 可进一步估算出研究区现今的地震矩累积率(Mr):
其中, s为断层不同段的滑动速率, A为断层面的闭锁面积, μ 为剪切模量, 本文取μ =30GPa。
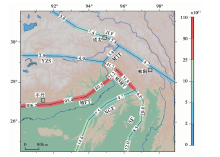
据式(2)可知, 研究区总体的地震矩累积速率为(5.23± 0.13)× 1019N· m/a。 而由图 5可以看出, 印-欧板块边界的逆冲断层是东构造结地区地震矩累积速率最高的断层: 主前缘断层和米什米断层的地震矩累积速率分别占研究区的59.7%和21.6%, 这是由于上述2条断层的滑动速率与闭锁面积都较大。 那加山断层和实皆断层的地震矩累积速率次之, 为(3.17± 0.08)× 1018N· m/a和(3.72± 0.09)× 1018N· m/a。 而其余走滑断层的地震矩累积速率则相对较低, 其中雅鲁藏布江缝合带的地震矩累计率仅占研究区的1.5%。
 | 图 5 东构造结地区的地震矩累积速率(单位: N· m/a)Fig. 5 Moment accumulation rate in the Eastern Himalayan Syntaxis(unit: N· m/a). |
假定地震矩的累积速率自晚第四纪以来保持不变(Royden et al., 2008; Wang et al., 2011), 那么累积速率与时间的乘积即为地震矩的累积总量。 研究区自1800AD至今的地震矩累积总量如图7a所示。 主前缘断层和米什米断层的累积总量分别达6.84× 10²¹N· m和2.47× 10²¹N· m, 存在发生MW8.5和MW8.2地震的可能。 而研究表明, 1950年察隅MS8.6地震的破裂面很有可能就是米什米断层或主前缘断层(Feldl et al., 2006; Devachandra et al., 2014; Gupta et al., 2015), 强震使得断层面上累积的地震矩得以释放, 且将进一步抑制或激发邻区的地震活动。 因此, 未来的地震危险性或孕震机理还必须结合区域的历史地震活动进行评估。
地震周期实质上即地震矩的累积与释放过程(Wang et al., 2010)。 我们基于国际地震中心(International Seismological Centre, ISC)和美国地质调查局(United States Geological Survey, USGS)给出的地震数据, 结合中国历史强震目录(国家地震局震害防御司, 1995)及其它文献资料(Chandra, 1978; Ambraseys et al., 2004; North-East Institute of Science and Technology, 2013), 梳理了研究区内M≥ 6地震的数目及其相应的地震矩释放时间序列图(图1b), 并进一步采用1800AD之后的上地壳地震目录(震源深度≤ 33km, 图1a)分析东构造结地区的地震矩释放情况。
上述地震目录包含体波震级(mb)、 面波震级(MS)、 矩震级(MW)及地方震级(ML)等多种记录方式, 其中除MW与地震矩(M0)之间的函数关系有着严格的定义之外(Hanks et al., 1979), 其余的震级表达与地震矩均没有直接的联系。 因此, 首先需要建立其它震级与地震矩的函数关系。
全球矩心矩张量项目(Global Centroid Moment Tensor Project, GCMT)给出了自1976年以来全球4.5级以上的地震目录, 其震级的记录方式包括mb、 MS 与MW。 本文基于研究区内的矩心矩张量目录(图6a), 采用最小二乘法来估算mb、 MS 与M0的关系(Wang et al., 2010; Tian et al., 2019), 结果如图6b、 6c所示。
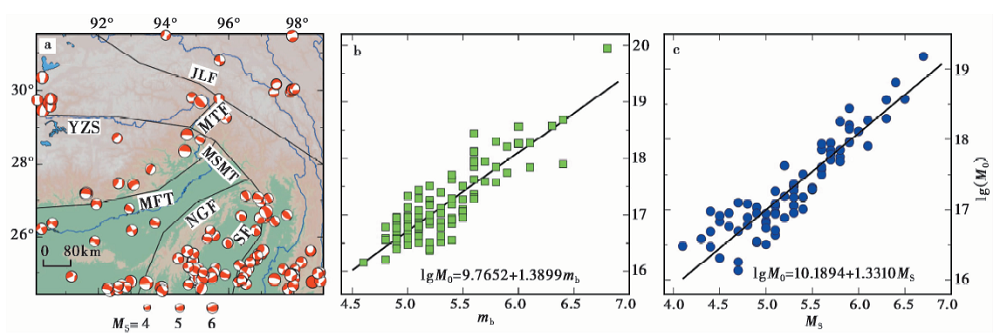 | 图 6 矩心矩张量分布(a)及体波震级mb(b)、 面波震级MS(c)与地震矩M0的线性关系Fig. 6 Centroid moment tensor from GCMT in the study area(a), the linear relation between scalar moment and the body-wave(b), and the surface-wave magnitude(c). |
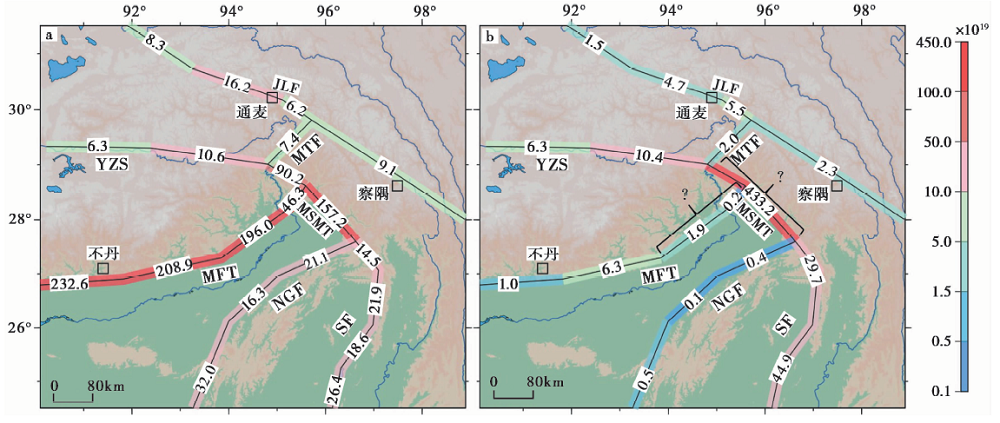 | 图 7 研究区自1800AD以来的地震矩累积量(a)与释放量(b)(单位:N· m) b 大括号标出段表示察隅MS8.6地震的潜在发震断层Fig. 7 Moment accumulation(a)and release(b)since 1800AD in the study area(unit:N· m). |
由于GCMT未给出ML的记录方式, 因此本文采用陈运泰等(2018)给出的中国地区ML与mb的经验公式, 先将地方性震级转换为体波震级, 再利用式(3)建立其与地震矩的函数关系。
研究表明, 近百年来在高原地区发生的36次大地震(MW≥ 6.4)中, 有25次都发生在主断裂附近50km的范围内(Chen et al., 1977)。 因此, 本文将断层(除主前缘断层与米什米断层)两侧50km内的地震视为因断层错动而产生的地震(Loveless et al., 2011; Tian et al., 2019)。 而对于深大俯冲型的主前缘断裂和米什米断裂, 大量地震活动集中于断层面的闭锁部分(Larson et al., 1999; Bettinelli et al., 2006; Ader et al., 2012; Vernant et al., 2014), 因此将自地表沿倾向约100km和65km范围内的地震视为发生在这2条断层面上的地震。
在上述划定的范围内, 结合式(3)和式(4), 计算得到研究区主断裂带自1800AD以来的地震矩释放量, 如图7b所示。 假设地震目录的震级误差为± 0.2(Wang et al., 2010), 那么该区地震矩的释放总量为(5.50± 2.54)× 1021N· m。 其中79.2%的释放量集中于米什米断层, 这是由于我们假设1950年察隅MS8.6地震发生在该断层之上。 地震活动同样较为强烈的实皆断裂和雅鲁藏布江缝合带的地震矩释放量为(7.46± 3.45)× 1020N· m和(1.67± 0.77)× 1020N· m。 其余断层面上的地震矩释放量则相对较低, 大多未超过1.0× 10²⁰N· m。
断层面上地震矩的累积量与释放量的差值即是地震矩的亏损, 而这一亏损量恰恰表征了上地壳的断层在未来发生地震的能力(Meade et al., 2005)。 由于特大地震(如1950年察隅MS8.6地震)使断层面上几百年甚至上千年所累积的地震矩得以释放, 而有效的地震目录的时间跨度一般仅为200~300a, 这就会使得部分断层的地震矩亏损出现负值(Wang et al., 2010, 2011; 李煜航等, 2014; 刘代芹等, 2016)。 因此, 本文对研究区7级以上的11次地震(图1a)的发震位置、 同震位错量与破裂长度进行了更为细致的分析(Chandra, 1978; Molnar et al., 1989; Holt et al., 1991; Bai et al., 2017), 并根据同震位移、 破裂长度与震级的经验关系综合厘定震后断层面上的地震矩亏损状况(Bonilla et al., 1984; Wells et al., 1994)。 当大地震的地震矩释放量大于震前的地震矩累积量时, 认为其发震断层面的地震矩归零, 并在震后重新开始积累, 据此得到研究区现今的地震矩亏损, 如图 8所示。 计算结果表明, 除察隅MS8.6地震之外, 研究区其余的7级地震并未完全释放断层面上自1800AD以来累积的 “ 能量” (地震矩)。 同时, 由于地震目录的缺失不可避免, 上述结果应当是地震矩亏损的上界(Wang et al., 2010)。
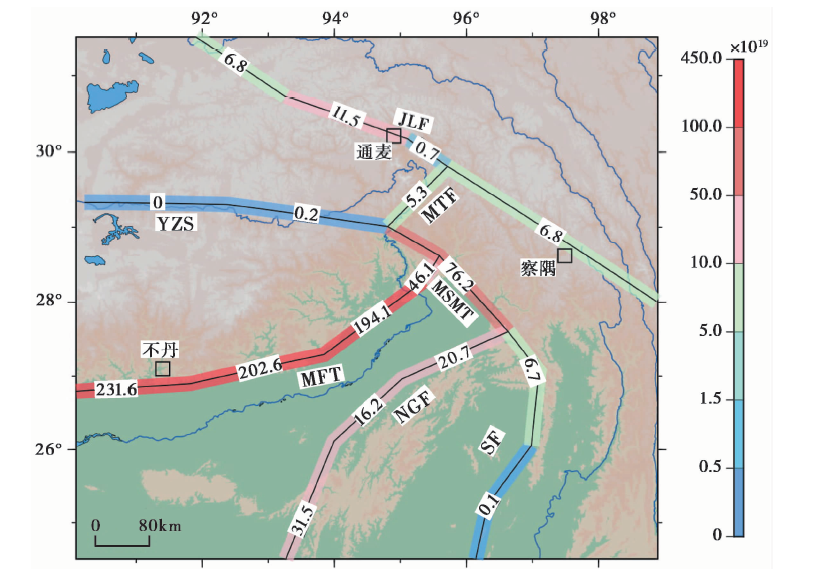 | 图 8 研究区自1800AD以来的地震矩亏损量(单位: N· m)Fig. 8 Estimated regional moment deficit since 1800AD(unit: N· m). |
地震矩亏损量最高的主喜马拉雅前缘断层, 其西侧的不丹段在近200a内的亏损量达2.32× 10²¹N· m和2.03× 10²¹N· m(图8), 未来发生强震的概率最高。 假如上述亏损量在1次地震中全部释放, 矩震级可超过MW8.1, 其西侧的尼泊尔地区已于2015年发生了MW7.8地震(Elliott et al., 2016), 对于该段断层未来的地震活动应予以足够的重视。 那加山断层的地震矩亏损量也相对较高, 平均为2.28× 10²⁰N· m, 具备发生MW7.5以上地震的可能。 此外, 嘉黎断裂通麦段的地震矩亏损为1.15× 10²⁰N· m, 不排除未来发生MW7.3以上地震的可能。 与以上断层相比, 其余断层的地震危险性相对较低: 阿帕龙断裂与墨脱断裂的地震矩亏损量约(5~7)× 1019N· m, 未来发生MW7.1以上地震的概率较低; 雅鲁藏布江缝合带及实皆断裂南段的地震矩亏损量更是接近0, 表明其在近200a内断层面上的能量累积与释放保持相对平衡, 未来将以中小地震为主。
此外, 关于1950年察隅MS8.6地震的发震面至今还无定论(Molnar et al., 1989; Chen et al., 1990; Devachandra et al., 2014)。 假设地震发生在米什米断层(图7b), 那么主前缘断层最东段近200a内的地震矩亏损可达2.40× 10²¹N· m(图8), 很可能在未来发生强震(MW≥ 8.2), 以恢复邻区的地震矩平衡; 另一方面, 大地震后米什米断层的地震矩重新开始累积, 至今已达到7.62× 10²⁰N· m, 未来该区的地震活动也应受到重视。 而如果此次地震发生在主前缘断层东段(图7b), 那么米什米断层未来发生强震(地震矩亏损达2.47× 10²¹N· m, 对应MW≥ 8.2)的概率则较高。 也就是说, 即使察隅大地震发生在主前缘断层和米什米断层附近, 但由于印-欧板块的持续碰撞, 地震矩的亏损仍然明显, 未来的地震危险性同样不容忽视。
Wang等(2011)和Meade(2007)根据青藏高原内部主要活动断层的展布及GPS速率场结果给出了整个高原地区的地震矩累积速率分别为1.24× 10²⁰ N· m /a和1.69× 1020 N· m/a, 而本文计算得到的研究区内主要断裂的地震矩累积速率为(5.23± 0.13)× 1019 N· m/a。 假设不同块体模型及GPS资料不会对地震矩的估计产生较大影响, 则可以推断东构造结地区的地震矩累积速率占整个青藏高原的32%~42%, 而其面积仅约高原的18%。 东构造结地区独特的地质构造导致其现今的断层活动明显高于高原的平均水平。
Meade(2007)利用矩心矩张量数据(1902— 1999年)估计得到青藏高原地区的地震矩释放速率为1.65× 10²⁰N· m/a, 与其给出的地震矩累积率基本一致, 即近百年内青藏高原的地震矩累积与释放保持平衡。 而在更长的时间跨度内(约220a), 东构造结地区的地震矩释放量((5.50± 2.54)× 1021N· m)明显低于地震矩的累积总量((1.15± 0.03)× 1022N· m)。 也就是说, 即使研究区内于1950年发生过MS8.6特大地震, 但由于印度板块对青藏高原持续且强烈的推挤作用, 导致该区断层的地震矩亏损明显, 诸如主喜马拉雅前缘断层、 那加山断层等的地震危险性依然较高。
1950年察隅MS8.6地震的发震断裂至今还无定论, 但大多数研究都认为其破裂面位于印-欧板块边界的大型逆冲断裂— — 主喜马拉雅断裂或米什米断裂, 而非高原内部的墨脱断裂(Molnar et al., 1989; Feldl et al., 2006; Devachandra et al., 2014; Gupta et al., 2015)。 这是因为此次地震的破裂范围较大, 超过200km(Molnar et al., 1989), 大于墨脱断裂在地表的展布长度。 同时, 大量余震广泛分布于喜马拉雅山前及阿萨姆地区(Chen et al., 1990), 而墨脱断裂深部显然不太可能延伸至此(谢超等, 2016)。
察隅MS8.6地震作为喜马拉雅造山带有史以来记录到的最大地震, 其复发周期一直是地震学中的热点问题。 Gutenberg等(1944)提出的地震频度(N)与震级(M)之间的统计关系(G-R定理)是推估地震周期的主要方法之一(陈培善等, 2003; Jenny et al., 2004; 史海霞等, 2018):
其中, 常量a值反映了区域的地震活动性, b值反映了大、 小地震的比例。 研究表明, 对于碰撞带的中长期地震活动, b值的变化不大, 接近0.94(Bird et al., 2004)。 而Singh 等(2009)给出的喜马拉雅东部与西藏南部浅层地壳的b值也约0.92, 因此本文将研究区的b值取为0.92。 Bird等(2004)进一步估算得到大陆板块会聚带可能发生的最大地震震级(mx)为MW8.9, 而Stevens等(2015)则指出喜马拉雅弧带存在发生MW9.0地震的可能。 因此本文将研究区的最大震级(mx)设置为MW9.0。
另一方面, 对于板块的边界断层, 其因构造运动而产生的地震矩累积速率(图5)与因地震而产生的释放速率会在较长的时间尺度上保持平衡, 即MTectonic Moment Rate=MSeismic Moment Rate(Bird et al., 2004; Jenny et al., 2004), 那么a值即满足(Bird et al., 2004):
继而再根据式(5)即可建立震级与地震频度的关系。 对于察隅MS8.6地震, 假设其震级误差为± 0.2, 且破裂面位于米什米断层, 那么对应的地震频度(N)为(0.99~1.52)× 10-3, 即复发周期为660~1 008a; 同理, 若该地震发生在喜马拉雅断层最东端(图7b), 其复发周期则为673~1 029a。
Feldl等(2006)指出, 在喜马拉雅地区, 假定地震的破裂面长200km(近似于察隅地震, 且与本文模型相近), MW8.37~8.5地震的复发周期为500~1 000a, 这与本文的结果基本一致。 Stevens等(2015)则认为印-欧板块碰撞带MW9.0地震的复发周期约800a, 略低于本文的推测, 这是因为其给出的是整个喜马拉雅造山带强震的平均复发周期, 而沿造山带广泛存在的震空区则在一定程度上会造成上述复发周期的过低估计。
本文首先利用微块体模型, 以GPS速度场为约束, 计算了东构造结地区主要断裂的滑动速率及地震矩的累计速率。 然后根据历史地震目录估算了主断裂带的地震矩释放, 得到了研究区自1800年以来的地震矩亏损。 最后基于G-R定理给出了1950年察隅MS8.6地震的复发周期, 得到的结论主要包括:
(1)东构造结地区总体地震矩累积速率为(5.23± 0.13)× 1019N· m/a, 占整个青藏高原的32%~42%, 断层活动性高于高原的平均水平。 近200a内的地震矩累积总量为(1.15± 0.03)× 1022N· m, 明显高于释放总量(5.50± 2.54)× 1021N· m, 表明该区未来的地震危险性较高。
(2)地震矩亏损量最高的主前缘断裂不丹段具备发生MW8.1以上地震的可能, 对其未来的地震活动应予以足够的重视。 那加山断裂及嘉黎断裂通麦段则不排除未来发生MW7.5以上及MW7.3以上地震的可能, 而其余断层未来发生MW7.1以上地震的概率则相对较低。 雅鲁藏布江缝合带及实皆断裂南段未来很可能以中小地震为主。
(3)若察隅MS8.6地震发生于米什米断层, 那么未来在主前缘断层东段很有可能发生强震(MW≥ 8.2)以恢复邻区的地震矩平衡; 若发生在主前缘断层, 则米什米断层未来发生强震(MW≥ 8.2)的概率较高。 但无论破裂发生于哪条断层, 其未来的地震危险性都不容忽视, 察隅地震的复发周期也基本均为660~1 030a。
致谢 陕西省地震局师亚芹研究员提供了中国历史强震数据, 并在论文撰写过程中给予了无私的帮助和指导; 审稿专家为本文提出了宝贵的意见及建议; 文章插图采用GMT软件绘制。 在此一并表示感谢!
| [1] |
|
| [2] |
|
| [3] |
|
| [4] |
|
| [5] |
|
| [6] |
|
| [7] |
|
| [8] |
|
| [9] |
|
| [10] |
|
| [11] |
|
| [12] |
|
| [13] |
|
| [14] |
|
| [15] |
|
| [16] |
|
| [17] |
|
| [18] |
|
| [19] |
|
| [20] |
|
| [21] |
|
| [22] |
|
| [23] |
|
| [24] |
|
| [25] |
|
| [26] |
|
| [27] |
|
| [28] |
|
| [29] |
|
| [30] |
|
| [31] |
|
| [32] |
|
| [33] |
|
| [34] |
|
| [35] |
|
| [36] |
|
| [37] |
|
| [38] |
|
| [39] |
|
| [40] |
|
| [41] |
|
| [42] |
|
| [43] |
|
| [44] |
|
| [45] |
|
| [46] |
|
| [47] |
|
| [48] |
|
| [49] |
|
| [50] |
|
| [51] |
|
| [52] |
|
| [53] |
|
| [54] |
|
| [55] |
|
| [56] |
|
| [57] |
|
| [58] |
|
| [59] |
|