

用微动台阵记录联合反演场地浅层速度结构——以唐山响嘡台3#场地为例
[王继鑫1)  , 荣棉水
, 荣棉水1)), * , 符力耘2) , 傅磊3) ]
, 荣棉水, 符力耘|
|


〔作者简介〕 王继鑫, 男, 1993年生, 2020年于中国地震局地壳应力研究所获固体地球物理学专业理学硕士学位, 现为北京工业大学土木工程专业博士研究生, 主要研究方向为基于背景噪声反演模型的区域性场地放大特征研究, E-mail: jixinwang1994@126.com。
目前, 利用台阵观测记录反演浅地表土层波速剖面的研究一般单独进行面波频散曲线(Dispersion Curve, 简称DC)或微动水平与竖向谱比(Microtremor Horizontal-to-Vertical Spectral Ratio, 简称 MHVSR)反演, 但其反演的速度结构往往存在明显的多解性。 鉴于此, 文中发展了DC与 MHVSR联合反演方法, 提出了一种新的反演策略。 区别于已有的反演方法, 文中方法首先利用微动台阵记录获得面波频散曲线, 进而采用改进的半波长法获得场地初始速度结构, 最后通过DC和 MHVSR的联合反演得到场地最佳速度结构。 该反演方法的优势体现在2个方面: 1)在面波频散曲线提取环节, 综合应用修正空间自相关(MSPAC)法和频率-波数( F- K)法, 拓宽了采用单一方法提取频散曲线的频率范围; 2)在初始速度结构确定环节采用了改进半波长法, 可较好解决当前其他反演方法依赖一定先验信息的难题。 文中分别以一理论算例及台阵观测算例验证了新反演策略的有效性及稳定性。 结果表明, 单独的DC反演模型的理论 MHVSR在峰值频率之后(特别在高频段)与理论算例模型的 MHVSR有差异, 单独的 MHVSR反演所得模型的DC在较低频段内与理论算例模型的DC有差异, 而二者联合反演可弥补DC反演模型的 MHVSR高频差异和 MHVSR反演模型的DC低频差异, 极大地降低了反演模型的多解性。 相比已有的浅层速度结构反演方法, 文中提出的基于微动台阵记录的联合反演方法更具有实用价值。
The research on the exploration method of velocity structure of the site soil layer that is efficient, economic and easy for promotion and application is of great significance considering the importance of shear wave velocity structure in shallow underground for prediction and prevention of geological hazards. With no dependence on special hypocenter, no need for destructive drilling and a wide range of detectable depths, microtremor array applies to densely populated cities and plain areas, and has become one of the new research focuses in the field of geophysical exploration at home and abroad in recent years.
In the study of inversion record of wave velocity profile on shallow soil layer by using array observation records, surface wave dispersion(DC)or microtremor horizontal-to-vertical spectral ratio( MHVSR)inversion is generally carried out separately at present, but the velocity structure of inversion is often of obvious multi-solution. The dispersion curve mainly constrains the shear wave velocity of the loose sedimentary layer while the predominant frequency estimated from the peak value of MHVSR mainly constrains the thickness of the overburden. In addition, various results of the Rayleigh-wave dispersion curve indicate that the calculated frequency range of the phase velocity is higher than the predominant frequency. In view of this, a joint inversion method of DC and MHVSR is developed, and a new inversion strategy is proposed in this paper. Different from the existing inversion methods, in this paper, firstly the Rayleigh-wave dispersion curve is obtained from the data of microtremor array by Modified Space Autocorrelation Method(MSPAC)and Frequency-wavenumber analysis method( F- K), the results are compared with the theoretical fundamental order and one high order Rayleigh wave dispersion curve calculated from the borehole data, and the measured dispersion curve is fitted. Secondly, the dominant frequency and its corresponding amplification coefficient of the site are analyzed based on the Microtremor Horizontal-to-Vertical Spectral Ratio( MHVSR)recorded from a single station. As a result of the correlation between the dominant frequency and the thickness of the overburden, the depth of the site bedrock is determined, and then the initial velocity structure of the site is obtained by the improved half-wavelength method. Finally, the best velocity structure of the site is determined by the joint inversion of DC and MHVSR, and the S-wave transfer functions caused by the vertical incidence of the inversion model and the measured borehole model obtained by different inversion methods are compared.
The advantages of the inversion method in this paper lie in two aspects. On the one hand, in the extraction of surface wave dispersion curve, the comprehensive application of Modified Space Autocorrelation Method(MSPAC)and Frequency-wavenumber analysis method ( F- K) widens the frequency range of extracting dispersion curve by a single method. On the other hand, in the determination of initial velocity structure, the problem of relying on certain prior information of the current other inversion methods is better solved with the improved half-wavelength method.
In this paper, the effectiveness and stability of the new inversion strategy are verified by a theoretical example and an array observation example. It is observed that the MHVSR of the single DC inversion model is different from that of the theoretical example model after the peak frequency(especially in the high frequency segment)under the initial model, and the DC of the single MHVSR inversion model is different from that of the theoretical example model in the lower frequency segment. However, the joint inversion of the two makes up for the high frequency difference of the MHVSR of the DC inversion model and the low frequency of the DC of the MHVSR inversion model, thus greatly reducing the multi-solution of the inversion model and reflecting well the site characteristics(amplification effect and predominant frequency)when the inversion model approaches the real site. Compared with the traditional seismic and electromagnetic exploration methods, the joint inversion method based on the microtremor array records in this paper is of more practical value in acquiring the velocity structure of shallow site.
强地震中, 震源特性、 地震波传播路径及地表局部场地条件均会影响震区的地震动特性。 近年来, 国内外震害经验一致表明局部场地条件是引起地震动或震害局部变化的主要影响因素(Murphy et al., 1988; Singh et al., 1988; Bard, 1994; Eker et al., 2012)。 因此, 分析近地表局部场地条件对地震动的影响成为地震学和工程学研究的一个主要课题。 场地浅层速度结构(分层及速度变化)是开展地表局部场地地震影响分析、 评价场地地震效应并进行工程抗震的基础资料(李小军等, 2020)。 获取工程场地浅层速度结构的常规方法有跨(单)孔法和地震勘探法等。 跨(单)孔法虽然能获得较准确的速度值, 但需要较多的人力和物力、 费用高且效率低, 不利于大规模的开展应用。 地震勘探法则受场地条件限制较大, 且勘探深度有限(Park et al., 1999)。 因此, 研究更为简便、 高效、 经济、 易于推广应用的场地土层速度结构探查方法一直是工程领域探讨的热点问题之一。
自Toksö z(1964)和Horike(1985)的开创性工作以来, 利用微动台阵观测技术获取S波的速度结构已被公认为是一种有吸引力且方便的勘探方法。 其不依靠专门的震源、 无需破坏性钻孔且可探测深度范围大, 适用于人口稠密的城市及平原地区, 近年来已成为国内外地球物理勘探界的新研究热点之一(Satoh et al., 2001; Shapiro et al., 2005; Xu et al., 2013; Setiawan et al., 2019)。 Toksö z等(1968)的研究表明, 微动是由体波(P波和S波)和面波(Rayleigh波和Love波)组成的复杂运动, 且面波能量占总能量的70%以上。 大多数情况下微动的震源在地表或海底, 它们的大部分能量以面波的形式释放出来。 微动探测技术的基础正是从台阵观测的天然源微动信号中提取面波(Rayleigh波), 基于Rayleigh波的频散信息获取场地的构造特性(Okada, 2003)。 由微动提取面波的方法目前主要有2种, 一种是由Aki(1957)提出的SPAC方法以及后人在此基础上改进的SPAC法, 如MSPAC(Bettig et al., 2001)、 ESPAC(Ling et al., 1993)和CAA(Cho et al., 2006)等; 另一种是应用LASA(Large Seismic Aperture Array)的核试验监测原理开发出的F-K方法(Capon, 1969; Lacoss et al., 1969)。 Xia等(1999)的研究已表明面波频散(DC)是横波速度、 纵波速度、 密度及层厚度的函数, 其中横波速度的影响最大, 地层厚度的影响较小, 而纵波速度及密度的影响基本可忽略不计。 因此, 对SPAC法或F-K法所得的频散曲线进行反演, 则可独立获得剪切波的速度结构。
另一方面, 自Nakamura(1989)研究表明场地上的单台三分量检波器所得微动的水平-竖向谱比(MHVSR)与场地垂直入射S波的卓越频率与放大因子相似以来, 单点谱比法一直受到国际上广大工程地震学研究人员的关注, 并针对其开展了大量理论和应用研究(Bard et al., 2004; Molnar et al., 2006, 2018; Pilz et al., 2009), 验证了场地MHVSR响应随时间的稳定性以及MHVSR的卓越频率与地震动卓越频率的一致性。 同时, 国内外研究者建立了微动卓越频率与场地的覆盖层厚度的拟合关系(Ibs-von Seht et al., 1999; Parolai, 2002; 曾立峰等, 2012; 刘宇实等, 2018), 利用此拟合关系则可估计出场地基岩埋深。 目前, MHVSR分析已成为世界范围内广泛应用的勘察工具, 并应用于地震小区划、 场地特征估计以及场地S波速度结构反演(Arai, 2004; Kawase et al., 2018; Hellel et al., 2019)等研究中。
尽管利用频散曲线或MHVSR曲线反演场地的浅层速度结构已取得一些研究成果, 然而当单独进行MHVSR或面波频散曲线反演时, 反演速度结构的多解性问题往往比较明显。 为了降低反演的多解性, 则需要更多的场地信息加以约束。 相关研究者(Tsuboi et al., 1983; Arai, 2004)在探讨利用MHVSR求取场地剪切波速度结构的可靠性时, 采用MHVSR相对土层模型参数的偏导数进行了灵敏性分析, 表明浅部土层的剪切波速及厚度对MHVSR曲线的影响最显著。 Scherbaum等(2003)指出场地土层的剪切波速及厚度对MHVSR和频散曲线的敏感性不同, 频散曲线主要约束松散沉积层的剪切波速, 而由MHVSR峰值估计的卓越频率主要约束覆盖土层厚度。 此外, 针对Rayleigh波频散曲线的各项研究结果表明, 其相速度的计算频率范围高于卓越频率(Bonnefoy-Claudet et al., 2006), Tokimatsu等(1992)在台阵观测的基础上揭示出MHVSR频率的变化与基阶Rayleigh波对于场地的剪切波速剖面的变化相对应。 鉴于此, 近年来, 为充分利用MHVSR和频散曲线所包含的地下结构信息, 有效缓解乃至克服MHVSR反演的多解性, 有研究者提出了联合MHVSR和频散曲线反演场地速度结构的方法(Arai et al., 2005; Parolai et al., 2005; Picozzi et al., 2005; Chá vez-Garcí a et al., 2014; Castellaro, 2016; Garcí a-Jerez et al., 2019)。 尽管该方面的研究已取得了一些成果, 但由于特定台阵单一方法获取的DC曲线频段范围往往较窄, 对反演效果产生了较大影响。 此外, 已有方法在反演时均需设定一根据先验信息确定的初始模型, 限制了该方法的广泛应用。 本文对唐山响嘡台3#场地开展了L形阵列结构的短周期微动探测试验, 综合应用修正空间自相关(MSPAC)法和频率-波数(F-K)法, 拓宽了采用单一方法提取频散曲线的频率范围, 采用改进半波长法较好地解决了当前其他反演方法依赖一定先验信息的难题, 通过理论模型算例和基于实际观测记录的算例验证了联合反演方法在降低反演多解性、 获得更准确的场地速度结构方面的实际效果。
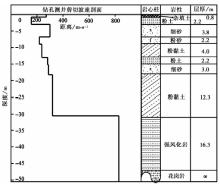
为获取中强地震记录, 研究局部场地条件对地震动的影响, 1994年7月中国地震局工程力学研究所在唐山余震区响嘡镇建成了中国第1个三维场地影响观测台阵(谢礼立等, 1999)。 该台阵拥有1#、 2# 2个测井, 但未进行测井土样的土动力学试验。 为弥补这一缺陷, 于2000年增设了3#测井。 该测井穿透强风化层, 到达弱风化层, 井深47m, 并对钻孔土样进行了土动力学测试, 其钻孔数据如 表1所示, 剪切波速剖面及钻孔柱状图如 图 1 所示(周雍年等, 2005)。
| 表1 唐山响嘡台3#场地的测井钻孔数据 Table1 The logging and drilling data of the observation site 3# of Xiangtang in Tangshan |
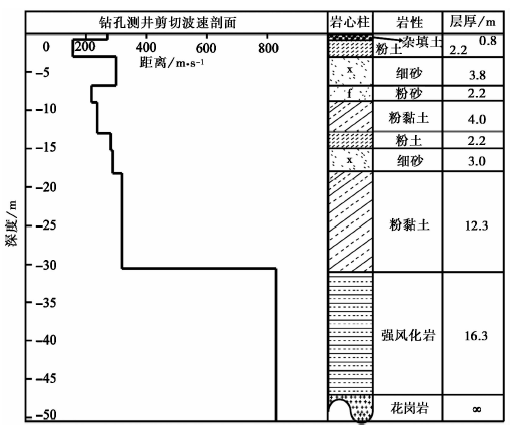 | 图 1 3#测井的剪切波速剖面和柱状图(周雍年等, 2005)Fig. 1 Shear wave velocity profile and histogram of logging at the 3# site(Zhou Yong-nian et al., 2005). |
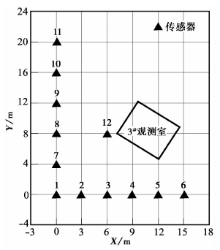
本文选取3#测井场地作为观测对象, 该场地位于河北省唐山市滦县响嘡镇杜峪村(39.70°N, 118.74°E)。 我们于2019年7月2—3日对该场地以1 000Hz的采样率进行了连续24h的微动探测实验。 根据场地条件, 将传感器布置为如 图 2 所示的L形台阵。 该台阵在X方向的最大阵列长度为15m, 传感器间距为3m; 在Y方向的最大阵列长度为20m, 传感器间距为4m, 同时在3#观测室旁布置了1个12号传感器。 在布设台阵前已对12台传感器进行了一致性对比, 以确保其相位、 振幅、 相干系数均达到一致性要求。 为减轻风噪和人为干扰, 均采取挖坑埋置布设传感器的方式, 对台阵中各观测点独立进行数据采集, 通过接收GPS卫星信号自动实现时间同步。 依据奈奎斯特波数, 可假定测量中检测到的最小波长是阵列中最小传感器间距的2倍(Ohori et al., 2002)。 另一方面, 根据Horike(1985)、 Satoh等(2001)和Okada(2003)的研究, 在阵列观测中检测到的最大波长是最大传感器间距的2倍到几倍。 为保险起见, 本文使用2倍最大传感器间距作为最大波长, 该L形阵列可探测的波长为6~50m。
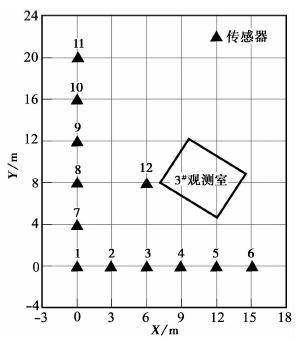 | 图 2 试验台阵布设Fig. 2 The locations of microtremor array. |
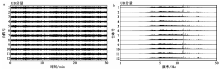
前人的观测与研究证明, 微动可认为是一种平稳的随机过程, 是随时间和位置矢量变化的自然现象。 某一段时间的微动记录可看成一个零均值平稳随机过程的样本函数(Aki, 1957; Okada, 2003)。 对于3#场地微动台阵记录的24h数据, 本文截取其中2019年7月3日凌晨2:00—2:30的垂直向记录。 当夜天气晴朗无风, 环境十分安静, 并将此段数据重采样至200Hz, 同时进行了去均值、 去趋势项等预处理。 图 3 给出了预处理之后12个台阵30min的微动波形记录以及由FFT所得的振幅谱。 结果显示, 12个台站的振幅谱一致性好, 能量主要集中在3~20Hz频率范围内, 其中3.5~12Hz范围内的振幅谱形态相似, 能量稳定。
 | 图 3 试验场地12个测点的微动台阵观测记录 a 微动波形记录; b 振幅谱Fig. 3 The records of microtremor array of 12 stations. |
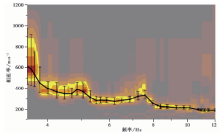
本文对预处理的微动信号使用修正空间自相关法(MSPAC)(Bettig et al., 2001)获得3.5~12Hz范围内的相速度频散曲线( 图 4), 使用频率-波数法(F-K)(Capon, 1969; Lacoss et al., 1969)获得8.3~20Hz范围内的相速度频散曲线( 图 5)。
 | 图 4 由MSPAC所得实测Rayleigh波频散曲线Fig. 4 Measured Rayleigh wave dispersion curve obtained by MSPAC. |
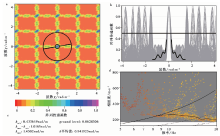
 | 图 5 试验台阵理论转换函数及所得频散曲线 a 试验场地12个传感器在(kx, ky)平面上的理论阵列响应, 小圆圈和大圆圈分别表示kmin/2和kmax的位置, 黑线表示交切线, 对应图b中黑线表示的转换函数曲线; b 试验台阵不同方位角交切线的转换函数; c 阵列传递函数与波数值; d 速度-频率域中与kmax、 kmin相关的值以及所得的频散曲线Fig. 5 The theoretical transfer function and dispersion curves for the test array. |
如 图 6 所示, 将基于L形微动台阵提取的频散曲线与基于钻孔模型的理论基阶、 一阶频散曲线进行了比较。 从图中可以看出, MSPAC法得到的结果与基阶模态的理论结果基本一致, 但在3.8Hz之前的相速度与理论一阶更接近, 4.8~7.5Hz的相速度较发散, 其结果在理论基阶与一阶相速度之间, 10.8~12Hz的相速度略低于理论基阶的相速度。 相较于MSPAC法, 对于同一微动台阵, F-K法更容易提取到高频部分的面波信息, 所得结果与基阶模态的理论结果基本一致, 而在8.3~14.5Hz的相速度略高于理论基阶的相速度。 对于MSPAC法和F-K法提取的8.3~12Hz范围内的频散曲线, 以两者的平均值作为观测值。 最终, 综合MSPAC法与F-K法所得结果, 采用多项式拟合法获得3.5~20Hz的频散曲线, 并将此结果作为试验场地的观测值。
 | 图 6 理论、 实测以及拟合所得Rayleigh波频散曲线Fig. 6 Rayleigh wave dispersion curve obtained from theory, measurement and fitting. |
MHVSR曲线能够反映地下结构的关键特征, 通过曲线的峰值振幅可以揭示试验场地是否存在明显的波阻抗界面。 近年来, 国内外研究学者(Ibs-von Seht et al., 1999; Mucciarelli et al., 2003; 王伟君等, 2009, 2011)基于观测记录证实了由MHVSR得到的峰值频率具有较好的稳定性, 与覆盖土层的卓越频率具有很好的对应关系。 依据场地卓越频率与土层厚度的关系, 可以估计场地的覆盖土层厚度, 创建沉积盖层厚度的地形图(陈棋福等, 2008)。 此外, 通过MHVSR曲线在空间或特殊形状上的变化, 可揭示场地的横向不均匀性(Bonnefoy-Claudet et al., 2009; Uebayashi et al., 2012; Matsushima et al., 2014; Macau et al., 2015)。
MHVSR的定义为沉积场地微动观测记录的水平分量频谱(HS(f))与垂直分量频谱(VS(f))之比:
式中, 场地观测的微动水平分量HS(f)和垂直分量VS(f)包含等效源、 传播路径、 场地和仪器响应的共同影响, 通过水平分量和垂直分量的频谱比(MHVSR)可有效剔除不同噪声源、 传播路径和仪器响应的影响, 获得反映场地频率特性的信息(陈棋福等, 2008; Rong et al., 2019)。
我们对试验场地微动台阵的12个台站的三分量微动观测记录进行了MHVSR分析。 本文截取了2019年7月3日凌晨2:00—2:30台阵的三分量记录, 将此段数据重采样至200Hz, 同时进行了去均值、 去趋势项等预处理。 对于预处理的三分量数据按照频率相关(取30个中心频率的周期为长度单位)分割成若干不同长度的时间窗, 窗口的长度与频率成反比, 较长的时间窗口应用于测量稳定的低基频点。 为了更为准确地获取MHVSR的峰值频率, 使用反地震触发STA/LTA算法(Atakan et al., 2004)剔除瞬变信号, 保留稳定的微动数据。 处理时长时窗取为30s, 短时窗取为1.0s, STA/LTA的最小值设为0.2, 最大值设为2.5。 对每个时间窗分别计算垂直和水平向的傅里叶谱, 其中水平向傅里叶谱为SN向和EW向傅里叶谱的均方根。 使用Konno-Ohmachi平滑算法(Konno et al., 1998)对傅里叶谱进行平滑(平滑系数取为20), 然后计算水平与垂直傅里叶谱的比值(MHVSR)。
图7给出了基于唐山响嘡台阵3#场地的微动观测数据所计算的MHVSR结果, 每个观测点的MHVSR曲线由所有时间窗的MHVSR曲线取平均得到( 图7a)。 分析台阵中的12个观测点谱比结果可发现, 其峰值振幅略有差异, 值在8.46~11.22之间变化, 曲线的形态基本一致。 本研究最终试验场地的MHVSR曲线由所有观测点的MHVSR曲线取平均得到( 图7b), 场地峰值频率取2个灰色区域之间的极限值f0=2.30Hz, 利用卓越频率与覆盖土层厚度的关系式h=96
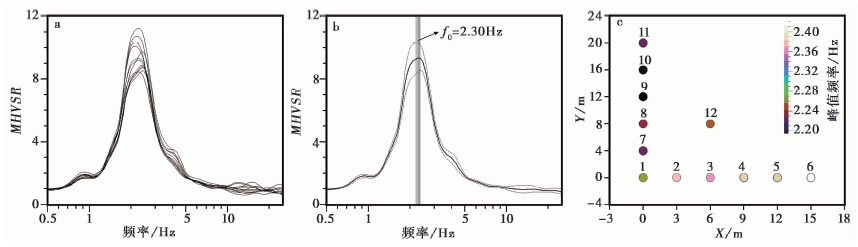 | 图 7 唐山响嘡台阵3#场地实测MHVSR结果 a 台阵单台MHVSR曲线; b 由单台MHVSR曲线平均所得MHVSR曲线; c 台阵单台MHVSR峰值频率Fig. 7 The MHVSR results of the observation site 3# of Xiangtang in Tangshan. |
目前大多数研究在建立初始模型时往往根据得到的地质勘测资料按照经验估计出土层参数, 且取值范围较广, 这样既影响反演计算时的效率, 又影响反演结果的精度。 本文考虑直接采用频散曲线而不借助其他勘察手段来建立初始模型。 笔者在已开展的工作中利用改进的半波长法基于频散曲线确定初始模型, 该模型具有不超过35%的最大误差, 可为后续反演提供一个0.65VSi* ~1.35VSi* 的模型空间(王继鑫等, 2020)。 限于篇幅, 本文直接引用该方法改进联合反演方法, 使之成为一种无需先验信息的联合反演方法。
根据第2节中多项式拟合的3.5~20Hz实测频散曲线, 以0.1Hz为步长采用改进半波长法估算出试验场地剪切波速剖面( 图 8)。 工程上将剪切波速> 500m/s的层位定义为软基岩, 本文由估算的剪切波速剖面, 得出剪切波速< 500m/s的覆盖土层厚度为29.2m, 此结果与试验场地钻井测量以及频率-厚度关系所得沉积厚度基本一致。 鉴于此, 本文在构建反演的初始模型时, 设试验场地基岩深度为30m, 将基岩覆盖土层按每层厚3m进行划分, 共分为10层, 每层的剪切波速依据估算的剪切波速剖面按对应的深度进行加权平均计算得出。 同样, 依据估算出的试验场地剪切波速剖面将> 500m/s的剪切波速按对应的深度进行加权平均计算所得的758m/s定为初始模型的基岩剪切波速度。 考虑到DC与MHVSR主要受剪切波波速(VS)、 地层厚度(h)2个参数的影响(Xia et al., 1999; 李小军等, 2020), 本文在建立初始模型时, 基于弹性理论按式VP=
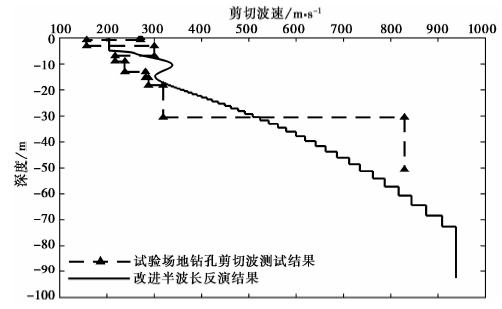 | 图 8 唐山响嘡台3#场地反演得到的初始剪切波速剖面与钻孔结果的对比Fig. 8 The comparison of initial shear wave velocity profile obtained from inversion with drilling results. |
| 表2 唐山响嘡台3#场地的初始模型 Table2 The initial model of the observation site 3# of Xiangtang in Tangshan |
本文利用L形台阵获取了试验场地微动数据, 采用MSPAC与F-K法获取了试验场地3.5~20Hz的Rayleigh波频散曲线, 但其相速度的计算频率范围高于该试验场地的卓越频率(2.30Hz), 该试验结果与Bonnefoy-Claudet等(2006)的观点一致。 已有研究表明(Claprood et al., 2007, 2012; Garcí a-Jerez et al., 2007)DC与MHVSR联合反演可以解决频散曲线低频段问题, 并可有效识别深部地层结构。 鉴于此, 为充分利用MHVSR和频散曲线所包含的地下结构信息、 有效地缓解乃至克服单独的MHVSR(或DC)曲线反演的多解性, 本研究拟采用DC与MHVSR联合反演试验场地浅层速度结构。 该联合反演方法基于散射场理论(Sá nchez-Sesma et al., 2011; Garcí a-Jerez et al., 2016), 在反演过程中可进行蒙特卡罗采样、 模拟退火、 下坡单纯形和内点法等多种全局和局部算法, 使用了适合MHVSR与DC的权重, 将模型Γ 的成本函数(cost-function)或失配(misfit)定义为
式中, MHVSRobs为实测的水平与竖向谱的比值; MHVSRcal为理论计算的水平与竖向谱的比值;
本文在反演实测场地速度结构之前, 为检验DC与MHVSR联合反演算法的有效性与稳定性, 进行了基于实测钻孔模型的反演算例, 即根据试验场地钻孔获取的场地动力学参数资料, 将计算的理论曲线作为反演目标。 通过比较单独的DC或MHVSR反演与联合反演所得的结果, 评估该反演方法。
为检验DC与MHVSR联合反演的有效性, 进行了理论模型试算, 即依据 表1唐山响嘡台3#场地的测井数据, 获取理论计算的DC与MHVSR曲线, 并以此作为反演目标进行反演, 进而比较反演所得模型的DC或MHVSR曲线与理论钻孔模型的DC或MHVSR曲线, 对反演方法进行评估。 在构建反演所需的初始速度结构模型时, 设各层厚度和密度与钻孔参数一致, 泊松比固定为0.25, VP、 VS二者之间的关系按VP=
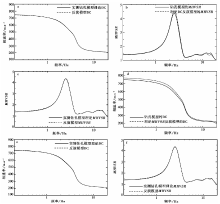
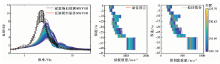
将钻孔模型的理论DC作为反演目标而获得的速度结构如 图9a所示, 其DC与钻孔模型理论的DC几乎一致, 然而其理论MHVSR曲线与钻孔模型的MHVSR曲线相比( 图9b), DC反演模型的MHVSR在峰值频率之后(特别在高频段)与钻孔模型的MHVSR有差异; 将钻孔模型的理论MHVSR作为反演目标而获得的速度结构如 图9c所示, 其MHVSR与钻孔模型理论的MHVSR几乎一致, 然而其理论DC与钻孔模型的DC相比( 图9d), MHVSR反演模型的DC在较低频段内与钻孔模型的DC有差异; 而联合反演模型的DC和MHVSR与钻孔模型的DC和MHVSR几乎无差异( 图9e, f)。 另一方面, 实测钻孔土层(30.5m)的平均剪切波速为280m/s, 而基于DC、 MHVSR以及联合反演模型的平均剪切波速分别为280.1m/s、 284.2m/s、 280.8m/s。
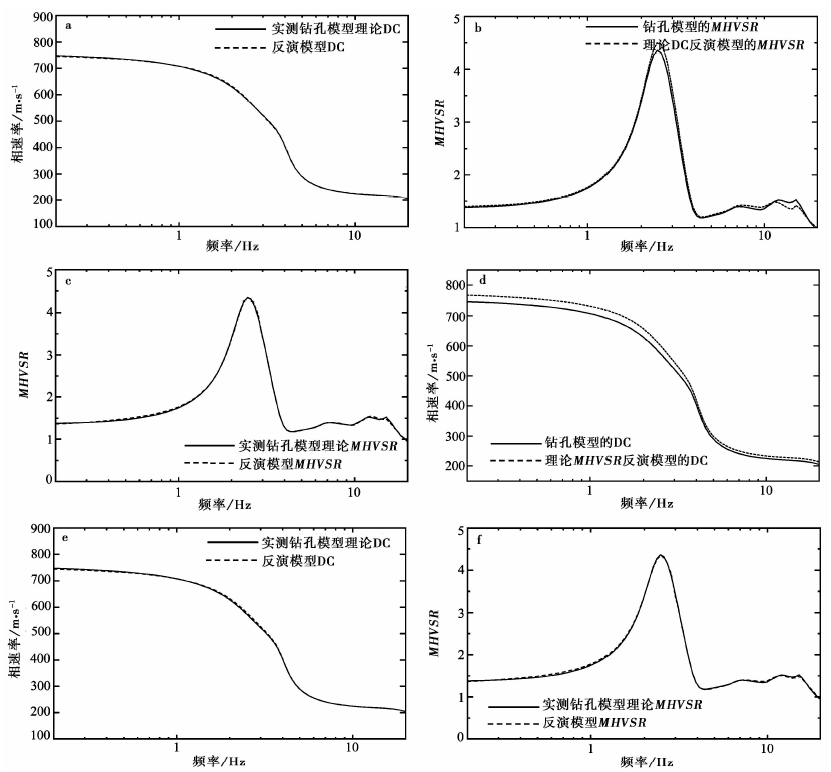 | 图 9 反演模型与钻孔模型的理论DC或MHVSR对比Fig. 9 The comparison of theoretical DC or MHVSR between inversion model and drilling model. |
反演结果说明, 单独的DC或联合反演模型均可获取高精度的土层平均剪切波速, 然而在实际情况中由于场地条件等因素, 微动台阵法难以获取较低频的频散信息, 单独进行DC反演则无法获取更深层的土层结构。 而联合反演既可以弥补DC反演模型的MHVSR高频差异, 又可以弥补MHVSR反演模型的DC低频差异, 从而使反演所得模型在逼近场地真实情况下, 能很好地反映场地的场地特征(放大效应和卓越频率)。
依据第2节中多项式拟合的唐山响嘡台3#场地实测频散曲线以及第3节中由观测得到的MHVSR曲线, 分别采用单独的DC、 MHVSR以及DC与MHVSR联合反演法反演该场地浅层速度结构, 反演场地的初始模型设置见 表2。
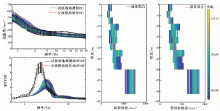
反演过程中分别以观测DC、 MHVSR以及DC与MHVSR为反演目标获取场地土层速度结构, 所得结果如 图 10—12所示。 通过对比反演结果与试验场地钻孔结果( 表3)可知: 以观测DC为反演目标而获得的速度结构, 其基岩之上距离地表30m处的平均剪切波速值(vS30)为289m/s, 相对误差为7.8%, 基岩剪切波波速值为763m/s, 相对误差为8.0%; 以观测MHVSR为反演目标而获得的速度结构, 其vS30=236m/s, 相对误差为-11.9%, 基岩剪切波波速值为686m/s, 相对误差为-17.2%; 以观测DC与MHVSR为反演目标而获得的速度结构, 其vS30=278m/s, 相对误差为3.7%, 基岩剪切波波速值为789m/s, 相对误差为-4.8%。 以上计算结果表明, 观测DC与MHVSR联合反演模型更接近钻孔实测模型特征。
 | 图 10 以观测DC为反演目标获取的速度结构Fig. 10 The velocity structure obtained by observing DC as the inversion target. |
 | 图 11 以观测MHVSR为反演目标获取的速度结构Fig. 11 The velocity structure obtained by observing MHVSR as the inversion target. |
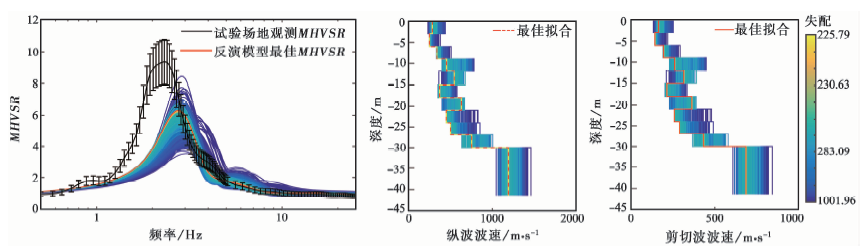
 | 图 12 以观测DC与MHVSR为反演目标获取的速度结构Fig. 12 The velocity structure obtained by observing DC/MHVSR as the inversion target. |
| 表3 唐山响嘡台3#场地不同反演方法的结果及相对误差 Table3 The inversion results and relative errors of different inversion methods in Xiangtang, Tangshan, 3# site |
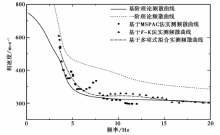
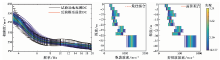
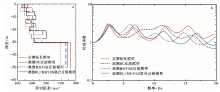
此外, 为了比较不同反演方法所得模型的场地放大效应, 图13b给出了不同方法反演模型与实测模型的传递函数。 结果表明, 不同反演方法所得模型与实测模型的传递函数在0.1~5Hz范围内的谱形及幅值几乎一致。 观测DC反演模型的传递函数在5Hz后与实测模型的传递函数存在一定差异; 观测MHVSR反演模型及DC与MHVSR联合反演模型在5Hz后与实测模型的传递函数在谱形上存在明显的一致性, 且观测DC与MHVSR联合反演的模型更接近实测模型的谱形。 从传递函数最大幅值的角度看, 实测模型的最大幅值为2.96, 观测DC反演模型的最大幅值为2.83, 观测MHVSR反演模型的最大幅值为3.10, 观测DC与MHVSR反演模型的最大幅值为2.92。 计算结果中, 观测DC与MHVSR反演模型的传递函数最大值最接近钻孔实测模型。
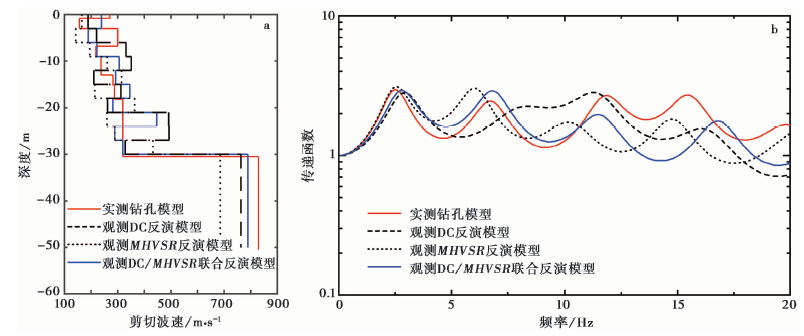 | 图 13 不同反演方法下试验场地剪切波速剖面(a)及其传递函数(b)的比较Fig. 13 The comparison of shear wave velocity profiles(a) and transfer functions(b) of the test site under different inversion methods. |
本文在已有联合反演方法的基础上, 利用微动探测方法以及改进半波长法建立了新的DC与MHVSR联合反演方法。 基于所提出的反演方法, 利用理论模型试验分析了方法的有效性与稳定性, 通过在浅层速度结构已知的唐山响嘡台3#场地进行的微动探测试验检验了联合反演方法的实用性。 理论模型数据和实测资料的反演结果表明: 针对试验场地条件设置的微动台阵, 综合应用修正空间自相关法(MSPAC)和频率-波数(F-K)法可拓宽采用单一方法提取频散曲线的频率范围, 在初始速度结构确定环节, 直接利用观测数据, 采用改进半波长法可较好地解决当前其他反演方法依赖一定的先验信息的难题。 在初始模型下, 联合反演既可以弥补DC反演模型的MHVSR高频差异, 又可以弥补MHVSR反演模型的DC低频差异, 使反演所得模型在逼近场地真实情况下, 能很好地反映场地的场地特征(放大效应和卓越频率)。 相比传统的地震、 电磁类勘探方法, 本文基于微动台阵记录的联合反演方法在获取浅层场地速度结构方面更具有实用价值。
致谢 本文采用Geopsy软件包(3.2.2版)①(①http://www.geopsy.org/。)分析MHVSR; 采用HV-Inv软件 ②(②http://w3.ual.es/GruposInv/hv-inv/。)进行DC与MHVSR的联合反演。 在此一并表示感谢!
| [1] |
|
| [2] |
|
| [3] |
|
| [4] |
|
| [5] |
|
| [6] |
|
| [7] |
|
| [8] |
|
| [9] |
|
| [10] |
|
| [11] |
|
| [12] |
|
| [13] |
|
| [14] |
|
| [15] |
|
| [16] |
|
| [17] |
|
| [18] |
|
| [19] |
|
| [20] |
|
| [21] |
|
| [22] |
|
| [23] |
|
| [24] |
|
| [25] |
|
| [26] |
|
| [27] |
|
| [28] |
|
| [29] |
|
| [30] |
|
| [31] |
|
| [32] |
|
| [33] |
|
| [34] |
|
| [35] |
|
| [36] |
|
| [37] |
|
| [38] |
|
| [39] |
|
| [40] |
|
| [41] |
|
| [42] |
|
| [43] |
|
| [44] |
|
| [45] |
|
| [46] |
|
| [47] |
|
| [48] |
|
| [49] |
|
| [50] |
|
| [51] |
|
| [52] |
|
| [53] |
|
| [54] |
|
| [55] |
|
| [56] |
|
| [57] |
|
| [58] |
|
| [59] |
|
| [60] |
|
| [61] |
|
| [62] |
|
| [63] |
|
| [64] |
|