


基于Sentinel-1A的新疆阿克陶 MS6.7地震同震形变与滑动分布特征
[温少妍1)  , 单新建
, 单新建2)), * , 张迎峰2) , 刘云华2) , 汪驰升3) , 宋春燕1) ]
, 单新建, 张迎峰|
|


〔作者简介〕 温少妍, 女, 1985年生, 2018年于中国地震局地质研究所获固体地球物理专业博士学位, 高级工程师, 主要从事InSAR技术及其在地震科学中的应用研究, E-mail: wenshaoyan999@163.com。
文中利用Sentinel-1A升、 降轨数据获取了2016年新疆阿克陶地震的同震形变场。 形变场以水平运动为主, 形变主要发生于断层南盘; 升、 降轨最大形变量分别约为12cm和-21cm; 基于雷达影像观测右视成像的特点可知阿克陶地震具有右旋走滑的破裂特征, 结合形变场形态特征与余震剖面推断认为, 阿克陶地震的发震断层为S倾的木吉断裂。 基于均匀弹性半空间模型反演双断层面的静态滑动分布, 结果显示: 2个断层面上各存在1个椭圆状的滑动集中区, 破裂基本到达地表, 滑动主要发生在沿断层面走向长约50km、 沿断层面倾向方向0~20km的范围内, 最大滑动量位于约9km深处, 量级约为0.7m; 西段主要以走滑为主, 东段为走滑兼具少量正断性质, 反演得到的地震矩约为8.81×10¹⁸N·m, 相当于 MW6.57。 综合分析认为, 本次地震的震源特征为右旋走滑兼有少量正断分量, 是发生在公格尔拉张系内拉张环境下的构造地震事件。
, SHAN Xin-jian, ZHANG Ying-fengThe Aketao MS6.7 earthquake occurred on November 25, 2016, which was located at the intersection of Gongur extensional system and Pamir frontal thrust. This region is characterized by complex fault structure, high altitude, complex terrain conditions, sparsely populated and few observed data, so the conventional geodetic survey technology is difficult to obtain comprehensive surface deformation information, while InSAR can take advantage of its all-weather, all-day, large-area and high-density continuous monitoring of ground motion. Therefore, this study takes MS6.7 earthquake as the research object to carry out the co-seismic deformation field extraction and fault static slip distribution inversion. Firstly, the co-seismic deformation field was obtained by using ascending and descending data of Sentinel-1A. The results indicate that the interferogram spatial decorrelation is more serious in the north side of fault, which is affected by the steep terrain. The fringes in the south side of fault were distributed as elliptical semi-petal shapes, and the fringes are smooth and clear. The northern and southern part of the fault was asymmetric: The interferogram fringes of the southern part were dense while fewer fringes were formed in the northern part, and the fringes were semi butterfly-shaped on the surface. The horizontal displacements dominated the co-seismic deformation in this event, with magnitude of 12cm in ascending and -21cm in descending. The deformation occurred mainly on the south wall of fault. Based on the right view imaging of Radar, the co-seismic deformation is consistent with the movement features of dextral strike-slip fault and the focal mechanism provided by USGS and GCMT. The cross section of aftershocks after precisely positioning showed that the dip angle of fault is larger above the depth of 15km, which is generally manifested as the shovel-like structure with the dominant tendency of southward dip. By conducting a comprehensive analysis of deformation feature and aftershocks profile, we proposed that the southwest-dipping Muji Fault is the seismogenic fault. Secondly, a large area of continuous deformation images obtained by InSAR technology contains millions of data points and there is a high correlation between them. In order to ensure the calculation efficiency and inversion feasibility in the inversion process, the quadtree sampling method was used to reduce the number of data points and the datasets were finally obtained that can be received by the inversion system on the basis of retaining the original details of the deformation field. The two tracks InSAR datasets which were down-sampled by quadtree method were used to constrain the inversion to retrieve the fault geometry parameters and slip distribution. The single-segment and two-segment static slip distribution on the fault plane based on uniform elastic half space model were constructed during inversion process. The F-test of fitting residuals based on single-segment and double-segment fault model show that the population variance of the two models was significantly different at the confidence level of 95%, and the variance of the double-fault model was smaller. Through the comprehensive analysis of predicted deformation field, residuals and F-test, it is considered that the simulated results of double fault model are better than that of the single, and the observation data can be better interpreted. The result shows that the simulated co-seismic deformation field and its corresponding observed values were consistent in morphology and magnitude, and the correlation between observed and modeled is up to 0.99. In addition, as can be seen from the spatial distribution and frequency histogram of residuals, the overall residual was not large, mainly concentrated in the range of -0.2~0.2cm with the characteristics of normal distribution. However, there were still some larger residuals on the near fault in ascending track, which may be related to the simplified model. There were two patches with significant slip distribution on each segment and the rupture basically reached the surface. The slip was mainly distributed along the downdip range of 0~20km and was about 50km along the fault strike. The rupture reached the surface and the peak slip of 0.7m was at the depth of 9km. The western segment is dominated by the right-lateral strike-slip and the eastern segment is dominated by the right-lateral strike-slip with slightly normal faulting. The seismic moment derived from inversion was 8.81×10¹⁸N·m, which is equivalent to MW6.57. The average slip angle obtained by inversion is -175° in the west section and -160° in the east section. The synthetic analysis holds that the source characteristics of the MS6.7 earthquake was characterized by dextral strike-slip with a slightly normal component, which was composed of two sub-seismic events. The western section was basically pure right-lateral strike-slip with a dip angle of 75°, while the eastern was characterized by dextral strike-slip with a small amount of normal component with a dip angle of 55°. The Aketao earthquake occurred on the northern Pamir salient and its tectonic deformation was mainly characterized by crustal shortening, strike-slip and internal extension of the frontal edge observed by GPS. Generally speaking, the Pamir salient was blocked by nearly east-west South Tian Shan in the process of strong northward pushing under the action of NE direction pushing of Indian plate, and “hard and hard collision” occurred between them. The eastern part of Pamir salient extruded eastward along the nearly NS trending Gongur extensional system, and at the same time rotated clockwise, which caused the nearly EW extension since the Late Quaternary. The Aketao earthquake is a tectonic event occurring at Gongur Shan extensional system, which shows that the pushing of the Indian plate in the NE direction is continuously strengthened, and also implies that the internal crustal deformation of the Pamir Plateau is still dominated by extension in EW direction, which is basically consistent with the present observation of GPS.
InSAR技术可有效弥补地表破裂数据、 地震记录等提取震源参数的某些不足, 通过联系弹性位错理论与震源几何学及运动学参数, 能够较为准确地确定发震断层的几何特征和滑动分布。 地震震源的静态滑动分布反演本质上是震源参数的反演, 主要包括发震断层面的走向、 倾角、 长度、 宽度、 滑动角及滑动量等断层的几何结构学和运动学特征参数, 此前国内外学者在此领域已开展了大量研究工作(单新建等, 2002, 2015, 2017; Simons et al., 2002; 万永革等, 2008; Atzori et al., 2011; Feng et al., 2012; Jiang et al., 2013; 王永哲等, 2013; 郑博文等, 2018)。 地震震源参数不仅可用于分析发震断层的机制及区域构造应力状况, 同时也是研究断层破裂及扩展、 震后变形、 应力变化及未来地震危险性评估的重要基础。
2016年新疆阿克陶MS6.7地震发生在帕米尔高原东北部的公格尔拉张系与帕米尔前缘逆冲推覆系的交会部位, 该区域断裂构造复杂、 海拔高、 地势条件复杂、 人烟稀少、 观测资料少, 仅利用常规的大地测量技术难以获得全面的地表形变信息。 InSAR可全天候、 全天时、 大面积、 高密度地对地面运动变化进行连续监测, 适用于该区的研究工作。 本文拟以2016年新疆阿克陶MS6.7地震为研究对象, 开展同震形变场提取及静态断层滑动分布反演等工作。 首先, 基于差分干涉测量技术(D-InSAR), 以Sentinel-1升、 降轨InSAR数据为数据源, 获取阿克陶MS6.7地震的同震形变场, 并分析其形变特征; 然后, 基于Okada弹性位错模型反演断层面的滑动分布, 结合野外地质考察资料确定发震断层及其断层的几何学和运动学参数, 并分析阿克陶地震的震源性质、 发震断层的几何学和运动学特征。
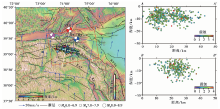
据中国地震台网中心测定, 2016年11月25日22时24分在新疆克孜勒苏柯尔克孜自治州阿克陶县发生6.7级地震, 微观震中为(39.20°N, 74.10°E), 宏观震中为(39.19°N, 74.17°E), 位于阿克陶县木吉乡。 极震区的地震烈度为Ⅷ 度, 等震线大致呈椭圆形, 长轴方向为NWW。 由于地震发生在高海拔地区, 人烟稀少, 故未造成重大人员伤亡。 不同机构(USGS、 GCMT和NEIC)给出的本次6.7级地震的震源机制类型均为走滑型(表1)。 地震发生在帕米尔构造结弧形前缘推覆构造上, 震中位于公格尔拉张系的木吉断裂附近(图 1)。 帕米尔构造结是印度板块向欧亚大陆碰撞的2个突出支点之一, 是中国大陆受板块动力作用最强烈、 地震活动最频繁的地区之一, 现今的构造变形以前缘地壳缩短和走滑、 构造结内部拉张的运动特征为主, 形成了一系列向N凸出的弧形活动构造带, 由喀喇昆仑断裂带(KF)、 公格尔拉张系(KES)、 主帕米尔逆断裂带(MPT)、 帕米尔前缘推覆系(PFT)等一系列弧形活动褶皱逆断裂带及其间的推覆构造组成(Sobel et al., 2013)。 这些构造带的强烈活动, 在构造结内部形成了一系列海拔高达4 500~7 700m的弧形山系和拉张盆地, 如公格尔峰和慕士塔格峰、 卡拉库尔与木吉-塔什库尔干盆地等; 并在构造结前缘形成了强烈沉陷的、 新生代沉积厚逾万m的新生代盆地, 如喀什-叶城盆地、 塔吉克盆地等。
| 表1 不同机构给出的震源机制解 Table1 The focal mechanism solutions from different institutions |
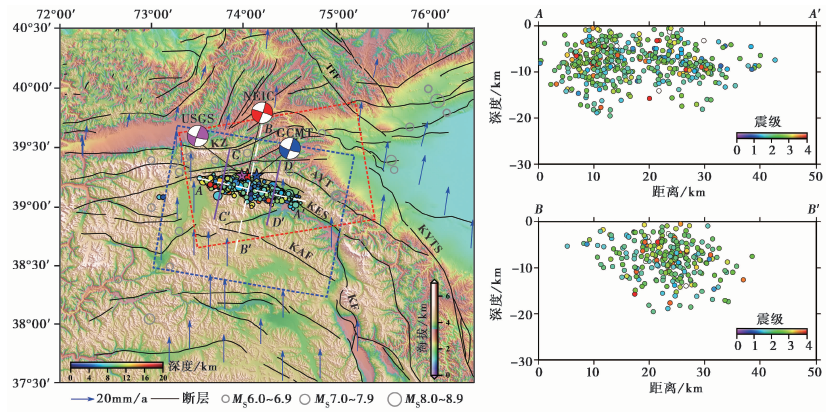 | 图 1 阿克陶地震的区域构造背景图 红色、 紫色、 蓝色五角星分别为中国地震局台网中心、 USGS、 GCMT给出的震中位置; 红色、 紫色、 蓝色沙滩球分别为中国地震局台网中心、 USGS、 GCMT给出的震源机制解; 彩色圆圈为余震精定位结果(数据来源于张旭等(2017)); GPS数据来自Zhou等(2016); 黑色实线为断层; 蓝色、 红色虚线分别为Sentinel-1A降、 升轨数据的覆盖范围; 绿色框线指示研究区在中国大陆的位置; 白色虚线为平行和垂直于断裂带的余震剖线。 KES 公格尔拉张系; KZ 卡兹克阿尔特断裂带; KF 喀喇昆仑右旋走滑断裂带; KXF 康西瓦断裂带; KYTS 喀什-叶城断裂带; TFF 塔拉斯-费尔干纳断裂带Fig. 1 The tectonic background of Aketao earthquake. |
| 表2 Sentinel-1A卫星的主要参数 Table2 The main parameters of Sentinel-1A satellite |
帕米尔弧形构造内部的活动变形分别以东部的公格尔山拉张系和西部卡拉库尔地堑的EW向拉张作用为主。 公格尔山拉张系长逾250km, 总体走向为NW-SE, 倾向W, 倾角为20°~45°(Robinson et al., 2004), 是一条全新世活动断裂(Li et al., 2012), 南起塔什库尔干盆地南部的达布达尔, 向N经塔什库尔干县城、 塔合曼、 慕士塔格峰西麓、 公格尔山西麓、 布伦口—木吉盆地, 控制了其西侧的木吉、 布伦口、 塔合曼和塔什库尔干4个断陷盆地的发育。
Sentinel-1A卫星可获取全天候、 全天时的雷达数据, 为地质灾害和地表形变的监测及评估提供了丰富的数据源。 该卫星采用C波段, 图像分辨率最高可达5m, 具有4种不同的观测模式(Interferometric Wide Swath, IW; Extra Wide Swath, EW; Strip Map, SM; Wave Mode, Wave), 前3种观测模式可以使用4种不同的极化方式(HH、 VV、 HH+HV和VV+VH), 而Wave模式只能使用HH或VV模式中的一种; 同时, HH和HH+HV极化方式主要应用于极地与海冰区域, 而VV和VV+VH极化方式主要在大陆地区使用。 Sentinel-1卫星将包含2颗子卫星, 即Sentinel-1A和Sentinel-1B, 其共享一个轨道, 单颗卫星的运行周期为12d, 双星的运行周期为6d, 在赤道地区的重访频率为3d, 而在高纬度地区的重访频率仅约1d。 表3所示为该卫星的主要参数。
| 表3 卫星干涉影像参数 Table3 The basic parameters of interferometric images |
本研究中使用了干涉宽模式(IW)的Sentinel-1A升、 降轨数据(表3), 该成像模式采用先进的TOPSAR(Terrain Observation with Progressive Scans SAR)技术, 所拍摄的雷达影像幅宽达250km, 空间分辨率保持为2m×14m(Single look), 单幅SLC影像由3个子条带组成, 相邻的子条带之间有一定的重叠区; 每个子条带由多个影像块组成, 影像块数据条在方位向和距离向也都有一定的重叠区域。 在获取数据时, 天线的光束会在不同的子条带间进行扫描, 从而产生很大的幅宽(250km); 同时也会持续获取方位向的影像块, 使得方位向的观测范围大大增加。 IW模式数据的高宽度模式使得卫星的重访周期大大减少, 同时提高了方位向的分辨率。
Okada模型具有简单明了、 计算速度快、 应用广泛的特点, 是解析解模型的典范, 目前已成功地应用于众多震例的研究工作中。 本文基于Okada弹性半空间模型讨论断层面上的滑动分布。 反演的基本思路是将断层面模型离散成一系列均匀或非均匀的矩形元或三角元, 同时对离散化的各个子单元间的滑动量施加一定的光滑约束, 最后采用约束条件下的最小二乘法及最速下降法得到断层面的滑动分布。 断层的运动方式可通过断层参数表达。 Okada位错模型中的待解参数有9个, 可分为2类: 一类是断层的几何学参数, 包括断层长度L和宽度W、 断层起始点的经纬度(E, N)、 断层深度d、 断层倾角dip和走向strike; 另一类是运动学参数, 主要指断层滑动量U及滑动角rake。 首先建立函数模型, 即描述待解参数与地表形变场观测数据之间数学关系模型, 根据Okada(1985)给出的各向同性弹性半空间介质中的矩形位错模型解析解的表达式, 建立函数模型:
其中, d为地表观测值; S(x)为每个子断层的断层参数, x为子断层编号; ε 为观测误差; G是根据Okada位错模型和断层参数计算得到的格林函数矩阵, 描述了地球介质的传播效应以及台站响应信息。 通常情况下, 为了降低反演的难度, 可根据先验信息(USGS、 CMT等机构给出的震源机制解或野外地质调查结果)或初步反演确定断层的几何参数, 此时可将非线性问题转化为线性问题, 则滑动分布的反演待求参数S(x)仅包含滑动量U。
采用附加约束条件的最小二乘法拟合滑动矢量, 即在经典最小二乘法的基础上施加光滑约束的限制, 目的是为了避免滑动分布的非物理性跳跃, 使滑动模型中的应力降分布或者滑动分布具有一个合适的粗糙度, 则反演问题就成为一个由数据拟合残差和光滑因子组成的目标函数最小化问题(张国宏, 2011), 其数学表达式为
式中, d为观测数据矩阵; d0为InSAR数据集的静态偏移量; s为断层面上的滑动量; β 2为光滑因子; H为拉普拉斯算子, ‖ Hs‖ 表示对滑动粗糙度的量度; G为描述观测值和模拟值间关系的格林函数, 分为弹性半空间与分层的弹性半空间2类, 对于均匀弹性半空间模型, 对泊松比进行假设后, 可利用Okada(1985)给出的解析解公式计算得出。
基于GAMMA软件处理得到Sentinel-1A升、 降轨InSAR同震形变场。 值得注意的是, TOPS成像模式引起的SAR影像方位向多普勒频率变化较大, 在数据处理过程中要求较高的配准精度, 故除精密轨道数据外还采用了DEM辅助的影像配准过程, 基于亚像素追踪方法迭代精炼, 最终实现的配准精度优于0.001个像素(刘云华等, 2018)。
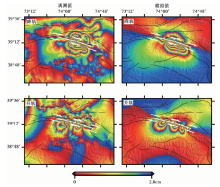
从最终得到的视线向(LOS)的升、 降轨同震形变场及跨断层剖面图(图 2, 3)可以看出, 干涉条纹沿木吉断裂展布, 断裂北盘由于地形陡峭导致图像空间失相关较为严重, 但仍可以看到大致的形变范围; 断层南盘的条纹呈椭圆形花瓣状分布, 条纹清晰密集。 断层2盘在地表形成了一个近似半蝴蝶状的地表形变场, 形变主要发生在南盘的东、 西2个 “ 花瓣” 上, 南盘的形变量远大于北盘。
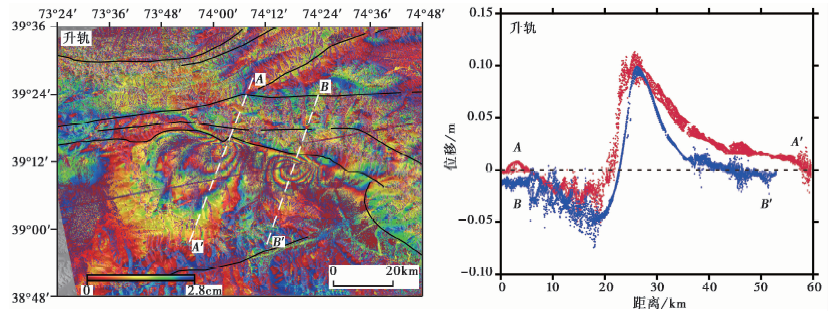 | 图 2 升轨D-InSAR视线向形变场及跨断层剖面图Fig. 2 Coseismic displacement field from ascending data in line-of-sight direction and its cross section. |
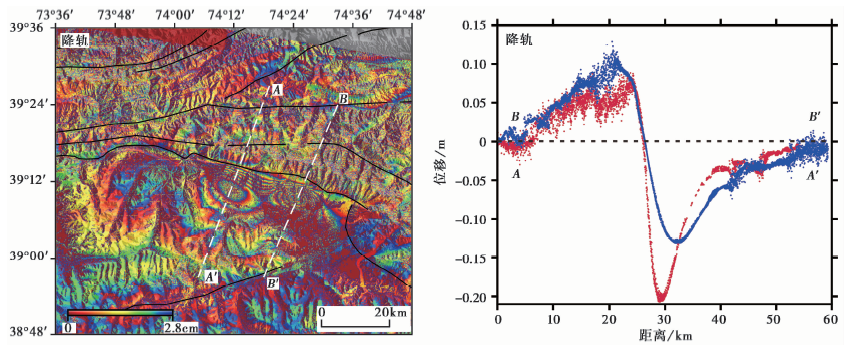 | 图 3 降轨D-InSAR视线向形变场及跨断层剖面Fig. 3 Coseismic displacement field from descending data in line-of-sight direction and its cross section. |
从跨断层剖面可以看出, T027升轨的花瓣状形变为正值, 表明该运动的方向朝向雷达传感器, 最大形变约为12cm; T107降轨的花瓣状形变为负值, 表明该运动的方向远离雷达传感器, 最大形变约为-21cm。 这种升、 降轨干涉图像呈相反形变态势表明地震造成的地表形变以水平形变为主(季灵运等, 2017)。 此外, 结合雷达观测右视成像的特点, 可推断断层南盘相对北盘向W运动, 表现为右旋走滑, 这与USGS、 GCMT给出的震源机制结果较为吻合, 已有研究成果(Wang et al., 2017; 刘云华等, 2018)也认为阿克陶地震为右旋走滑特征。 根据断层南、 北2盘条纹的密集程度来看, 形变主要发生在断层南盘, 可初步判断发震断层为S倾。 另外, 余震精定位跨断层剖面BB'、 CC'和DD'的结果表明(图 1, 4), 断层的倾角在深度15km以浅较大, 总体表现为上陡下缓的铲状结构分布, 优势倾向为S倾, 这与孔祥燕等(2017)的结果较为吻合。 综合分析认为, 阿克陶6.7级地震的发震断层为高倾角S倾的右旋走滑断层, 这与木吉断裂的性质一致。
 | 图 4 余震跨断层剖面图Fig. 4 Cross section of aftershocks. |
通过InSAR技术可获取大面积的连续形变场。 对于250km×250km范围的SAR影像而言, 其图像上的点位数量高达数百万量级, 如此海量的观测数据全部参与反演是不现实的, 更是没有必要的, 原因在于: 1)普通计算机系统无法承受海量数据的计算量; 2)InSAR数据点位之间的相关度较高, 存在一定程度的大气干扰等系统误差; 3)过多的数据点可能会出现反演难以收敛的问题。 因此, 考虑到计算系统的限制和InSAR数据点位之间存在高相关性, 为保证反演的计算效率和可行性, 需要对干涉形变场进行降采样, 目的是在保留形变场原有细节的基础上减少数据点位, 最终获得可以被反演系统所接受的数据集。
因此, 降采样方法成为反演过程的重要步骤之一。 本研究中使用的降采样方法是四叉树采样, 其基本思想是以视线向的形变量变化梯度, 即待采样区域内形变最大值与最小值之差的绝对值为目标函数, 如果采样区内的形变梯度大于给定阈值时将区域分割成4个小块继续搜索, 直到各区域内的形变梯度小于给定阈值则结束搜索。 此方法可以在形变梯度大的近场区域采集到相对密集的数据点, 同时也可以在形变梯度小的远场区域采集到相对稀疏的点位, 在保证有效保留形变场细节信息的基础上, 不会忽略远场形变带来的信息。 图 5 为升、 降轨InSAR数据经降采样后的结果。
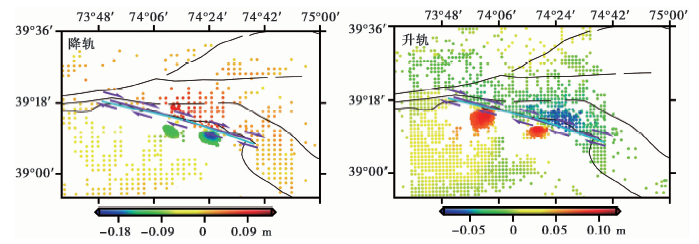 | 图 5 四叉树采样后的升、 降轨数据点位分布 紫色线为单断层模型的地表迹线; 青色线为双断层模型的地表迹线Fig. 5 Data spatial distribution from Quadtree sampling. |
本研究中首先基于矩形位错模型采用非线性反演方法确定发震断层的几何参数, 然后通过线性反演方法计算断层面上的分布式精细滑动分布。 具体做法是: 结合InSAR同震形变场的形态特征、 震源机制解、 余震精定位结果及先存断裂的分布情况确定发震断裂的走向、 倾向、 断层位置等参数后, 采用 “ 前向模拟” 的方式模拟干涉形变图, 并与观测形变场进行对比不断调整断层参数, 最终得到最佳的断层几何参数, 最后将其作为线性反演的参数计算断层面上的滑动分布。
按照Aki(1980)传统的断层约定, 确定起点和终点位置后即可确定断层的走向。 将断层模型的起始参考点设为(39.311°N, 73.862°E), 断层面长68km, 宽20km, 断层走向为106°, 即可确定断层的地表迹线(图 6 中的白色迹线)。 从得到的模型形变场可以看出, 模拟得到的阿克陶地震的同震形变场与其相应的观测值在形态和量级上具有较好的一致性, 观测数据与模型的相关度为0.98, 数据拟合效果较好。 残差空间分布图及频度直方图(图 7)显示, 拟合残差集中分布在-0.25~0.25cm范围内, 且具有正态分布的特征, 然而在近断层处仍存在较大的残差, 尤其对于降轨数据, 最大残差约为10cm, 说明单断层模型不能很好地解释观测数据。
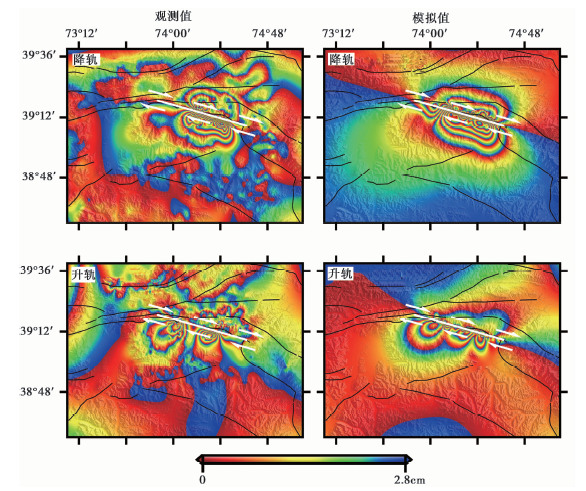 | 图 6 单断层模型的升、 降轨观测值与模拟值Fig. 6 Observation and simulation based on single fault model. |
 | 图 7 单断层升、 降轨残差空间分布及频度直方图Fig. 7 Residual and its frequency histogram. |
断层面滑动分布结果显示(图 8), 断层面存在东、 西2个椭圆状的滑动集中区, 破裂基本到达地表, 滑动分布主要发生在沿断层面走向长约50km、 沿断层面方向0~20km的范围内, 最大滑动量约为0.8m, 深约7km, 平均滑动角约为-168°, 表明该地震事件的震源特征为右旋走滑兼有少量正断分量。 依据该滑动分布模型得到的地震矩约为10.04×10¹⁸N·m, 相当于MW6.62。
 | 图 8 单断层模型断层面的滑动分布Fig. 8 Estimated slip distribution of the single fault model. |
综合考虑同震形变场形态及余震沿走向和倾向的分布特征, 我们构建了双断层模型进行滑动分布反演工作, 基于刘云华等(2018)的研究成果不断地进行参数调整, 最终得到的双断层模型的具体参数如表4所示。
| 表4 阿克陶地震的震源参数 Table4 Source parameters of the Aketao earthquake |
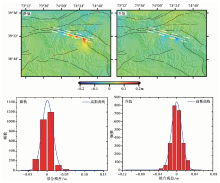
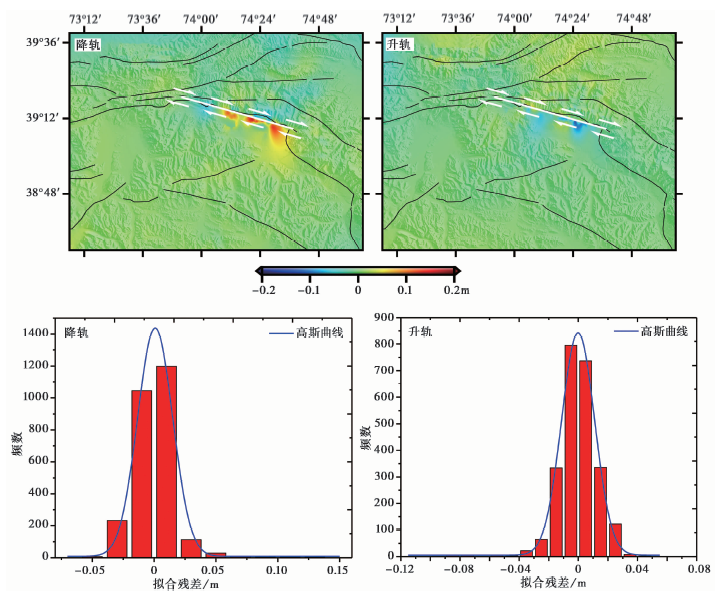
双断层模型的观测值和模拟形变场结果显示(图 9), 模拟得到的阿克陶地震的同震形变场与其相应的观测值在形态和量级方面一致性较好, 观测数据与模型的相关度为0.99, 数据拟合效果较单断层模型好。 此外, 从残差空间分布及频度直方图(图 10)可以看出残差整体不大, 主要集中在-0.20~0.20cm范围内, 具有正态分布的特征, 然而升轨数据近断层处仍存在较大的残差, 可能与构建的断层模型相对简单有关。
 | 图 9 双断层模型的升、 降轨观测值与模拟值Fig. 9 Observation and simulation based on double faults model. |
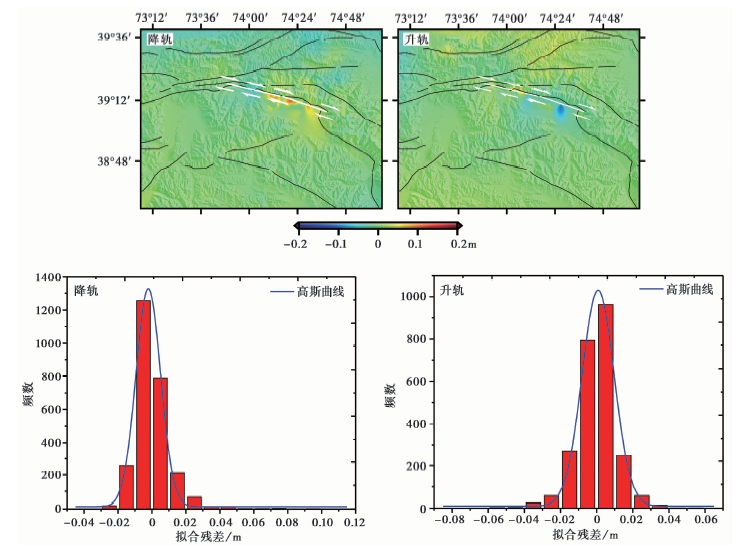 | 图 10 双断层升、 降轨残差的空间分布及频度直方图Fig. 10 Residuals based on double faults model and its frequency histogram. |
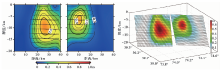
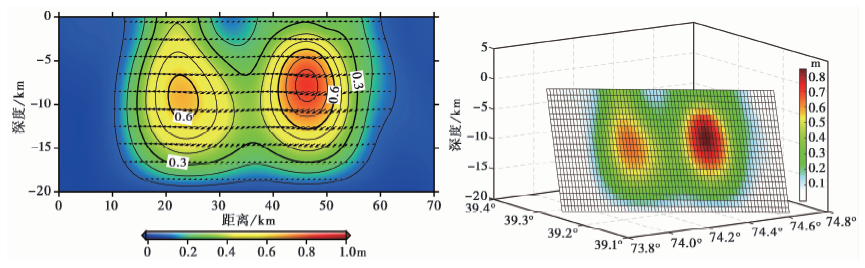
断层面滑动分布结果显示(图 11), 2个断层面内各存在一个椭圆状的滑动集中区, 破裂基本到达地表, 滑动分布主要发生在沿断层面走向长约50km、 沿断层面方向0~20km的范围内, 最大滑动量约为0.7m, 深约9km, 西段的平均滑动角约为-175°, 东段的平均滑动角约为-160°, 表明该地震事件的震源特征为右旋走滑兼有少量的正断分量。 依据该滑动分布模型得到的地震矩约为8.81×10¹⁸N·m, 相当于MW6.57。
 | 图 11 双断层模型的断层面滑动分布Fig. 11 Estimated slip distribution of the double faults model. |
本研究利用Sentinel-1卫星的升、 降轨数据获取了阿克陶地震的同震地表形变场, 同时以四叉树采样后的InSAR数据为约束, 基于Okada模型联合反演了发震断层的非均匀滑动分布, 得到以下结论:
(1)确定发震断层: 基于Sentinel-1A升、 降轨数据得到2016年阿克陶地震的InSAR同震形变场, 结果显示, 阿克陶地震的同震形变场以水平运动为主, 形变主要发生在断层南盘, 升、 降轨最大形变量分别约为12cm和-21cm, 结合雷达右视成像的特点分析认为, 阿克陶地震表现为右旋走滑破裂的特征; 此外, 根据形变场的形态特征及余震剖面推断认为, 阿克陶地震的发震断层为公格尔拉张系内S倾的木吉断裂带。
(2)确定震源性质: 单一分段模型和双分段模型的拟合残差F检验结果显示, 在置信度95%水平下, 2种模型的总体方差显著不同, 双断层模型的总体方差较小, 结合模拟得到的形变场、 残差频度直方图分析认为, 双断层模型的模拟结果要优于单断层模型, 前者可以更好地解释观测数据。 反演结果显示破裂基本到达地表, 滑动分布存在东、 西2个椭圆状的滑动集中区, 反演得到的东、 西段的平均滑动角分别为-160°和-175°。 综合分析认为, 阿克陶地震的震源性质整体表现为以右旋走滑特征为主兼少量正断性质, 由2次子地震事件组成, 西段基本为纯右旋走滑, 倾角为75°, 东段为右旋走滑兼少量正断分量, 倾角为55°。
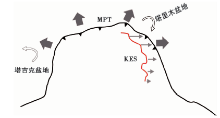
(3)阿克陶地震发生在帕米尔构造结的东北部, 现今GPS观测资料显示构造变形以前缘地壳缩短和走滑、 内部拉张的特征为主。在印度板块NE向推挤作用下, 帕米尔构造结向N强烈推挤过程中受到近EW向南天山阻挡, 两者发生 “ 硬硬碰撞” , 帕米尔构造结东部沿近SN向公格尔拉张系发生向E的侧向挤出, 同时发生顺时针旋转, 导致了公格尔拉张系晚第四纪以来的近EW向拉张(图 12), 阿克陶地震即在这种拉张构造环境下发生。 以上分析表明印度板块的NE向推挤作用在持续增强, 同时也表明帕米尔高原内部的地壳变形仍以近EW向拉张作用为主, 这与现今GPS的结果基本一致。
 | 图 12 公格尔拉张系晚第四纪的近EW向拉张作用模式(据李文巧, 2013修改) KES 公格尔拉张系; MPT 主帕米尔逆断裂带Fig. 12 East-west extension of Kongur in Late Quaternary(modified from LI Wen-qiao, 2013). |
已有研究表明, 中强地震的发生会引起断层面和震源区附近断层上的应力变化, 进而影响区域地震活动性的变化(Pinar et al., 2001)。 在距离本次阿克陶6.7级地震约60km处发生了2018年12月20日阿克陶5.2级地震, 2个地震之间具有怎样的联系值得我们思考。 为了探讨2016年和2018年2次地震的关系, 采用Coulobm 3.3软件计算库仑应力的变化, 假定剪切模量为3.2×10⁴MPa, 等效摩擦系数为0.4, 泊松比为0.25, 计算得到的2016年地震在2018年地震发震断层(走向107°, 倾角76°, 滑动角174°)上所引起的不同深度处的库仑应力变化如图 13 所示。 不同深度库仑应力变化的水平剖面显示, 2018年地震位处于应力加载区域, 库仑应力的加载量约为0.2bar, 具有一定的库仑应力触发效应。 因此, 分析认为2016年地震的发生促进了断层破裂, 从而 “ 触发” 了2018年地震。 此外, 值得注意的是, 无论是单一断层模型还是双断层模型的静态滑动分布结果均显示, 在断层浅部存在1个长5~6km的同震滑动亏损区, 而且在2个库仑应力卸载区存在1个显著的库仑应力加载区, 加载量远高于0.5bar, 这可能是未来中强地震的危险区。
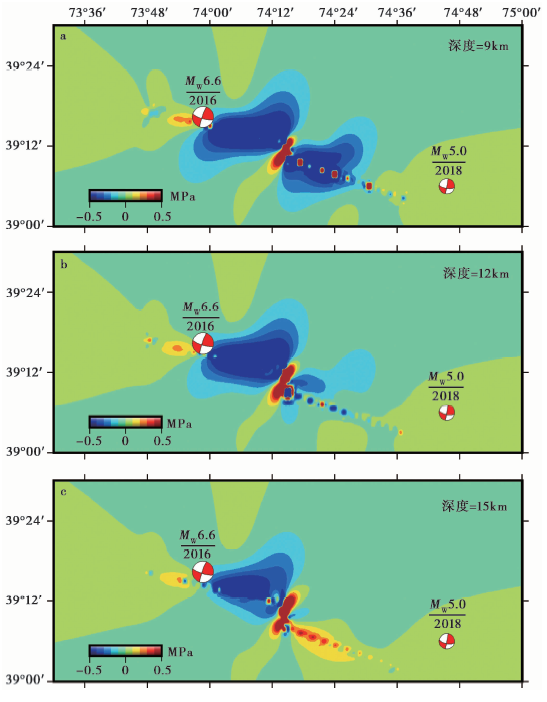 | 图 13 2016年阿克陶地震引起的静态库仑应力变化Fig. 13 Coulomb stress change caused by the 2016 Aketao earthquake. |
| [1] |
|
| [2] |
|
| [3] |
|
| [4] |
|
| [5] |
|
| [6] |
|
| [7] |
|
| [8] |
|
| [9] |
|
| [10] |
|
| [11] |
|
| [12] |
|
| [13] |
|
| [14] |
|
| [15] |
|
| [16] |
|
| [17] |
|
| [18] |
|
| [19] |
|
| [20] |
|
| [21] |
|
| [22] |
|
| [23] |
|
| [24] |
|