


基于偏度的地震热红外异常提取
[刘文宝1)  , 孟庆岩
, 孟庆岩2)), * , 张继超1) , 张颖2) , 卢显3) , 孟亚飞2) ]
, 孟庆岩, 张继超|
|


〔作者简介〕 刘文宝, 男, 1993年生, 2017年于辽宁工程技术大学获测绘工程专业学士学位, 现为辽宁工程技术大学测绘工程专业在读硕士研究生, 研究方向为地震热红外遥感, E-mail: 1092410795@qq.com。
地震热异常的存在已被大量震例研究所证实, 但天气仍是热异常精细提取的限制因素。 为此, 文中在提取热异常时先采用时间域差值, 后计算空间域差值以去除天气因素的影响; 引入偏度异常数据监测算法, 针对不同样本数选择不同阈值判断热异常。 基于以上新算法分析了2016年12月8日呼图壁 MS6.2、 2017年8月8日九寨沟 MS7.0和2017年8月9日精河 MS6.6地震的热异常时空分布情况。 结果表明: 1)先采用时间域差值、 后计算空间域差值将减少云对温度空间分布差异造成的热异常假象; 2)在样本数满足异常判断需求的前提下, 当背景场数量发生变化时, 不同样本数对应不同阈值的热异常面积基本不变, 热异常判断阈值的稳定性更强; 3)九寨沟 MS7.0地震的震前热异常整体围绕震中从NW军功断裂向NE陇县-宝鸡断裂以顺时针移动; 呼图壁 MS6.2地震的震前热异常从南往北整体向震中移动; 精河 MS6.6地震的震前热异常整体从NW的塔斯特-巴尔雷克断裂附近向震中移动且呈条状; 4)分析多年热异常与地震间的关系发现, TPR随震级的增大升高, 即震级越高则震前发生地震热异常的概率越大, 该发现对未来地震预报具有重要意义。
The seismic thermal anomaly has been confirmed by a large number of earthquake case studies, but the weather factor is still the limiting factor for the fine extraction of thermal anomalies. In the past, in order to eliminate the short-term noise of meteorology, the spatial domain difference value was used to replace the temperature value in the original remote sensing image, but the cloud mask will affect the spatial domain mean value, which makes the spatial domain difference value not representative. This causes thermal anomalies due to differences in cloud masks and spatial distribution of temperature. In previous RST studies, the thermal anomaly thresholds were judged to be different values of 1.6, 2, 3, and 4, and there was no stable value. When the number of background fields changes under the same threshold, the thermal anomaly area will change. Therefore, when constructing the background field, the time domain difference is used first and then the spatial domain difference is calculated to remove the weather influencing factors. By introducing skewness abnormal data monitoring algorithm, different sample numbers correspond to different thresholds in thermal abnormality judgment. In this experiment, the areas of 32.70°~42.72°N and 96.37°~106.65°E in Gansu, Qinghai and Sichuan were used as the study area. The new algorithm is used to analyze the spatial and temporal distribution of thermal anomalies in Hutubi MS6.2 earthquake on December 8, 2016, Jiuzhaigou MS7.0 earthquake on August 8, 2017, and Jinghe MS6.6 earthquake on August 9, 2017. Statistical analysis is made on the statistical relationship between earthquakes of magnitude 4 and above and thermal anomalies in the study area from January 1, 2003 to August 31, 2019. Experiments and results show that: 1)By analyzing the annual mean surface temperature map in 2004, it was found that the night temperature in Qinghai Province in the study area was lower than that in other areas, and the night temperature in the southern Gansu and desert areas in the northeast of the study area was relatively high. On June 26, 2004, most of the cloudless images were in the low-temperature region of Qinghai Province, which resulted in a low average value of the spatial domain. The temperature difference between the high-temperature and cloudless regions of Qinghai Province and Gansu Province was relatively large, so the spatial domain difference caused the false thermal anomalies. The difference in time domain is calculated before calculating the difference in spatial domain, and the thermal anomaly almost disappears. Using the difference in time domain and then calculating the difference in spatial domain will eliminate the false thermal anomaly caused by the difference in temperature and spatial distribution of clouds. 2)Through experiments, it is found that the skewness in different sample numbers used in this paper corresponds to different thresholds and the position and area of thermal anomalies are closest when the RST threshold is 4.5. When the RST is at a threshold of 4.5 and the number of background fields is 12, 14, and 16, respectively, the thermal anomaly area becomes smaller as the number of background fields increases, but for the skewness of different thresholds corresponding to different sample numbers in the background when the number of fields is 12, 14, and 16, respectively, the change in thermal anomaly area is small. It is obtained that under the premise that the number of samples satisfies the abnormality judgment, different sample numbers corresponding to different thresholds will basically keep the thermal anomaly area unchanged when the number of background fields changes, and the thermal anomaly threshold judgment stability gets stronger. 3)By extracting the thermal anomalies of Hutubi MS6.2 earthquake on December 8, 2016, Jiuzhaigou MS7.0 earthquake on August 8, 2017, and Jinghe MS6.6 earthquake on August 9, 2017, it was found that the thermal anomaly before the Jiuzhaigou MS7.0 earthquake moved around the epicenter from the northwest Jungong Fault to the northeast Longxian-Baoji Fault in a clockwise direction; Before the Hutubi MS6.2 earthquake, the whole thermal anomaly moved from south to north to the epicenter; Before the Jinghe MS6.6 earthquake, the overall thermal anomaly moved from the vicinity of the northwest Tuster-Ballake Fault to the epicenter and was “/” shaped. 4)There were 210 earthquakes with MS≥4.0 in the study area, and a total of 98 thermal anomalies occurred. The total number of thermal anomalies corresponding to the earthquake is 46, accounting for 46.94%; the number of earthquakes with thermal anomalies found in 210 earthquakes is 53, accounting for 25.2%, among them, 73.6%were preceded by thermal anomalies. By analyzing the relationship between thermal anomalies over the years and earthquakes, it is found that the TPR value increases with the magnitude of earthquake. Although the number of strong earthquakes in the study area is small and the TPR value of strong earthquakes in this experiment is not representative, the overall trend shows that the probability of earthquake thermal anomalies increases with the increase of the earhtquake magnitude. The greater the probability of occurrence of seismic thermal anomalies during strong earthquakes, the greater the significance is for future earthquake prediction. In this paper, we use two types of data, cloud and surface temperature, to optimize the algorithm to remove the influence of weather factors on seismic thermal anomalies. However, the influence of topography and ground features on temperature still exists, and there is currently no good way to judge and rule it out.
中国是受地震危害最严重的国家之一。 1976年7月28日MS7.8唐山大地震和2008年5月12日MS8.0汶川大地震造成了重大人员伤亡和损失, 故开展地震监测预报极其重要(Guo et al., 2010; Freund, 2011; Song et al., 2018)。 自1988年前苏联学者发现中亚及东地中海地区在震前出现大面积遥感热红外异常以来, 与地震相关的热红外异常引起了地震和遥感领域学者的关注(Gorny et al., 1988)。 震前热异常的发现为地震监测增加了一种可参考手段, 提高了未来精确预报地震的概率。
震前热异常产生的机理主要有: 1)地球放气说(气热说), 即地震前在应力作用下出现的大量微裂隙逸出不同的气体(N2、 CO2、 CH4等)受到电场作用而产生红外异常现象(强祖基等, 1992); 2)温室气体效应, 即认为震前大气静电异常对大气的极化作用和震前逸出温室气体的 “ 温室效应” 是导致热红外异常出现的重要因素(徐秀登等, 2001); 3)岩石摩擦热效应(应力致热说), 吴立新等(2004a, b)通过岩石实验测得应力-应变-温度之间的响应关系, 认为震前断层的表面温度场与应力水平、 摩擦面两侧岩性及其粗糙度等相关。 许多学者通过遥感手段发现了震前热异常现象。 陈梅花等(2011)发现2010年2月27日智利MS8.8地震前出现了3次潜热通量异常; 魏乐军等(2008)基于FY-2C数据对2008年汶川地震开展了相关研究并发现了热红外异常现象; 孙珂等(2017)监测到2015年4月25日尼泊尔MS8.1地震震前10d地震热异常从出现到消失的过程; Ma等(2018)、 马未宇等(2018)利用NCEP数据分析了2005年11月26日九江MS5.7和2001年11月14日昆仑山MS8.1地震震前的垂直分层热异常特征。
地震热红外异常提取算法最初只是简单的图像目视解译, 虽然简单易懂, 但未能综合考虑天气、 地形以及季节性变化等因素的影响, 异常判别较为困难(孙珂, 2017)。 随着地震-遥感领域研究的进展, 目前地震热红外异常提取算法根据原理不同大致可分为3类, 即基于差值分析、 信号分析和背景场分析的异常提取算法(宋冬梅等, 2016)。 康春丽等(2003)对昆仑山口西2001年11月14日MS8.1地震前后和2001年11月3日GMS-5卫星的亮温值进行了差值处理, 发现震前7d出现亮温的异常增强; 陈梅花等(2007)通过断裂带内、 外差值分析方法对2000年1月15日MS6.5姚安地震开展了相关研究, 发现在异常阶段断裂带内、 外的温差达3℃以上, 比正常时段高2℃。 基于差值分析的异常提取算法实现原理简单, 但难以消除季节性时间漂移造成的影响(宋冬梅等, 2016)。 Guo等(2010)基于长波辐射(Outgoing Longwave Radiation, OLR)数据, 利用功率谱法对中国发生的5次6.5级以上地震进行了分析, 得到了震前OLR红外异常特征幅值和特征周期; Zhang等(2010)利用小波变换方法基于FY-2C数据获得了汶川地震震前的热异常信息。 基于信号分析的异常提取算法可有效分解红外辐射信号, 但其原理解释有待加强(宋冬梅等, 2016)。 Eleftheriou等(2016)基于背景场分析的RST(Robust Satellite Technique)算法统计了2004—2013年希腊长时间序列的地震热异常信息, 并利用影像像元对研究区的亮度温度做空间域均值的差值代替原始温度值以消除气象噪声。 但云掩膜后的亮度温度空间域均值与真实的亮度温度空间域均值存在差异, 前者并不能代替后者。 虽然其将含云量> 80%的数据去除, 但不能从根本上解决问题。
本文针对背景场分析算法的一些不足, 将偏度异常数据监测算法引入地震热红外异常提取中。 针对云覆盖导致影像缺失、 使空间域均值不具有空间代表性的问题, 本文提出了一种新的温度替代值以减小云掩膜对温度空间分布差异造成的影响。 在以往的RST研究中, 热异常判断阈值没有一个稳定的值, 可设为1.6(宋冬梅等, 2016)、 2(Zhang et al., 2019)、 3(孙珂等, 2017)或4(Eleftheriou et al., 2016)等不同值。 本文针对以往研究中阈值设置的不稳定性, 在基于偏度算法提取异常时, 提出根据不同背景场样本数设置不同阈值以进行异常值判断。 进而基于新算法分析了2016年12月8日呼图壁MS6.2、 2017年8月8日九寨沟MS7.0和2017年8月9日精河MS6.6地震的热异常信息, 以甘肃、 青海及四川等地区为主要研究区域, 分析了热异常和地震之间长时间序列统计的相关性。
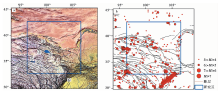
本文的研究范围为32.70°~42.72°N, 96.36°~106.65°E, 区内包含鄂拉山断裂、 青海南山-循化南山断裂、 祁连山北缘断裂、 玛多-甘德断裂以及东昆仑断裂等断裂带(图1a)。 研究区附近的龙门山断裂带位于重力异常变化强烈的梯度带上(图1b), 相对而言, 研究区内地震带布格重力异常变化相对较小, 发生地震的频率相对较低(王椿镛等, 2015)。 因此, 当统计分析热异常与地震之间长时间序列的相关性时, 可减少一个热异常对应多个地震的现象。
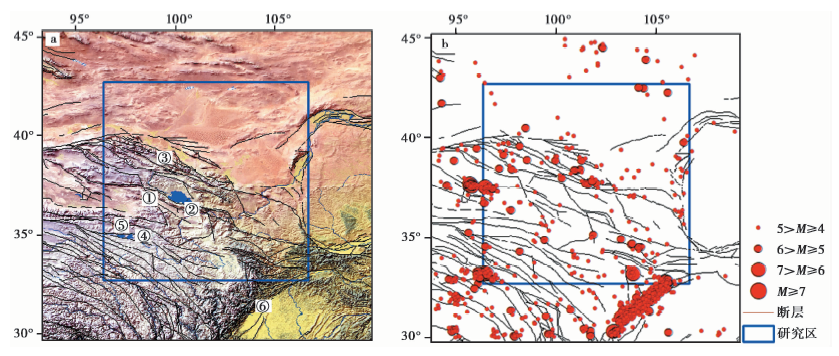 | 图 1 研究区断裂带分布(a)及研究区和周边15°×15°地震空间分布(b) ①鄂拉山断裂; ②青海南山-循化南山断裂; ③祁连山北缘断裂; ④玛多-甘德断裂; ⑤东昆仑断裂; ⑥龙门山断裂Fig. 1 The distribution of fault zones in the study area(a)and the spatial distribution of earthquakes in the 15°×15° area of the study area and its surroundings(b). |
选取2003年1月1日—2019年8月31日甘肃、 青海和四川等地区32.70°~42.72°N, 96.37°~106.65°E范围内的MODIS数据进行热异常提取。 由于白天的地表温度受太阳辐射影响严重, 故使用夜间的MODIS地表温度(Land Surface Temperature, LST)产品(MYD11A1)进行分析。 MYD11A1第6版产品搭载在美国Aqua卫星上, 提供1 000m空间分辨率的每日每像素地表温度, 在夜间经过研究区的时间为凌晨2点31分(刘三超等, 2006)。 同时, MYD11A1对应的夜间云层位置处已掩模为空值, 以剔除遥感卫星接收到的云热红外信息对地表温度的影响。
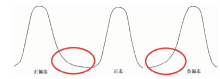
偏度可衡量背景场样本分布的不对称性, 是相对于背景场平均值不对称程度的度量值(图 2)。 出现地震热红外异常时偏度为正(正偏), 即背景场样本分布的右侧尾部比左侧长。 偏度的计算公式(中华人民共和国国家质量监督检验检疫总局等, 2008)为
式中, n为2003—2019年期间研究区像元(x, y)位置的有效个数, t为365d内的第t天,
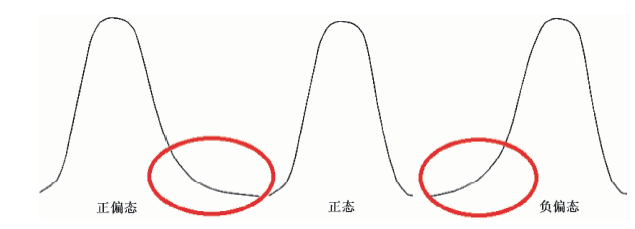 | 图 2 数据分布的偏态特征Fig. 2 Skewness of the data distribution. |
背景场的构建需剔除外界对温度的影响, 如云干扰、 气候短期变化及背景场影像在像元
由于卫星探测器无法接收云层以下的地表温度辐射信息, 故首先要去除云的干扰。 不同卫星数据有不同的云掩膜产品, 本研究选择MODIS数据(MYD11A1)的LST产品, 其为去云后的数据, 在此基础上还需对云层周边9×9的80个像元值进行掩膜以剔除云对周边温度的影响。
为消除气候变化或季节性时间漂移等问题, 需将影像像元
式中,
此外, 需通过迭代去除背景场中的异常值, 即去除背景场中的负偏态及正偏态值(式(4))。 当背景场样本
在理想状态下, 通过式(3)即可判断异常信息。 但由于气象变化的复杂性, 往往需要基于多年的同期数据通过统计提取热异常信息。 剔除背景场异常值后的有效温度差值为
将式(5)的结果值在式(1)中展开可得:
(1)B≥ 偏度异常判断准则阈值k(表1);
| 表1 偏度异常值监测阈值表 Table1 Threshold skewness monitoring threshold table |
(2)在1°×1°范围内的聚集异常面积至少为150km2;
(3)第1次异常出现后7d内至少再出现1次, 且2次异常地理位置相同或相近;
(4)热异常出现在震前30d或震后15d(Eleftheriou et al., 2016)(时间窗口);
(5)热红外异常内点到震中距离最短应< R=1
满足(1)、 (2)和(3)时表示有热异常发生, 同时满足(1)—(5)时表示有地震热异常发生。
4.1.1 差值对比
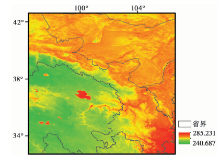
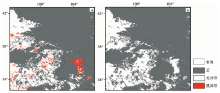
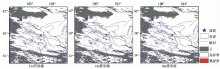
由于云掩膜影像像元造成的空间域差值不具代表性, 本文提出先计算时间域差值、 后计算空间域差值的方法以消除云对温度空间分布的影响。 通过如下实验分析新差值(式(3))与空间域差值相比在热异常提取中所具有的优势。 图 3 为2004年的LST年均值图, 研究区内青海省的夜间温度低于其他地区, 甘肃南部和研究区NE向沙漠地区的夜间温度相对较高。 图4a为2004年6月26日偏度基于空间域差值提取的热异常图像。 由于无云影像大部分位于青海省的低温区内, 导致该区空间域均值偏低; 青海省和甘肃省高温无云区的影像温度空间域差值偏大, 造成了热异常假象。 虽然在2004年6月28日(39.34°N, 97.25°E)发生了MS4.4地震, 但并未在7d之内再次发现热异常现象, 故认为基于空间域差值提取的结果为热异常假象。 图4b为先计算时间域差值、 后计算空间域差值的影像结果图, 可见热异常现象几乎消失。
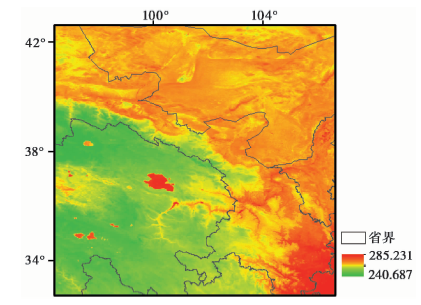 | 图 3 2004年的LST年均值分布图Fig. 3 Annual average value of LST in 2004. |
 | 图 4 2004年6月26日不同差值的热异常对比图Fig. 4 Comparison of thermal anomalies with different difference values on June 26, 2004. |
4.1.2 阈值对比
以往基于RST算法提取地震热异常时, 可将判断阈值设为1.6、 2、 3或4等不同值。 也有学者根据地震期与稳定期, 分别设置不同的热异常判断阈值(Lisi et al., 2015; Khalili et al., 2019)。 针对以往研究中RST算法热异常阈值设置的不稳定性, 基于偏度提取热异常时对于不同的背景场样本数将设置不同的判断阈值。
图5、图6为2012年4月28日的热异常结果图。 通过热异常与地震时间的对应关系可知, 与热异常相关的地震包括: 1)2012年5月3日MS5.2地震(40.51°N, 98.53°E); 2)2012年5月11日MS5.0地震(37.74°N, 102.05°E)。 根据热异常与地震的空间对应关系可知, 该热异常只与震例2相关。 震例2发生在祁连山北缘断裂带处, 而热异常方向为SE。 分析不同背景场样本数对应不同阈值与相同阈值的区别, 在阈值为4.5时背景场数分别为12a、 14a和16a的RST算法热异常结果见图 5, 从图中可见热异常的面积随着背景场数的增加越来越小且越来越聚集。 在表1的异常判断阈值k下背景场数分别为12a、 14a和16a的偏度算法热异常结果见图 6, 背景场数为12a时提取的热异常面积小于14a和16a的热异常面积, 这是由于剔除了云和背景场异常值导致实际样本数不足7个, 而偏度的判断异常样本数需为7以上, 这也是本文选取16a背景场的一个重要原因。 去除12a背景场数结果, 分析14a和16a背景场数之间的热异常变化, 同时掩膜背景场样本数< 7的像元值。 MYD11A1的分辨率为1 000m, 经统计影像像元个数, 发现RST在背景场数为14~16a时无热异常转变为热异常的数量是245, 占14a无热异常数的0.02%, 热异常转变为无热异常的数量是989, 占14a热异常数的65.19%。 偏度在背景场数为14~16a时无热异常转变为热异常的数量为180, 占14a无热异常数的0.02%, 热异常转变为无热异常的数量为33, 占14a热异常数的10.58%。 当背景场数发生变化时, 通过热异常与无热异常之间的变化可知, 不同样本数对应不同阈值的变化率小于相同阈值的结果。 因此, 不同背景场样本数对应不同判断阈值的稳定性更强。
 | 图 5 RST在阈值为4.5时不同背景场数的热异常结果Fig. 5 Thermal anomaly results of different background field numbers when the threshold of RST is 4.5. |
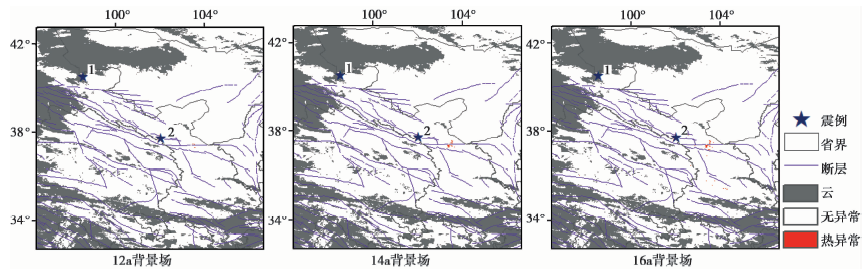 | 图 6 不同背景场数对应的偏度热异常结果Fig. 6 Thermal anomaly results of skewness at different background field numbers. |
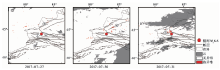
2017年8月8日, 在研究区内的四川省九寨沟县发生了MS7.0地震(33.19°N, 103.86°E), 震源深度为20km。 已有研究结果表明, 九寨沟MS7.0地震发生在华南地块、 青藏高原东北缘和巴颜喀拉地块东部交界处(熊威等, 2019), 雪山断裂、 岷江断裂及塔藏断裂交会地区(陈威等, 2018)。 利用偏度异常数据检测算法及改进的差值分析九寨沟MS7.0地震的热异常现象。 以震中为中心, 在10°×10°范围内提取其热异常信息(图 7)。 自2017年7月21日起在震中NW侧的军功断裂、 日月山断裂等区域出现大量热异常, 在震中NE侧六盘山断裂附近发现少量热异常; 7月22日未发现热异常现象; 7月23日热异常主要集中在震中N向的西秦岭北缘断裂附近区域; 7月24—25日发现热异常出现在震中NE方向的礼县-罗家堡断裂及陇县-宝鸡断裂附近; 7月26日后未发现热异常现象。 九寨沟MS7.0震前的热异常围绕震中整体呈顺时针从NW军功断裂向NE陇县-宝鸡断裂移动。
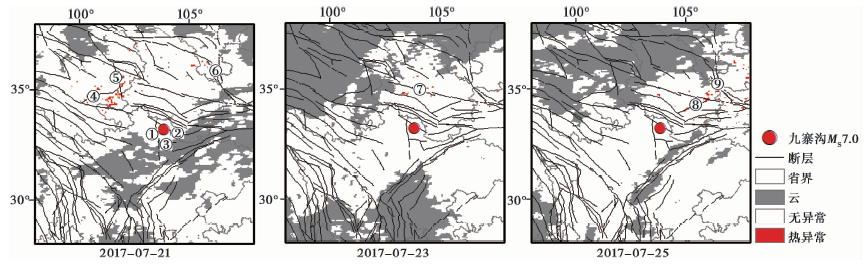 | 图 7 九寨沟MS7.0震前热异常信息 ①岷江断裂; ②塔藏断裂; ③雪山断裂; ④军功断裂; ⑤日月山断裂; ⑥六盘山断裂; ⑦西秦岭北缘断裂; ⑧礼县-罗家堡断裂; ⑨陇县-宝鸡断裂Fig. 7 Thermal anomaly information before the MS7.0 earthquake in Jiuzhaigou. |
除对研究区内发生的九寨沟MS7.0地震进行了热异常分析外, 同时还针对2016年12月8日呼图壁MS6.2地震和2017年8月9日精河MS6.6地震这2例发生在研究区外的6级以上强震进行了相关分析。 2016年12月8日, 新疆昌吉回族自治州呼图壁县发生MS6.2地震(43.83°N, 86.35°E), 震源深度为6km。 呼图壁MS6.2地震发生在亚马特断裂以北的准噶尔南缘断裂附近, 该区在历史上曾发生过多次强震(杨文等, 2018)。 以呼图壁MS6.2震中为中心, 提取10°×10°范围内的热异常信息(图 8)。 经相关计算和分析发现, 自2016年11月19日起在震中SW向库尔勒断裂与民丰-若羌隐伏断裂之间出现大量热异常现象; 11月22日热异常面积达到最大后开始减弱, 11月29—30日均在震中以南的焉耆盆地北缘断裂附近发现热异常; 12月1日后未发现热异常现象。 呼图壁MS6.2震前热异常整体从南往北向震中移动。
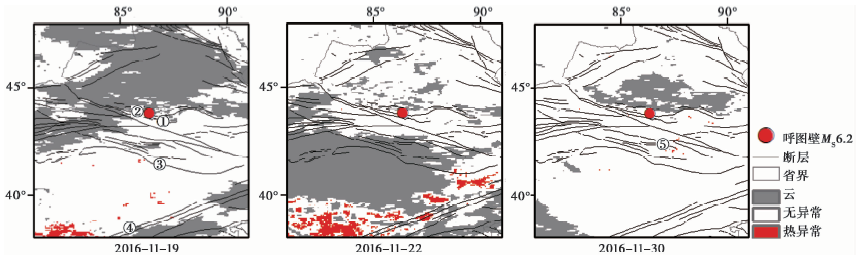 | 图 8 呼图壁MS6.2震前热异常信息 ①亚马特断裂; ②准噶尔南缘断裂; ③库尔勒断裂; ④民丰-若羌隐伏断裂; ⑤焉耆盆地北缘断裂Fig. 8 Thermal anomaly information before the MS6.2 earthquake in Hutubi. |
2017年8月9日, 新疆博尔塔拉州精河县发生了MS6.6地震(44.27°N, 82.89°E), 震源深度为11km, 震中位于喀什河断裂与博罗科努断裂之间。 以精河MS6.6震中为中心, 提取10°×10°范围内的热异常信息(图 9)。 自2017年7月27日起在震中NW侧塔斯特-巴尔雷克断裂和新疆博尔塔拉自治州温泉县NW向约50km处发现热异常, 呈线条状且与纬线以约30°相交; 7月28—29日未发现热异常现象; 7月30—31日再次出现热异常, 且依旧呈线条状, 分布在以震中为中心的达尔布特断裂和库松木楔克断裂附近; 8月1日后未发现热异常现象。 精河MS6.6地震震前热异常从震中NW侧的塔斯特-巴尔雷克断裂附近整体向震中移动且呈条状。
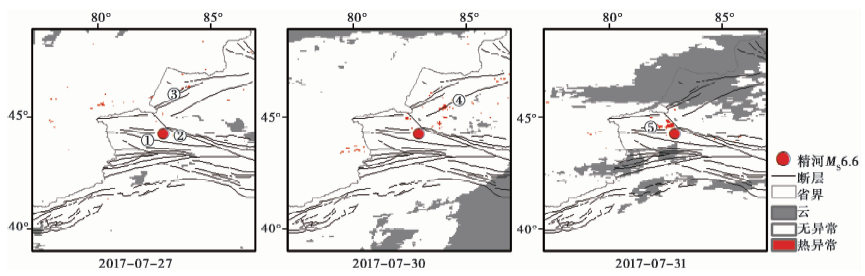 | 图 9 精河MS6.6震前热异常信息 ①喀什河断裂; ②博罗科努断裂; ③塔斯特-巴尔雷克断裂; ④达尔布特断裂; ⑤库松木楔克断裂Fig. 9 Thermal anomaly information before the Jinghe MS6.6 earthquake. |
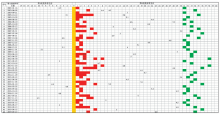
为探索基于MODIS LST影像评估偏度算法结合新差值(式(3))的地震预测潜力, 分析不同震级与热异常的关联性, 在地震热异常提取中利用4项比率(PPV、 FDR、 TPR、 FNR)进行系统的定量异常提取能力评估。 在2003年1月1日—2019年8月31日期间, 32.70°~42.72°N、 96.37°~106.65°E范围内共发生4级以上地震291例, 去除丛集地震81例后, 对剩余的210例地震进行分析, 图1b为研究区的地震空间分布情况。 其中, 共出现98例热异常现象, 与地震对应的热异常总数为46, 占比为46.94%; 在210例MS≥ 4.0地震中有热异常现象的地震数为53例, 占比为25.2%(表2); 对研究区内提取的46个地震热异常与相应的53个地震开展统计分析发现, 热异常发生在震前的地震占比为73.6%, 统计结果如图 10 所示。
| 表2 MS≥ 4时TP1、 FP、 TP2、 FN等各项值 Table2 TP1, FP, TP2, FN and other values when MS≥ 4 |
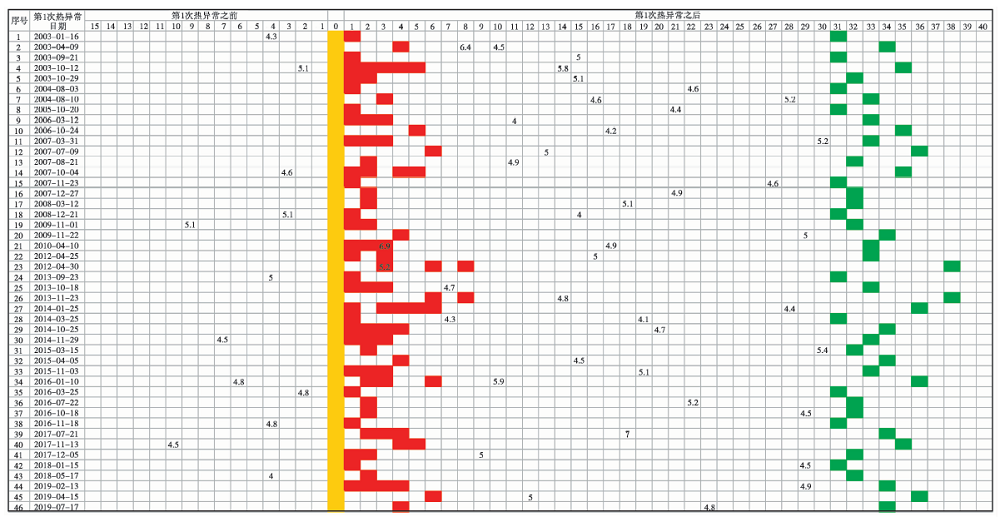 | 图 10 2003年1月—2019年8月研究区内热异常与地震对应关系的统计结果 黄色代表热异常出现的第1天, 红色代表后面持续发生热异常的时间, 绿色代表时间判断标准界限Fig. 10 Statistical results of the corresponding relationship between thermal anomalies and earthquakes in the study area from January 2003 to August 2019. |
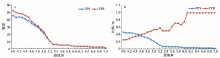
图11a为TP1和TP2与震级大小的数量关系图。 当MS≥ 4.0时, TP1为46, TP2为53, 其中有7个地震分别与其他地震对应同一个热异常, 如果加入丛集地震或选择地震发生频率较高的区域, 则差值会更大。 TP1、 TP2及其之间的差值随着震级的增大呈减小趋势。 当MS=5.2时TP1=TP2, 即10个热异常对应10个地震。 图11b为PPV、 TPR与震级大小的比率关系图。 从图中可见, PPV随震级的增大而逐步降低; 当MS≥ 4.0时PPV为46.94%, 表明当热异常发生时, 有MS≥ 4.0地震发生的概率 > 45% ; 而当MS≥ 5.0时PPV为21.43%, 远低于MS≥ 4.0的值, 说明当有热异常发生时, 在区域发生MS4.0以上地震的概率较大, 但发生MS5.0以上强震的概率较低。 TPR值在震级为[5.2, 6.0]时出现上下浮动现象, 但总体呈增长趋势, 甚至当MS≥ 6.1时TPR值达到100%。 虽然在研究区内强震数量少, 本次实验强震TPR值并不具有代表性, 但从整体趋势可以看出发生与地震相关的热异常现象的概率随着震级的增大而增大。 高TPR对于地震预测有重要意义: 发生强震时产生热异常的概率大, 这对强震预报而言十分重要。
 | 图 11 a TP1、 TP2与震级大小的数量关系; b PPV、 TPR与震级大小的比例关系Fig. 11 The quantitative relationship between TP1, TP2 and magnitude(a), and the ratio between PPV, TPR and magnitude(b). |
本文针对当前基于背景场分析的地震热异常提取不够精细的问题, 引入了偏度异常提取算法, 剔除云对地表温度的影响, 并提高热异常判断阈值稳定性。 进而基于以上方法分析了九寨沟MS7.0、 呼图壁MS6.2和精河MS6.6震前的热异常变化规律, 基于长时间序列统计分析了研究区地震热异常与震级的关系, 得到结论如下:
(1)空间域差值会产生由云掩膜与温度空间分布差异造成的热异常假象, 先进行时间域差值再计算空间域差值可剔除云对地表温度的影响, 以减少热异常假象。
(2)偏度和RST都是基于背景场(样本)统计异常数据, 在样本数满足偏度异常判断的条件下, 不同样本数对应不同阈值可使背景场数量发生变化时热异常的面积基本不变, 可提高热异常判断阈值的稳定性。
(3)分析九寨沟MS7.0地震可知, 震前热异常围绕震中整体沿顺时针从NW侧的军功断裂向NE陇县-宝鸡断裂移动; 呼图壁MS6.2震前热异常整体从南往北向震中移动; 精河MS6.6震前热异常整体从NW侧的塔斯特-巴尔雷克断裂附近向震中移动且呈线条状。
(4)分析多年热异常与地震间的关系可知, TPR随着震级的增大而升高, 即震级越大对应发生地震热异常的概率越大, 这对未来地震预报具有重要意义。
本文通过优化算法利用云和地表温度2种数据剔除天气因素对地震热异常造成的影响, 新的差值将消除云对温度空间分布差异造成的热异常假象, 但地形、 地物对温度的影响依旧存在。 阳坡土壤温度高于阴坡(朱云云等, 2016), 背风坡温度高于迎风坡(马会雷等, 2018)。 目前尚不存在更好的方法排除由暖平流输送、 焚风、 下沉运动和辐射升温等造成的局地升温现象。 由于天气的复杂和多变性, 利用新的差值可减少对热异常假象的出现, 但并不能将其完全消除。 虽然在研究区内的强震数量较少, 本次实验强震TPR值并不具有代表性, 但从整体趋势可以看出地震发生热异常的概率随着震级增大而增大。
| [1] |
|
| [2] |
|
| [3] |
|
| [4] |
|
| [5] |
|
| [6] |
|
| [7] |
|
| [8] |
|
| [9] |
|
| [10] |
|
| [11] |
|
| [12] |
|
| [13] |
|
| [14] |
|
| [15] |
|
| [16] |
|
| [17] |
|
| [18] |
|
| [19] |
|
| [20] |
|
| [21] |
|
| [22] |
|
| [23] |
|
| [24] |
|
| [25] |
|
| [26] |
|
| [27] |
|
| [28] |
|
| [29] |
|
| [30] |
|
| [31] |
|