


基于人工地震资料的珠江口地区最小一维P波速度模型
[王力伟1), 2), 3)  , 王宝善
, 王宝善1), 4), 5) , 叶秀薇2), 3), * , 张云鹏1) , 王小娜2), 3) , 吕作勇2), 3) ]
, 王宝善, 张云鹏|
|


作者简介:王力伟, 男, 1985年生, 中国地震局地球物理研究所固体地球物理专业在读博士研究生, 高级工程师, 主要从事主动震源探测和体波层析成像研究, 电话: 020-87688797, E-mail:wangliwei@cea-igp.ac.cn。
珠江口地区位于南海北部大陆的边缘, 具有洋陆过渡型地壳特征, 且NE向滨海断裂带从其中穿过, 强震风险不可忽视。 文中基于2015年珠江口海陆联合三维人工地震探测数据, 人工进行初至P波震相拾取, 并使用VELEST程序分别反演了陆域和海域的最小一维P波速度模型(走时残差均方根最小)和台站校正结果。 台站校正结果的空间分布与区域地形、 地质构造和沉积厚度相关较好, 正值多分布在珠江三角洲沉积盆地和珠江口盆地内, 而负值多分布在花岗岩等基岩出露地区以及滨海断裂带北侧和北部断阶带内的部分隆起地区。 新模型对人工地震走时的拟合精度较高, 陆域走时残差均方根为0.07s, 海域为0.21s。 与华南模型相比, 新模型对区域地震定位的效果更好, 重定位后, 陆域的P波地震走时残差降低了22.6%、 S波降低了21.2%; 海域的P波地震走时残差降低了25.7%、 S波降低了15.6%。 新模型可为区域地震定位、 地震参数和三维成像研究提供参考。
, WANG Bao-shan, ZHANG Yun-pengLayered 1-D velocity models are widely used in seismic network routine locations and in seismological studies, such as earthquake relocation, focal mechanism inversion, synthetic seismogram calculation and geodynamics simulation. It’s also used as a reference model for 2-D and 3-D tomographic inversions. Therefore, obtaining a more reliable 1-D velocity model is an extremely important work for the study of earthquake source parameters and seismic tomography. The onshore-offshore area of the Pearl River Estuary is located at the transition zone between South China block and South China Sea bock, the special ocean-land transitional crustal type and the littoral fault zone, which is the regional seismic control structure passing through it, makes it a potential seismic source. Meanwhile, the Pearl River Delta has the most developed economy and dense population in South China. However, the 1-D velocity model used in seismic network routine operations has not been updated since 1990. To investigate the seismic structure and potential strong earthquake risk in this area, we conducted a 3-D active source seismic experiment in 2015, which incorporated sea-based airgun sources and land-based dynamite sources, and seismic recorders both at the onshore and offshore area in the Pearl River Estuary. A high quality subset of the data was used to derive an improved 1-D seismic VP model for seismological studies. The model is constructed using the VELEST program with first arrival P-wave travel time data, together with station corrections, which account for shallow velocity anomalies from the true velocity model. The reliability of our new model is assessed by good fitting of the travel time data of airguns and dynamites and better earthquake relocation results.
The final 1-D model provides a good fit for travel time data. After iterative inversion, the root-mean-square travel-time error is 0.07s in the onshore area and 0.21s in the offshore area. Within 6km top of the model, the P-wave velocity of onshore area is 5.22~5.99km/s, and the offshore area is obviously lower, which is 2.11~6.03km/s. The retrieved values are in agreement with the thick sedimentary basins in the Pearl River Estuary Basin whose velocity is obvious lower. Then the velocity smoothly increases with depth, within the depth range of 6~15km, the P-wave velocity of onshore area is slightly lower than the offshore area, which may be due to the wide-spread low velocity layer at the middle crust depth in South China Block. Below the depth of 15km, the P-wave velocity of offshore area is greater than that of the onshore area, which is consistent with the high velocity layer in the base of the thinned continental crust and the gradually uplifting of Moho depth seaward as reported in the previous studies.
The spatial distribution of station corrections correlates well with the near-surface structure and geological features. In the area onshore of the Pearl River Estuary, positive values of station corrections are mostly observed in correspondence with the Pearl River Delta sedimentary basins due to its lower velocity values, such as Sanshui Sag, Shunde Sag and Dongguan Sag, etc. While stations located in granite, limestone and metamorphic rocks outcropping area show early P-wave arrivals(negative station corrections). In the area offshore of the Pearl River Estuary, the spatial distribution of station corrections shows a significant lateral variation and 80%larger than the onshore area. It has a good spatial correlation with the buried depth of the sedimentary basement inverted by reflection seismic survey, where the deposits are thicker, the station corrections are positive, the underground medium presents a low velocity, and vice versa. Negative values of station corrections are observed northwest of the NE-trending littoral fault zone, while positive values correspond to the thick sedimentary basins in the Pearl River Estuary Basin southeast of the littoral fault zone.
At last, we relocated 425 earthquakes in the onshore area and 234 earthquakes in the offshore area with ML≥0.0 using simul2000 algorithm. The result shows that our new model is better than the South China model, the seismic travel time residual after relocation is greatly reduced, the land P wave residual is reduced by 22.6%, and the S wave is reduced by 21.2%. The sea P wave residual is reduced by 25.7%, and the S wave is reduced by 15.6%. The new model is better for regional earthquake location.
We provide a more reliable VP velocity model, which can be used to earthquake location, earthquake source parameter inversion and 3-D velocity model studies in the Pearl River Estuary.
获取高精度的震源位置是进行地震活动性分析(Xu et al., 2006)、 震源参数研究(Xie et al., 2013)、 深部构造研究(Got et al., 1994)、 重复地震识别(Li et al., 2017)和地震成像的关键(Kissling et al., 1995; Thurber et al., 2006)。 地震绝对定位的精度与观测台网布局、 到时拾取的数量和精度、 定位算法以及速度模型等因素有关(Richards et al., 2006)。 其中, 速度模型对定位结果的影响最大, 选取不恰当的速度模型会使定位结果出现显著畸变和系统性偏差(Thurber, 1992; Kissling et al., 1994)。 尽管目前已开始使用三维速度模型开展地震定位研究, 但在常规定位程序, 特别是对时效要求高的速报程序中, 仍广泛使用一维层状模型来近似真实模型(Lee et al., 1975; Klein, 2014)。 此外, 一维速度模型也被用于震源机制解反演(Xie et al., 2013; 王小娜等, 2019)、 理论地震图计算(Wang R J et al., 2006)和地球动力学模拟(雷兴林等, 2013)等工作中, 并作为二维、 三维速度模型反演的初始模型(Zelt et al., 1992; Thurber et al., 2006; 王小娜等, 2014; 叶秀薇等, 2017)。 因此, 获取更准确的一维速度模型是开展震源参数求解、 速度结构成像等研究的极为重要的基础工作。
南海北部陆缘是海陆的过渡地带, 其特殊的构造位置和地质过程使得该区形成了独特的洋陆过渡型地壳, 陆域具有华南正常陆壳厚度和分层特征, 海域却具有拉张减薄型洋壳特征(Zhang et al., 2007; Xia et al., 2010; Zhu et al., 2012)。 而横贯其间的滨海断裂带是华南正常陆壳和南海减薄型洋壳的分界断裂(Xia et al., 2010; 曹敬贺等, 2014), 也是该区的主体控震构造(丁原章, 1994; 张虎男等, 1994)。 近年来, 为得到高精度海陆过渡带的速度结构并更好地进行地震风险评估, 在该区进行了很多海陆联测实验(Xia et al., 2010; 丘学林等, 2012; Cai et al., 2015; Liu et al., 2015)。 2015年6月, 在广东省政府的支持下, 广东省地震局联合中国科学院南海海洋研究所、 中国地震局地球物理勘探中心在珠江口海陆过渡地区开展了大规模的海陆联合三维人工地震探测实验, 采用海上气枪和陆上炸药震源相结合、 陆域地震台和海域OBS台联合接收的方式, 获得了大量高质量的覆盖海陆过渡带的人工地震探测数据, 使得计算该区更真实的地壳速度模型成为可能, 先前的研究成果也陆续发表(Cao et al., 2018; Lü et al., 2018; 熊成等, 2018; Zhang X et al., 2018; 叶秀薇等, 2020)。
珠江口位于特殊的构造位置, 且人口稠密、 经济发达, 但一直以来日常对该区内发生的地震进行定位仍使用华南一维地壳模型(范玉兰等, 1990), 多年未对模型进行过更新。 因此, 本文利用珠江口三维人工地震探测数据, 使用VELEST程序(Kissling et al., 1994)分别反演了珠江口陆域和海域最小一维P波速度模型(走时残差均方根最小), 以期进一步提高常规定位、 速报等日常工作的定位精度。
珠江口海陆过渡地区位于南海北部大陆边缘, 是华南块体和南海北部块体过渡地带。 受西太平洋板块W向俯冲(Lei et al., 2006)、 印藏碰撞侧向应力传递(张国伟等, 2013)及新生的海南地幔柱助推作用(Lei et al., 2009; Zhang G L et al., 2018)的影响, 该区经历了晚白垩世— 渐新世期间的大陆裂解以及渐新世— 中新世期间的南海扩张地质共同作用, 大陆地壳发生强烈拉张减薄(Gilder et al., 1996; 姚伯初, 1998; Wang et al., 2003; Zhang et al., 2007), 形成独特的洋陆过渡型地壳(Zhang et al., 2007; Xia et al., 2010; Zhu et al., 2012), 并发育一系列陆缘裂陷盆地和NE、 NEE向拉张型断裂(Hayes et al., 1995)( 图 1)。 新近纪以来, 岩浆和火山活动多沿断裂发生(Wang et al., 2003; Fan et al., 2017)。
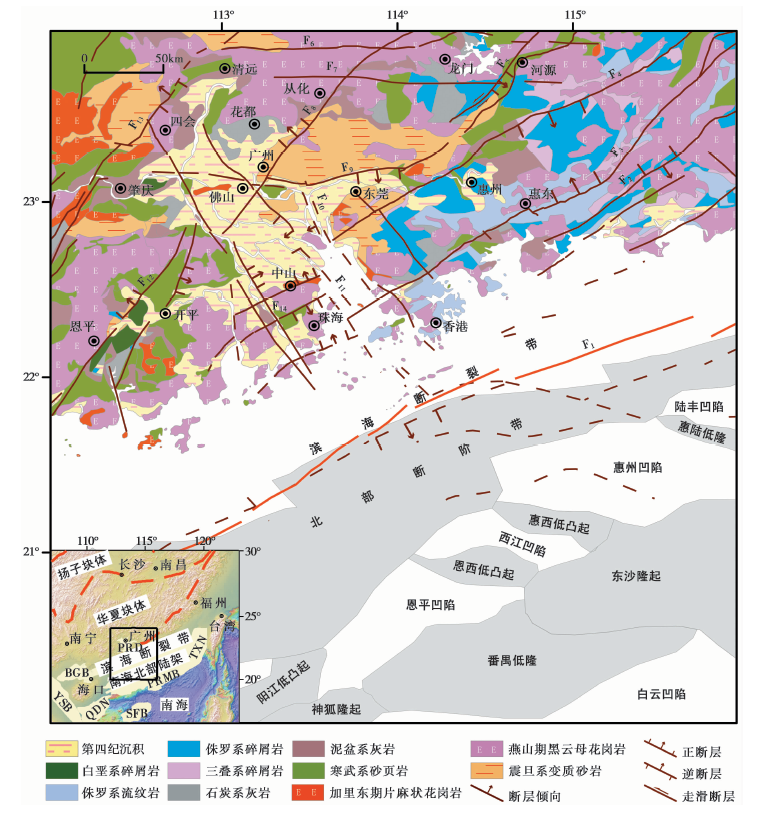 | 图 1 珠江口海陆过渡地区的地质构造与断裂分布图 棕色线条是区域活动断裂: F1滨海断裂带; F2海丰-丰顺断裂; F3深圳-五华断裂; F4紫金-博罗断裂; F5河源-邵武断裂; F6佛冈-丰良断裂; F7清远-安流断裂; F8广州-从化断裂; F9瘦狗岭-罗浮山断裂; F10狮子洋断裂; F11白坭-沙湾断裂; F12苍城-海陵断裂; F13吴川-四会断裂; F14西江断裂(数据源自马丽芳等, 2002; 梁干等, 2013; Yao et al., 2013; 唐晓音等, 2014; 叶青等, 2017)。 左下角图中, 红色虚线为块体边界: BGB 北部湾盆地; QDN 琼东南盆地; SFB 双峰盆地; TXN 台西南盆地; YSB 莺歌海盆地; PRMB 珠江口盆地; PRD 珠江三角洲Fig. 1 Faults and tectonic sketch map of the Pearl River Estuary transitional zone. |
大量研究表明, 华南正常陆壳的厚度为30~32km, 上、 中、 下3层结构分层明显(尹周勋等, 1999; Zhang et al., 2007; 邓阳凡等, 2011; Zhao et al., 2013; Lü et al., 2018; Zhang X et al., 2018), 沉积厚度较薄, 且中地壳广泛存在厚3~4km的低速层(赵明辉等, 2006; 方念乔等, 2007)。 而向S跨过NE向的滨海断裂带后(任镇寰等, 2008), 低速层尖灭(曹敬贺等, 2014; Lü et al., 2018), 莫霍面突然抬升, 地壳厚度减薄至24~26km(Xia et al., 2010; Wan et al., 2017; 熊成等, 2018), 壳内反射界面减弱, 沉积厚度增至1.5~4.7km(Xia et al., 2010; Cao et al., 2018), 且部分地区的下地壳出现高速体分布(Yan et al., 2001; Wan et al., 2017)。
滨海断裂带是华南正常陆壳和南海减薄型洋壳的分界断裂(Xia et al., 2010; 曹敬贺等, 2014), 也是该区的主体控震构造(丁原章, 1994; 张虎男等, 1994)。 滨海断裂带南侧为珠江口盆地坳陷区( 图 1), 盆地主要由北部断阶带、 北部坳陷带和中央隆起带3个构造单元组成(Cao et al., 2018), 盆地内部新生代沉积厚度> 5km(孙晓猛等, 2014), 且发育张性正断的NEE向断裂和NW向共轭断裂(丁原章, 1994; 陈汉宗等, 2005)。 滨海断裂带北侧为珠江三角洲第四纪断陷盆地( 图 1), 盆地基底形成于晚白垩世华南陆缘裂解时, 内部沉积主要由河流相砂层、 砂砾层和海相粉砂质淤泥组成, 主要为新近纪以来的沉积物, 最厚达64m(张虎男等, 1989; Yao et al., 2013)。 陆域断裂以NE向为主, NW向次之, 2组断裂具有长期反复活动、 南强北弱的特点, 对该区沉积、 岩浆和变质作用等具有明显的控制作用(张虎男等, 1994; 任镇寰等, 2009)。
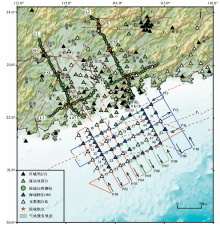
为研究珠江口海陆过渡地区三维地壳结构, 探明滨海断裂带的深部构造特征及评估其强震风险, 2015年6月, 广东省地震局联合中国科学院南海海洋研究所、 中国地震局地球物理勘探中心, 采用海上气枪和陆上爆破联合激发, 面状台阵和线状加密测线海陆联合接收的方法, 得到了完整覆盖珠江口海陆过渡带的三维人工地震探测数据( 图 2)。 海上气枪震源为4支BOLT 1500LL型长寿命气枪, 激发间隔为80s, 间距约为200m, 激发水深为10m, 累计激发12 209炮, 激发里程达2 300km。 最终形成13条放炮测线, 其中有NW向10条, 长度约为150km(P01— P10); NE向3条, 长度约为230km(P11— P13)。 海上成功回收29台OBS, 台间距为15~20km, 将P02、 P08 2条测线加密至10km。 陆上采用6个炸药震源( 表1), 陆上面状台阵共有153台, 台间距为10~20km, 其中, 区域固定台73台, 流动台80台。 另外, 跨陆域主要NE、 NW向断裂布设3条宽角反射折射剖面, 以接收陆地炸药激发信号, 共计256台, 台间距为2.5km, 2条NW向测线长180km, 1条NE向测线长260km。 数据整体记录良好, 为之后的成像工作提供了良好的数据基础。
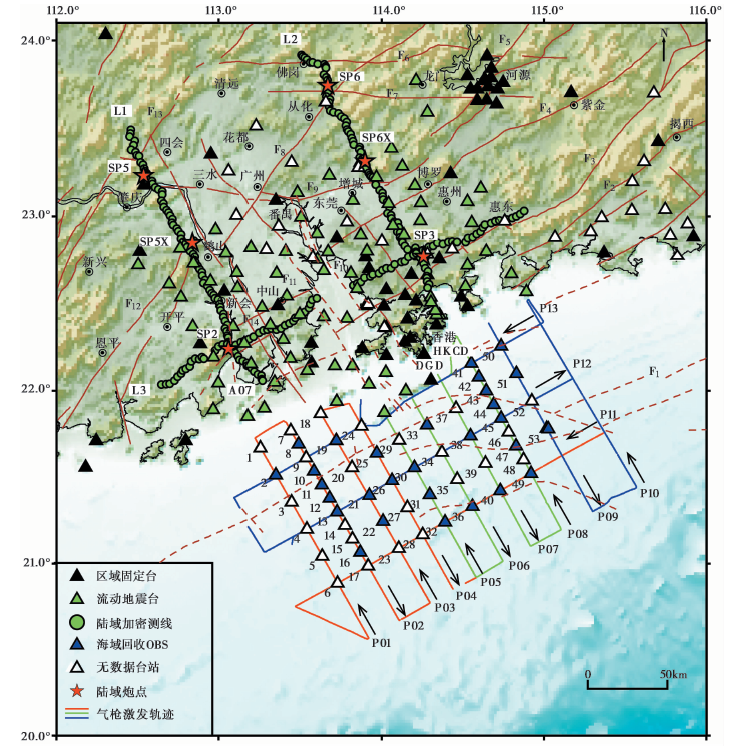 | 图 2 2015年珠江口海陆联测实验观测系统图 三角形是各种地震台站, 红色五角星是陆上炸药震源, 海上红色、 绿色和蓝色线条为不同航次的气枪激发点, 黑色箭头为气枪的激发方向; P01— P13为气枪激发测线编号。 棕色线条是区域活动断裂, 编号同图1Fig. 2 The observation system of the 2015 3-D onshore-offshore seismic experiment in the Pearl River Estuary. |
| 表1 陆上人工爆破激发参数表 Table1 The source parameters of dynamites in onshore areas |
首先, 本文按照张云鹏等(2017)的主动源数据库构建方法对探测数据进行了统一整理, 使用近偏移距的初至波到时对陆上炸药震源的激发时刻进行校正( 表1), 使用直达水波到时对海上OBS的时钟偏差进行校正。 然后, 基于人工震源激发的零时刻从数据库中截取出事件波形, 并根据气枪和爆破观测系统的特点, 分别排列成共接收点道集和共炮点道集, 每个接收台站有13个气枪激发记录剖面( 图 2, P01— P13), 每个炸药震源有L1、 L2、 L3和面状台阵共4个炸药激发记录剖面。 其次, 使用SU软件(Stockwell et al., 2008)对各个记录剖面进行增益、 均衡、 滤波和折合等处理, 气枪信号的滤波范围为2~9Hz, 炸药信号为2~10Hz, 为突出壳内震相, 以6km/s进行折合。 最后, 使用ZPLOT程序(Zelt, 1994), 手动拾取了各个地震记录剖面中Pg、 PmP等主要壳内折射和反射震相。 其中陆上地震计从垂直分量中拾取, 海域OBS优先从水听器分量中拾取。
本文拾取了2 749个地震剖面的壳内震相, 主要拾取的震相为Pg和PmP, 此外还有Pw、 Ps、 Pg2、 P1P、 P2P和Pn, 依次描述如下:
Pw震相: 直达水波, 即气枪信号经海水传播直接被OBS台接收的信号, 视速度为1.5km/s, 在偏移距约2km内为初至( 图3b— d), 可用来校正OBS沉放位置和内部时钟偏移(张莉等, 2013)。
 | 图 3 典型的地震记录剖面图 a— f 海域跨滨海断裂带的NW-SE向气枪走时剖面; g— i 海域平行滨海断裂带的NE-SW向气枪走时剖面; j— l 陆域炸药震源走时剖面Fig. 3 Typical record sections of land dynamite sources and sea airgun sources. |
Ps震相: 沉积层或盖层的回折波, 紧接Pw震相之后的初至波, 视速度较低, 为2.0~5.0km/s, 追踪距离< 10km, 且仅可在海域沉积较厚处的OBS台拾取到( 图3c, d, f)。
Pg震相: 上地壳内部的折射波, 能量强, 初至清晰, 在偏移距0~130km内为可连续追踪的初至震相, 视速度为5.5~6.1km/s, 向海侧逐渐降低。 其海域折合走时较陆域大, 且折合走时向海域方向随偏移距的增加而增大( 图3a— f), 反映从陆域到海域存在沉积增厚的现象(基底埋深变化幅度达3km)(Cao et al., 2018)。 其他方向的Pg走时曲线较平坦( 图3g— j), 部分测线受山区和沉积盆地影响出现折合走时超前或滞后现象( 图3j— l)。 在跨滨海断裂带的位置, 由于断裂带内沉积突然增厚且介质破碎, 折合走时均出现显著的滞后现象(约0.6s), 然后恢复正常( 图3a— f)。
Pg2震相: 下地壳内部折射震相, 出现在Pg震相之后, 一般偏移距> 130km, 视速度较Pg大, 约为6.2km/s, 部分OBS台能拾取( 图3a, e)。
P1P、 P2P震相: 上地壳底界面反射波和中地壳底界面反射波, 能量较弱, 连续性不好, 是较弱的反射界面, 偏移距为30~120km时可识别, 仅可在陆域炸药剖面信号中拾取到( 图3j— l), 海域OBS台较难识别。
PmP震相: 莫霍面反射波, 是主要的反射震相, 能量很强, 且以多个波包的形式出现, 在50~160km可连续追踪, 视速度为6.1~8.5km/s, 随偏移距的增加逐渐降低, 走时曲线呈双曲线形态, 略有起伏( 图3a— l)。
Pn震相: 上地幔顶部的折射波或莫霍面首波, 偏移距为120~130km时与Pg、 PmP相切, 仅可在部分剖面中拾取到( 图3a)。
地震波观测走时是震源参数和速度结构的非线性函数(Thurber, 1992; Kissling et al., 1994)。 Kissling等(1994)提出一种通过联合反演震源参数、 速度结构以及台站校正计算最小一维速度模型的方法。 该方法采用阻尼最小二乘法进行迭代反演得到区域最小一维速度模型, 模型中各层的速度代表以射线长度为权重对三维速度模型各层速度的加权平均结果, 台站校正项尽可能消除速度结构的横向差异, 最终得到最接近真实模型的拟合走时残差均方根值最小的一维速度模型。 该方法已被广泛应用于一维速度模型研究中(Matrullo et al., 2013; 王小娜等, 2015)。
本文使用2015年珠江口实验中的陆上6个炸药震源和海上气枪震源激发的初至P波走时数据, 分别反演了珠江口海陆过渡地区陆域和海域的最小一维P波速度模型。 图 4 展示了反演使用的射线分布和走时数据。 本工作经人工挑选数据, 仅使用信噪比较高的记录剖面的走时数据进行反演, 其中包括陆域Pg震相1 004条、 观测台站355个, 海域Pg震相221 549条(含部分初至Pw波和Ps波)、 观测台站76个, 有效激发炮数10 153次。 针对海域部分, 为提高反演稳定性, 根据地震勘探的互易性原理将海上气枪震源和观测台站进行了互换, 以气枪震源作为观测台站、 OBS等观测台站作为地震震源, 使用共接收点道集重新排列所有震相后, 单个事件的震相数显著增加(如气枪单次激发, 最多有48个台站接收到, 重新排列后, 1个OBS台站最多接收到6 284次气枪信号)。
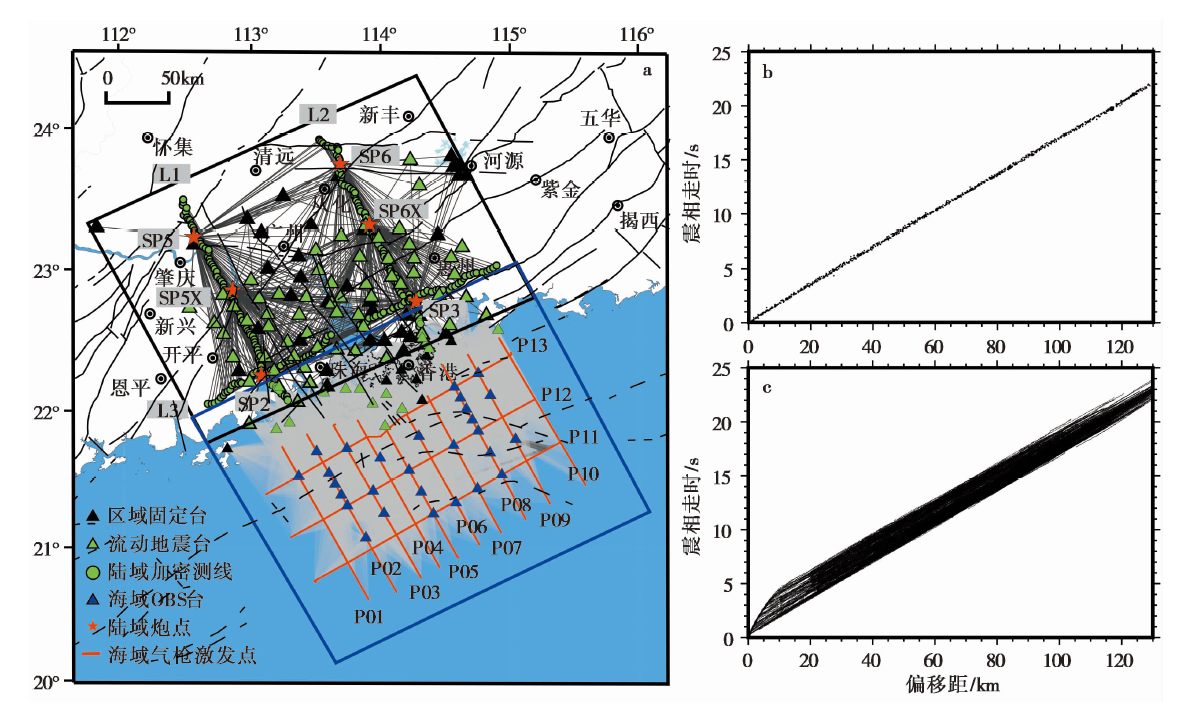 | 图 4 反演使用的初至波射线分布和时距曲线 a 陆域和海域的射线分布; b 陆域初至Pg波的时距曲线; c 海域初至波(Pw、 Ps、 Pg)的时距曲线Fig. 4 Travel time curve and raypath distribution of the first-arrival phases. |
为进一步剔除不良观测数据, 本文对曹敬贺等(2014)反演的香港外海二维地壳速度模型取平均得到一维初始模型, 使用VELEST程序, 不考虑台站和炮点校正, 粗略反演了海域部分的最小一维速度模型( 图 5), 得到理论走时, 剔除与理论走时偏差> 1.0s的走时数据, 并保证单次气枪激发的有效接收台站数> 4个, 最终得到筛选后的Pg震相215 318条、 气枪激发点9 907个。 为提高台站校正结果的稳定性, 认为台间距< 2km的台站具有相同的台站校正量。
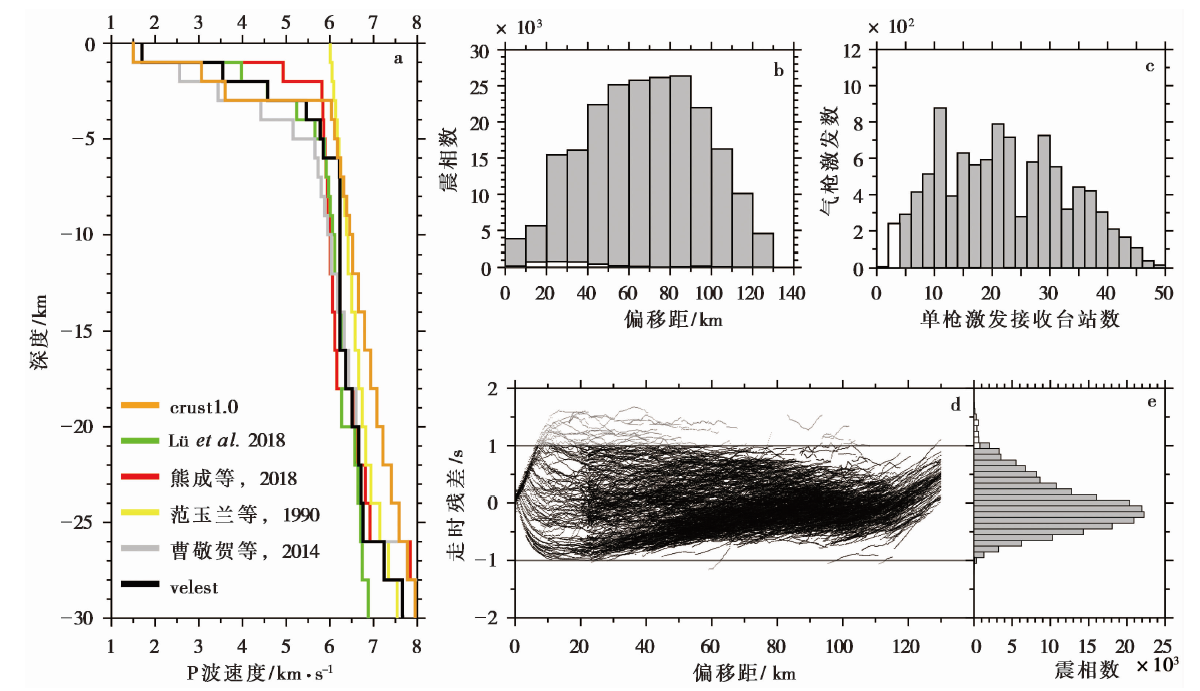 | 图 5 海域初至波走时数据及其筛选 a 粗略反演的海域最小一维速度模型; b 灰色为海域不同偏移距的震相数目, 白色为剔除的震相; c 灰色为单枪激发接收台站数目的分布图, 白色为剔除的气枪激发点; d 使用simul2000(Thurber, 1983)统计的走时残差随偏移距的分布; e 走时残差分布图Fig. 5 First arrival phases selected by travel time residuals in the offshore area. |
使用足够真实的初始模型, 是将震源和速度结构联合反演非线性问题线性化的关键(Thurber, 1992; Kissling et al., 1994, 1995)。 为避免陷入局部最小, 本文使用不同速度和梯度的初始模型, 经多次计算逐步求得多值解空间中的全局最小解。 图6a和7a分别展示了陆域和海域尝试反演的初始速度模型, 其中5个模型来自已有的研究成果(范玉兰等, 1990; Laske et al., 2013; 曹敬贺等, 2014; 熊成等, 2018; Lü et al., 2018; Zhang X et al., 2018)。 此外, 本文设置了多个随机初始模型, 其深度范围为-1~35km, 初始速度为1.5~7.0km/s, 速度间隔为0.5km/s, 速度梯度为0.03~0.3km/s, 梯度间隔为0.03km/s, 速度随深度逐层增加, 并剔除深度40km处速度> 9km/s的初始模型( 图6a, 7a)。 由于VELEST不能反演层厚, 因此本文将深度< 10km的层厚设为1km, 其他设为2km。 已有研究表明, 华南大陆中地壳存在低速层, 且向海域尖灭于滨海断裂带附近(赵明辉等, 2006; 方念乔等, 2007; Lü et al., 2018; Zhang X et al., 2018), 但为了增加反演的稳定性, 本文没有设置低速层。
 | 图 6 陆域最小一维P波速度模型的计算结果 a 灰色线条为不同起始速度和梯度的初始模型, 深灰色线条为不同初始模型不考虑台站校正的反演结果, 黑色粗线是反演结果的平均。 b 使用图a反演得到的平均模型作为初始模型, 不考虑台站校正进行反演后, 剔除走时残差> 0.16s的走时数据, 然后考虑台站校正反演得到的最小1D速度模型。 c 灰色部分为不同偏移距的震相数目, 白色部分为剔除的走时残差> 0.16s的数据。 d 各次反演后的走时残差分布图。 其中, 灰色代表图a中的平均模型; 蓝色代表使用图a的平均模型作为初始模型, 不考虑台站校正的反演结果; 红色代表最终考虑台站校正的反演结果Fig. 6 Minimum 1-D VP velocity model in the onshore area. |
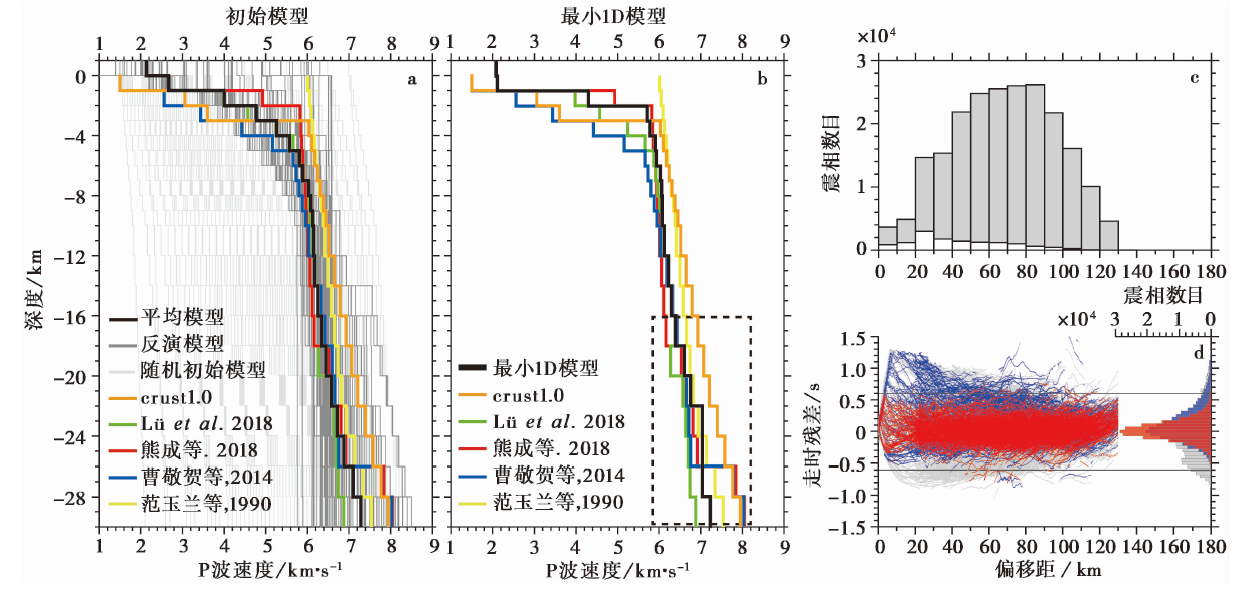 | 图 7 海域最小一维P波速度模型的计算结果 a 灰色线条为不同起始速度和梯度的初始模型, 深灰色线条为不同初始模型不考虑台站校正的反演结果, 黑色粗线是反演结果的平均; b 使用图a反演得到的平均模型作为初始模型, 不考虑台站校正进行反演后, 剔除走时残差> 0.6s的走时数据, 然后考虑台站校正反演得到的最小1D速度模型; c 灰色部分为不同偏移距的震相数目, 白色部分为剔除的走时残差> 0.16s的数据; d 各次反演后的走时残差分布图。 其中, 灰色代表图a中的平均模型; 蓝色代表使用图a的平均模型作为初始模型, 不考虑台站校正的反演结果; 红色代表最终考虑台站校正的反演结果Fig. 7 Minimum 1-D VP velocity model in the offshore area. |
反演工作分为3步进行: 1)使用不同速度和梯度的初始速度模型, 选择偏移距< 130km的初至波走时数据, 不考虑台站和炮点校正进行反演, 并将VELEST反演结果的平均作为下一步反演的初始速度模型。 设置最大迭代次数为100, 每次迭代的速度变化量为0.2km/s, 大部分反演经12~20次迭代后结束。 2)利用平均后的初始模型, 不考虑台站和炮点校正, 再次反演求得更接近真实模型的一维速度模型, 并剔除走时残差过大的数据用于下一步反演(陆域0.16s, 海域0.6s)。 3)使用此前反演得到的一维速度模型作为新的初始模型, 使用筛选后的走时数据, 考虑台站校正, 分别反演得到陆域和海陆的最小一维P波速度模型和台站校正结果。
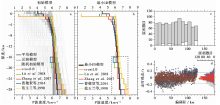
图 6给出了陆域最小一维P波速度模型的反演结果。 由于人工震源的激发位置和时间精确已知, 因此, 在反演中保持震源不变, 仅反演速度结构。 由 图6a可见, 各种初始模型反演结果总体收敛在已有研究结果的范围内, 深度< 16km, 收敛较好, 可能与相对均一的结构及良好的射线分布有关。 深度> 16km的结果相对分散, 分辨较差, 与该深度范围内射线分布较差有关( 图6b中的虚线框)。 将该步反演结果的平均作为下次反演的初始模型, 经8次迭代后, 走时残差的均方根值从0.15s降低至0.10s, 下降了33.3%。 之后, 剔除走时残差> 0.16s的走时数据, 震相数由1 004条变为926条, 并使用上一步反演的结果作为新的初始模型做进一步反演。 为了反映速度结构横向差异的影响, 同时计算了台站校正。 台站校正的正、 负空间分布不但能反映台站下方浅部介质的高、 低速异常, 且与地壳深部结构也有一定的相关性(Matrullo et al., 2013)。 此外, VELEST计算射线路径时考虑了台站高程的影响, 因此也考虑了地形的影响。 最终经15次迭代后, 走时残差均方根值降低了30%, 为0.07s( 图6d)。 由 图6b可见, 最终结果在数值上整体比华南一维速度模型偏低(范玉兰等, 1990), 比深地震测深得到的平均结果略高。 深度4km以浅的速度变化较大, 由4.28km/s变为5.97km/s; 深度> 4km时速度随深度的增加逐渐增大, 与Lü 等(2018)使用L2测线反演的结果最接近。 由于本文没有设置低速层, 故已有研究显示的16~20km之间的低速层在模型中没有显示(Zhang et al., 2007; 曹敬贺等, 2014; Lü et al., 2018; Zhang X et al., 2018)。
图 7给出了海域最小一维P波速度模型的反演结果, 反演思路与陆域相同。 从 图7a可见, 虽然基于随机设置的初始模型反演的结果在深度< 15km时较发散, 但总体收敛于已有研究结果的范围内, 之所以出现相对分散的反演结果主要是由于该海域为华南正常陆壳到南海洋壳的过渡地带(Xia et al., 2010; 曹敬贺等, 2014), 沉积厚度由陆侧的0km增厚到海侧的3km(Cao et al., 2018; 熊成等, 2018), 且宽度为20~45km、 具有强烈低速异常的NE向滨海断裂带从该区穿过(曹敬贺等, 2014; Cao et al., 2018)。 相对陆域部分, 海域上地壳具有较强的横向非均一性, 也增强了初始模型对结果的影响(Thurber, 1992; Kissling et al., 1994)。 深度> 15km的结果较分散, 是由于深部射线数目及交叉不佳, 模型分辨较差( 图7b中的虚线框)。 将该步反演结果的平均作为新的初始模型, 经7次迭代, 走时残差均方根值从0.41s降低至0.28s, 下降了31.7%。 进一步剔除走时残差> 0.6s的数据, 震相数由215 318条减少为202 539条, 并使用上步反演的结果作为新的初始模型再次进行反演, 同时也对地形和台站校正进行计算, 经6次迭代后, 走时残差均方根值降低至0.21s, 下降了25%。 由 图7b可见, 海域速度值整体比华南一维模型低, 在深度6km以浅, 速度随深度的增加变化较大, 由2.11km/s增加至6.03km/s; 深度> 6km后, 速度随深度的增加逐渐增大, 最接近熊成等(2018)利用P02测线反演得到的结果。
表2给出了本文反演得到的研究区最小一维P波速度模型。 从表中可见, 深度6km以浅, 二者差异较大, 陆域P波速度为5.22~5.99km/s, 海域波速较陆域明显偏低, 为2.11~6.03km/s, 这主要是由于海域的沉积层较厚、 波速较低所致(Cao et al., 2018)。 6~15km深度范围内, 二者波速相当, 陆域比海域稍低, 可能与华南地区普遍发育的厚3~4km的中地壳低速层有关(Zhang et al., 2007)。 深度> 15km后, 海域的P波速度大于陆域, 可能与海域莫霍面抬升、 地壳拉张减薄(Xia et al., 2010; Wan et al., 2017)、 因铁镁质岩浆低侵产生的厚2~3km的下地壳高速体等因素有关(Yan et al., 2001; Wang T K et al., 2006)。
| 表2 陆域和海域最小一维P波速度模型 Table2 Minimum 1-D VP velocity model in onshore and offshore area |
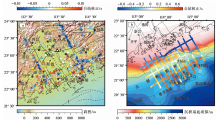
我们在最后一次反演时同时计算了台站校正结果。 台站校正能反映台站下方浅层介质的横向不均一性对反演结果的影响。 台站校正为正值, 说明P波到时较晚, 台站下方的介质呈现低速异常; 反之, 则说明P波到时较早, 台站下方介质呈现高速异常。 图 8 分别给出了陆域和海域台站校正量的空间分布。 由于F01台位于陆域台阵的中心位置, 且台基为基岩, 观测环境安静, 到时拾取清晰, 故将其作为陆域的参考台。 由于5366台(实际为5366气枪激发点)位于海域中心, 且激发效果较好, 故将其作为海域参考台。 设参考台的台站校正量为0s, 射线追踪计算时考虑震源和台站高程影响(陆域台站的高程范围为-15~635m, 海域为-84~350m), 且认为海域中距离2km内的台站具有相同的台站校正值。
 | 图 8 陆域和海域台站校正值的空间分布图 a 陆域台站校正结果, 以F01台为参考台, 台站校正量为0s, 三角形为流动和固定地震台, 圆点组成的测线为3条深地震测深加密测线, 颜色代表台站校正量的大小: 红色为正, P波到时较晚; 蓝色为负, P波到时较早; 底图为数字高程数据。 b 为海域台站校正结果, 以5366台为参考台, 底图为沉积基底埋深(Cao et al., 2018)Fig. 8 Spatial distribution of station corrections in onshore and offshore area. |
由 图8a和 图 1 可见, 陆域台站校正量空间分布与地形和地质构造有较好的相关性, 台站校正量为正的台站多分布在珠江三角洲断陷沉积盆地内, 如三水、 东莞、 顺德、 中山和新会等。 盆地内的地层以河流相砂层、 砂砾层和海相粉砂质淤泥为主, 故波速较低。 燕山期花岗岩、 震旦系变质砂岩和泥盆系灰岩等基岩出露地区的介质波速较高, 故台站校正多为负值。 由 图8b和 图 1 可见, 海域部分的浅层介质具有较强的横向差异, 故台站校正值整体比陆域大80%。 台站校正值的空间分布与海上反射地震反演的沉积基底埋深(Cao et al., 2018)具有较好的空间相关性, 即: 沉积较厚的位置(珠江口盆地内)台站校正值为正, P波到时较晚, 地下介质呈现低速; 而沉积较薄的位置则相反。 台站校正值为负的台站均分布在滨海断裂带北侧, 且其空间分布明显受NE向滨海断裂带的控制。 向S跨入珠江口盆地北部断阶带后, 台站校正值逐渐增加, 且以正值为主, 断阶带内台站校正值的空间分布与沉积厚度的相关性较好。 进入中央坳陷带后, 台站校正值全部为正值。 其中, 恩平凹陷、 西江凹陷和惠州凹陷内的台站校正值较高, 而恩西低凸起和惠西低凸起内的部分台站校正值相对较低。
为进一步验证模型的可靠性, 使用本文获得的一维模型对该区地震进行了重新定位, 并与华南一维模型(范玉兰等, 1990)的结果进行比较。 观测报告来自广东省数字地震台网, 时间为2007年6月— 2020年1月, 震级范围为ML0.0~4.1。 剔除震中距> 120km的观测数据, 最终得到的数据中陆域有58个台站, 425个地震, 3 168个P波震相, 3 509个S波震相; 海域有15个台站, 234个地震, 1 069个P波震相, 1 130个S波震相。 首先, 利用改进的和达法(Matrullo et al., 2013)得到陆域和海域的平均波速比分别为1.683(确定系数R2为0.997, 拟合标准差为0.525)和1.685(确定系数R2为0.997, 拟合标准差为0.555)。 然后, 使用新一维P波速度模型和拟合的平均波速比推出区域S波速度结构, 再使用simul2000程序, 保持速度结构固定, 分别对陆域和海域的地震进行了重新定位。
由 图 9 可见, 与华南一维模型相比, 新的模型走时残差更小, 且更集中于0s附近。 陆域P波的走时残差RMS值由0.31s降低至0.24s, 降低了22.6%, S波走时残差RMS值由0.33s降低至0.26s, 降低了21.2%; 海域P波走时残差RMS值由0.35s降低至0.26s, 降低了25.7%, S波走时残差RMS值由0.32s降低至0.27s, 降低了15.6%。 新模型震中距较大的震相走时残差相对较大, 可能是由于反演主要使用的Pg震相的穿透深度不足, 深部结构的分辨没有浅部好, 也可能是由于观测台站较少且方位角覆盖不好或初始震中有较大误差所致。 但由于该区的地震多为15km以浅的浅源地震( 图9b, c), 总体而言新模型对区域地震定位效果更好, 走时残差更小。
 | 图 9 基于新、 旧模型的地震重定位结果 a 地震震中分布图, 陆域部分剔除了新丰江水库地震, 灰色圆点为观测报告中的震中位置, 黑色三角形为地震台站; b 陆域地震深度剖面; c 海域地震深度剖面。 d— k分别为利用本文模型和华南一维模型重定位后的地震P和S震相走时残差分布图Fig. 9 Earthquake relocation results using 1-D velocity model in this study and South China 1-D velocity model. |
本文利用2015年珠江口海陆过渡带三维人工深地震探测数据, 使用VELEST程序分别反演了南海北部陆缘珠江口地区陆域和海域的最小一维P波速度模型和台站校正结果, 并结合人工地震和天然地震的走时残差以及台站校正值的分布特征分析了新模型的可靠性。 主要结论如下:
(1)新模型对人工地震走时拟合精度较高, 迭代反演后, 陆域走时残差均方根值为0.07s, 海域为0.21s。 陆域和海域一维模型相比, 在深度6km以浅, 陆域的P波速度为5.22~5.99km/s, 海域的P波速度较陆域明显偏低, 为2.11~6.03km/s; 在6~15km深度范围内二者波速相当, 陆域比海域稍低; 深度> 15km后, 海域P波速度大于陆域。
(2)台站校正结果的空间分布与区域地形和地质构造有较好的相关性。 陆域珠江三角洲沉积盆地因浅层沉积波速较低, 台站校正多为正值。 而花岗岩、 变质砂岩等基岩出露地区则因介质波速较高, 台站校正多为负值。 海域台站校正与沉积厚度相关性较好, 并受NE向滨海断裂带控制。 滨海断裂带北侧因沉积较薄, 台站校正多为负值; 滨海断裂带南侧的珠江口盆地因沉积显著增厚, 台站校正均为正值, 且与盆地内的凹陷和凸起有较好的相关性。
(3)新模型的地震定位精度优于华南一维模型。 与华南一维模型相比, 重定位后的地震走时残差下降幅度较大, 陆域P波降低了22.6%, S波降低了21.2%; 海域P波降低了25.7%, S波降低了15.6%。 新模型对区域地震定位效果更好。
本文获得的珠江口陆域和海域最小一维P波速度模型可为区域地震定位、 震源参数和三维速度成像等研究提供重要基础数据。
致谢 广东省地震局、 中国科学院南海海洋研究所、 中国地震局地球物理勘探中心和 “ 海调6号” 全体船员参加了野外观测工作; 中国地震科学台阵提供了部分流动观测设备; 南海所夏少红研究员对OBS数据处理提供了指导; 审稿专家为本文提出了宝贵的修改意见; 文中图件采用GMT(Wessel et al., 2013)绘制。 在此一并表示感谢!
| [1] |
|
| [2] |
|
| [3] |
|
| [4] |
|
| [5] |
|
| [6] |
|
| [7] |
|
| [8] |
|
| [9] |
|
| [10] |
|
| [11] |
|
| [12] |
|
| [13] |
|
| [14] |
|
| [15] |
|
| [16] |
|
| [17] |
|
| [18] |
|
| [19] |
|
| [20] |
|
| [21] |
|
| [22] |
|
| [23] |
|
| [24] |
|
| [25] |
|
| [26] |
|
| [27] |
|
| [28] |
|
| [29] |
|
| [30] |
|
| [31] |
|
| [32] |
|
| [33] |
|
| [34] |
|
| [35] |
|
| [36] |
|
| [37] |
|
| [38] |
|
| [39] |
|
| [40] |
|
| [41] |
|
| [42] |
|
| [43] |
|
| [44] |
|
| [45] |
|
| [46] |
|
| [47] |
|
| [48] |
|
| [49] |
|
| [50] |
|
| [51] |
|
| [52] |
|
| [53] |
|
| [54] |
|
| [55] |
|
| [56] |
|
| [57] |
|
| [58] |
|
| [59] |
|
| [60] |
|
| [61] |
|
| [62] |
|
| [63] |
|
| [64] |
|
| [65] |
|
| [66] |
|
| [67] |
|
| [68] |
|