


中亚塔拉斯-费尔干纳断裂现今的走滑速率及其分段变化特征——基于GPS观测的深究
[代成龙 , 张玲
, 张玲* , 梁诗明, 张克亮, 熊小慧, 甘卫军]
, 张玲, 梁诗明, 张克亮, 熊小慧, 甘卫军]
|
|


〔作者简介〕 代成龙, 男, 1995年生, 现为中国地震局地质研究所构造地质学专业在读博士研究生, 主要从事GPS数据处理和地壳形变方面的研究, E-mail: daichenglongies@163.com。
塔拉斯-费尔干纳断裂沿NW向斜切西天山山脉, 以愈千km的规模尺度构成了中亚地区重要的区域构造边界带。 早年和近期的许多地质研究结果均显示该断裂具有强烈的活动性, 所估计的全新世滑动速率高达8~20mm/a, 但GPS大地测量的简略估算结果却表明其现今整体的滑动速率仅约为2mm/a甚至更低。 文中基于塔拉斯-费尔干纳断裂周边大范围的最新GPS速度场资料, 通过断裂两侧远、 近场地壳的差异运动分析、 断裂沿线最大剪切应变率定量类比, 以及借助半无限弹性空间三维断裂位错模型的严密反演, 证实了该断裂现今仅具有中等偏弱的活动强度: 塔拉斯-费尔干纳断裂存在分段活动性, 其西北段、 中段、 东南段的右旋走滑速率分别为(2.1±0.7)mm/a、 (3.3±0.4)mm/a和(2.4±0.7)mm/a, 即中段的速率略大于西北段和东南段, 但量值均不突出, 远低于目前大多数地质结果所估计的高速率。 同时, 根据区域无自旋参考框架下断裂两侧远、 近场GPS速度矢量的差异甚微的特征, 认为塔拉斯-费尔干纳断裂现今的低滑动速率并非断裂强闭锁的暂态表现。
The Talas-Fergana Fault(TFF)with a total length of more than 1 000km is a large dextral strike-slip fault across the West Tianshan Mountains in the northwest direction. The fault plays an important role in accommodating deformation in Central Asia and has attracted much attention by geologists due to the huge controversy in its strike-slip rate and kinematic pattern. Previous studies indicated that its average dextral strike-slip rate is 8~20mm/a since Late Holocene based on offset ephemeral stream valleys and14C dating method. Some researchers recently updated the strike-slip to 2.2~6.3mm/a by the application of multiple dating methods(10Be,26Al,36Cl, luminescence, and radiocarbon)and satellite images with higher precision. But the strike-slip rates derived from modern GPS velocity field are only~2mm/a or even as low as 0.8mm/a. Thus, there is a substantial divergence between geological results and geodetic results in the strike-slip rate of the TFF. Some scholars believe that the huge difference between the geological rate and the rate obtained by geodetic measurements is caused by fault locking. In this study, the updated GPS data was used to establish velocity field of the West Tianshan Mountains relative to the stable Eurasian framework and the velocity field without self-rotation. The velocity field shows that the Tianshan Mountains are under intense crustal shortening and deformation. Moreover, for the TFF, as an important boundary fault in the western Tianshan Mountains, whether the far velocity field or the near velocity field, the differential movement of the crust is not obvious. And far-field velocity vectors away from the TFF show that there is minor difference of crustal movement along the fault. The TFF does not have the typical characteristic of locked fault that there is a big difference in velocities of far-field vectors, but a small difference in that of near/mid-field vectors. Thus, the activity of the fault is weak actually.
To further illustrate the overall low slip rate of the TFF, we compare the maximum shear strain rate and its distribution characteristics along the Altyn Fault and the Haiyuan Fault with large slip rates with the results of the TFF. The maximum shear strain rates along the Altyn Fault and the Haiyuan Fault are concentrated along the fault, and are as high as~60nano strain/a and~40nano strain/a, which are much larger than the overall maximum shear along the TFF. This shows that the sliding rate of the TFF is much lower than the strike-slip rate of the Altyn Fault of 9~15mm/a, and even slightly lower than the sliding rate of the Haiyuan Fault of 4~8mm/a. Therefore, we are more certain that the current activity rate of the TFF is far less than 8~20mm/a estimated by some geological methods.
The half-space elastic dislocation model is used to more rigorously re-constrain the current strike-slip rate of the TFF. The results show that the fault is divided into three segments. The TFF dextral strike-slip rate increases from the northwest section to the middle section and decreases from the middle section to the southeast section. And the strike-slip rates of the northwestern, middle and southeastern segments are(2.1±0.7)mm/a, (3.3±0.4)mm/a and(2.4±0.7)mm/a, respectively. The TFF is dominated by strike-slip motion, but there is also a weak dip-slip motion in the middle section of the TFF, with a magnitude of about 1mm/a.
The above results confirm the current low strike-slip rate of the TFF obtained by GPS which is much less than the strike-slip rate of 8~20mm/a estimated by geological methods. And through the GPS results, it is certain that the TFF presently has a low fault activity rather than a locked fault. To reconcile the high geological strike-slip rates and the geodetic results, a new deformation pattern of the West Tianshan Mountains may be needed. And more detailed GPS observations are required to explore whether the TFF has penetrated into the southern foreland basin of the West Tianshan Mountains.
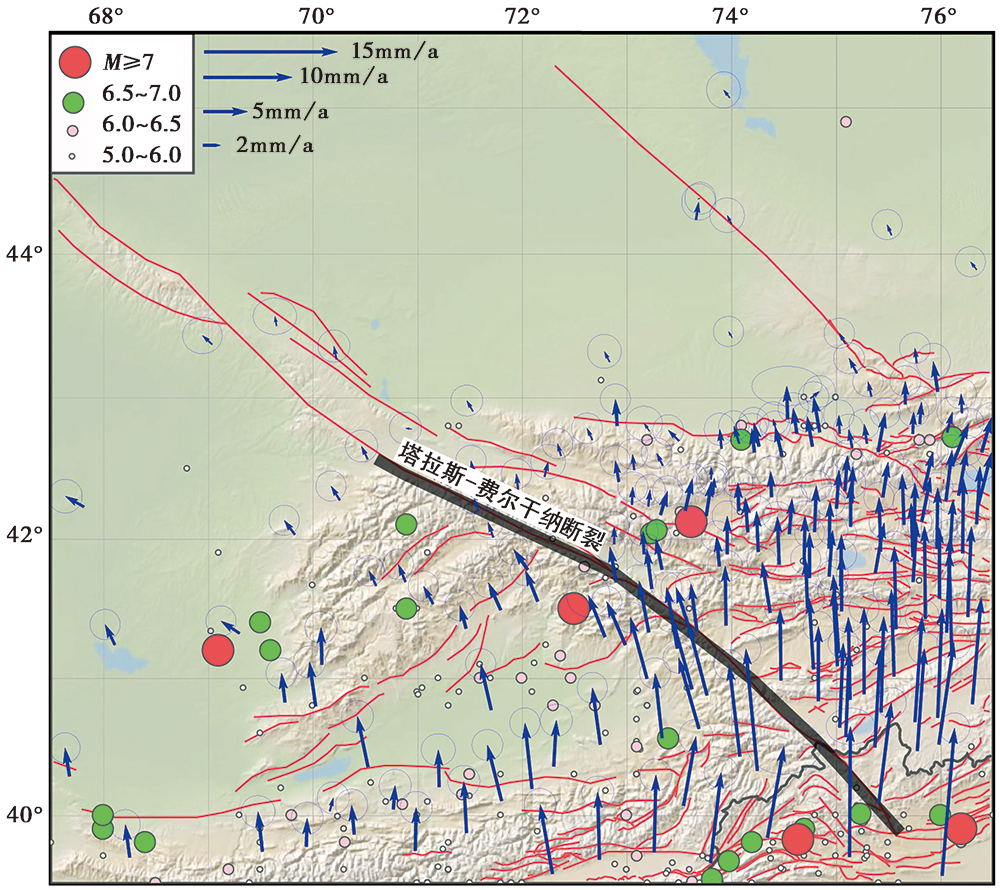
塔拉斯-费尔干纳断裂是一条沿NW向斜切西天山山脉的大型右旋走滑断裂, 全长> 1 000km, 西起哈萨克斯坦的克孜尔奥尔达(Kyzylorda)东部山区, 向SE途经塔拉斯山脉(Talas Mountains)、 费尔干纳盆地(Ferghana Valley)东北缘和阿特巴什盆地(At-Bashi Basin)西南缘, 进入中国新疆喀什地区, 遁迹于新生代强烈褶皱的地层之下(罗金海等, 2004; 李江海等, 2007)(图 1)。
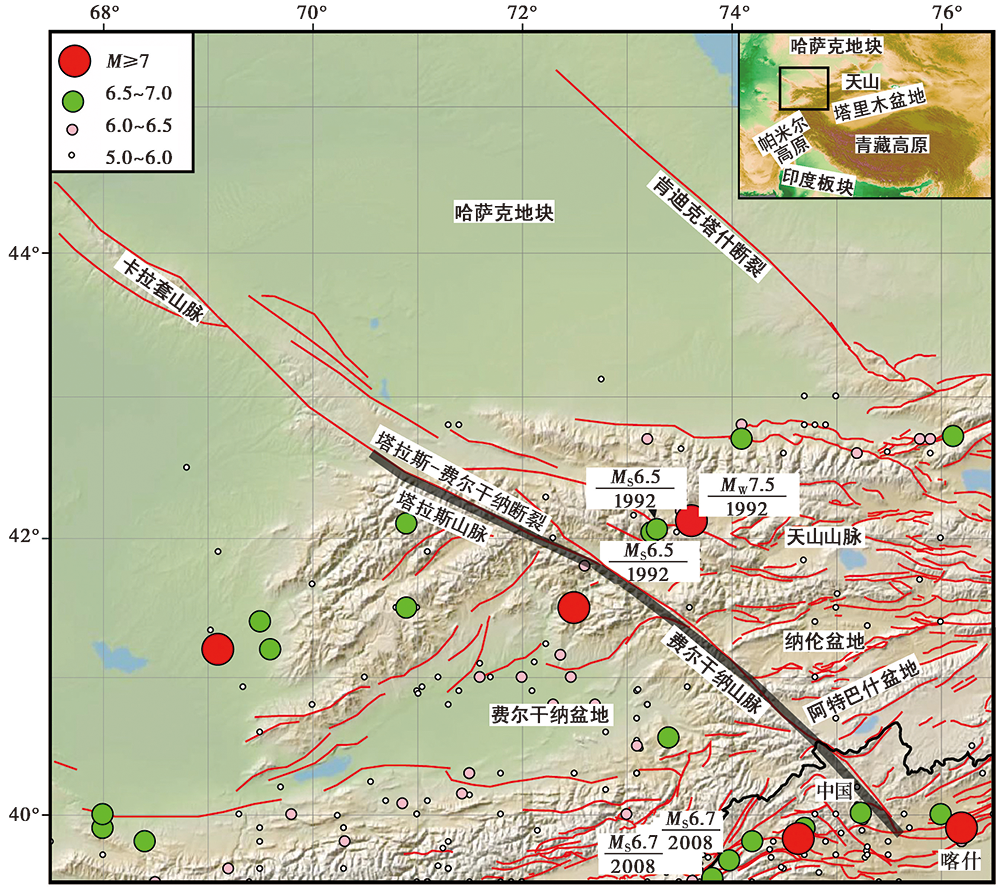 | 图 1 塔拉斯-费尔干纳断裂相关区域的地形地貌、 主要活动断裂和中— 强地震(M≥ 5, 1900— 2020年)分布图 塔拉斯-费尔干纳断裂在西天山众多活动断裂中具有非常突出的规模尺度, 但其沿线鲜有中— 强地震展布; 地震数据来源于宋治平等(2011a, b); 子图的矩形框表示本区域在印度-欧亚造山带中的位置Fig. 1 Topography and geomorphology, and distribution map of the main active faults and moderate-strong earthquakes(M≥ 5, 1900— 2020)of the area related to the TFF. |
鉴于塔拉斯-费尔干纳断裂突出的规模尺度及其在中亚区域构造分界上所扮演的重要角色, 人们对其现今或最新地质阶段(如全新世— 第四纪以来)的滑动速率或活动强度倍加关注。
高分辨卫星影像解译和野外实地调查均表明, 塔拉斯-费尔干纳断裂全线均有清晰、 易辨的全新世右旋走滑断错地貌(Burtman et al., 1996)。 前人曾基于一系列标志性断错距离和相应的定年结果, 估算出该断裂的走滑速率高达8~20mm/a。 例如, Burtman等(1996)沿断裂选取了一系列断错山脊, 并根据14C定年结果估算出其全新世以来的右旋走滑速率为8~16mm/a; Korzhenkov等(2014)和Rust等(2018)采用类似的经典地质学方法, 在其他区段也得到了10~20mm/a的右旋走滑速率结果。 但Rizza等(2019)采用多种测年方法(10Be、26Al、 光释光和14C测年)并用的策略, 同时配合高精度卫星影像解译的断错洪积扇估算的走滑速率仅为2.2~6.3mm/a。 以上地质结果间的显著差异令人困惑, 而更加令人困惑的是, 基于GPS大地测量所估算的现今走滑速率仅为2mm/a(Abdrachmatov et al., 2002; Zubovich et al., 2010), 甚至低至0.8mm/a(杨少敏等, 2008)。 显然, 这种不同学科甚至同一学科所得结果的巨大差异, 促使我们思考和追问: 1)前人基于GPS观测所得到的低滑动速率是否可靠?塔拉斯-费尔干纳断裂现今或最新地质阶段的活动速率到底是大是小?2)如果GPS观测所得低速率可靠, 是否为一些学者所猜测的 “ 断裂强闭锁” 的暂态表现(Rust et al., 2018)?
为此, 本研究拟以塔拉斯-费尔干纳断裂相关区域最新整合的GPS观测资料(Wang et al., 2020)为约束, 采用较为严密的 “ 半无限弹性空间三维断裂位错模型” 反演方法(Okada, 1992; Gan et al., 2007), 确定该断裂不同区段现今的走滑速率及其分段变化特征, 并探讨其运动学模式以及目前各种估算速率结果存在显著差异的可能原因。
本文收集了Wang等(2020)提供的181个GPS观测站的速度场资料, 其整合了Kreemer等(2014)、 Zubovich等(2010)发表的多渠道数据。 表1汇总了这些数据的观测方式、 时间跨度等简要信息, 总体反映出这些GPS速度场数据对于本研究区域的地壳形变分析和约束具有较好的可靠性(精度)和可用性(密度)。 特别需要指出的是, 本研究区域在1990— 2020年的30a间共发生M6.5及以上强震5次, 包括1992年发生于吉尔吉斯斯坦塔拉斯中部的2次MS6.6地震、 2008年中国新疆乌恰西MS6.7、 MS6.8地震和1992年吉尔吉斯斯坦楚河州西南MW7.5地震。 在这些强震震中附近50km范围内, 仅零星分布了一些GPS观测站(图 1, 2)。 因此, 本文所收集的GPS速度场资料并未受到这些强震同震形变或震后形变的显著影响, 总体上较好地反映了区域地壳的震间形变特征, 可有效地用于地壳形变分析和断裂运动速率的反演约束。
| 表1 本文所用GPS速度场资料的情况概要 Table 1 Summary of GPS velocity field data used in this paper |
图 2 为相对稳定欧亚参考框架的GPS地壳运动速度场。 为了更加直观地凸显区域内部的差异地壳形变, 我们采用下列方法去除了区域GPS速度场的整体刚性旋转成分(Gan et al., 2007): 首先, 基于本区域内所有GPS观测站的速度矢量, 以球面欧拉刚性旋转的运动模式拟合出一套最佳的欧拉矢量参数((28.53 2° ± 0.190 1° )N, (25.45 0° ± 0.090 5° )E, (0.066 6° ± 0.114 5° )/Ma); 然后, 从速度场中扣除该欧拉旋转的理论速度场, 从而使残余的速度场达到 “ 整体无自旋” 。 虽然这一 “ 整体无自旋” 的GPS速度场不具明确的绝对构造运动含义, 但其能够更加直观地凸显区域内部的地壳差异运动, 包括相对挤压、 拉张和扭错等相对运动现象(图 3)。
 | 图 2 塔拉斯-费尔干纳断裂相关区域的GPS水平运动速度场 相对于稳定欧亚参考框架, 误差椭圆代表95%置信度Fig. 2 GPS horizontal velocity field in the TFF area. |
 | 图 3 塔拉斯-费尔干纳断裂相关区域 “ 整体无自旋” 的GPS水平形变速度场 误差椭圆代表95%置信度Fig. 3 The GPS horizontal velocity field of the TFF area without self-rotation. |
结合区域活动构造背景, 可从图 2 和图 3 中直观地看出以下地壳形变特征:
(1)天山造山带承受着最强烈的地壳缩短变形, 最大缩短速率> 15mm/a。 以塔拉斯-费尔干纳断裂为界, 以东的西天山造山带表现出强烈的近SN向挤压, 绝大部分变形通过造山带的挤压缩短和地壳抬升被吸收; 而在断裂以西的西天山地区, 最大挤压速率减少至6~8mm/a。
(2)塔拉斯-费尔干纳断裂虽为西天山的重要分界断层, 但无论从断裂远场还是近场速度矢量来看, 现今地壳的差异运动均不明显。 断裂两侧的GPS速度场仅反映出微弱的右旋走滑, 逆冲或拉张作用均不明显, 说明该断裂的整体活动性并不强烈。
(3)塔拉斯-费尔干纳断裂中段两侧的地壳运动差异强于西北段和东南段, 但因中段两侧的活动构造复杂, 并非所有的差异运动均由该断裂所承担, 故中段的运动速率亦不显著。
(4)费尔干纳盆地显示出微弱的挤压和逆时针旋转特征。
利用离散分布的GPS速度场计算空间上连续的地壳应变率场, 目前有诸多方法和策略可借鉴, 例如最小二乘配置、 距离加权、 多面函数、 张力样条、 Kriging插值和多尺度球面小波等(Gan et al., 2007; 武艳强等, 2009; 江在森等, 2010; 刘晓霞等, 2014; Shen et al., 2015; 苏小宁等, 2016)。 虽然这些方法因假设条件不同使计算结果有所差异, 但差异并不显著, 不会对区域地壳应变场的特征分析结论产生实质性影响。 本文采用Gan等(2007)所使用的应变率计算方法: 首先, 利用二维 “ 高张力样条” (τ =0.95)内插算法(Wessel et al., 1998)对离散分布的GPS速度场进行0.3° × 0.3° 均匀内插加密; 然后, 根据每个0.6° × 0.6° “ 田” 字网格边界及内部的9个内插速度矢量, 计算出相应0.6° × 0.6° 网格内的均匀主应变率张量(图 4), 并进而计算出最大剪应变率(图 5a)。 由于走滑断裂沿线的最大剪应变率大小直接反映断裂剪切变形的强弱, 故可以据其定量地判定断裂走滑速率的强弱程度。
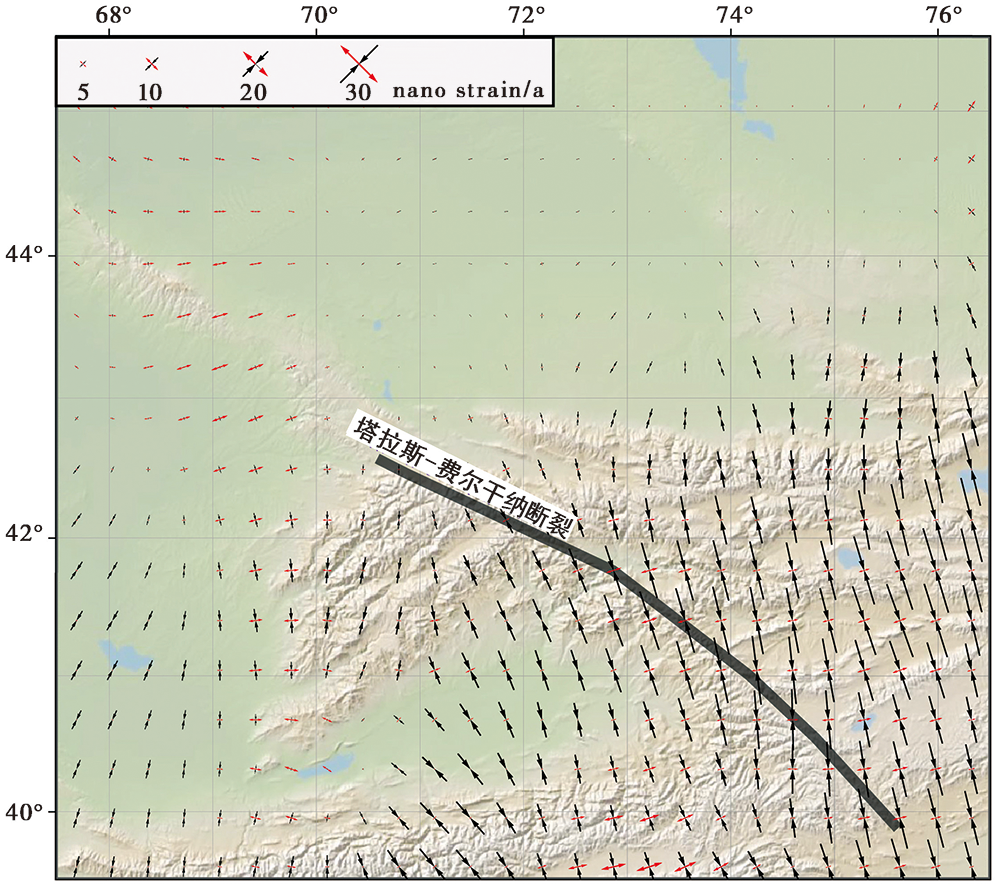 | 图 4 塔拉斯-费尔干纳断裂相关区域现今的地壳主应变率场Fig. 4 The current crustal principal strain rate field in the area related to the TFF. |
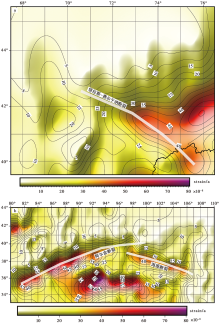
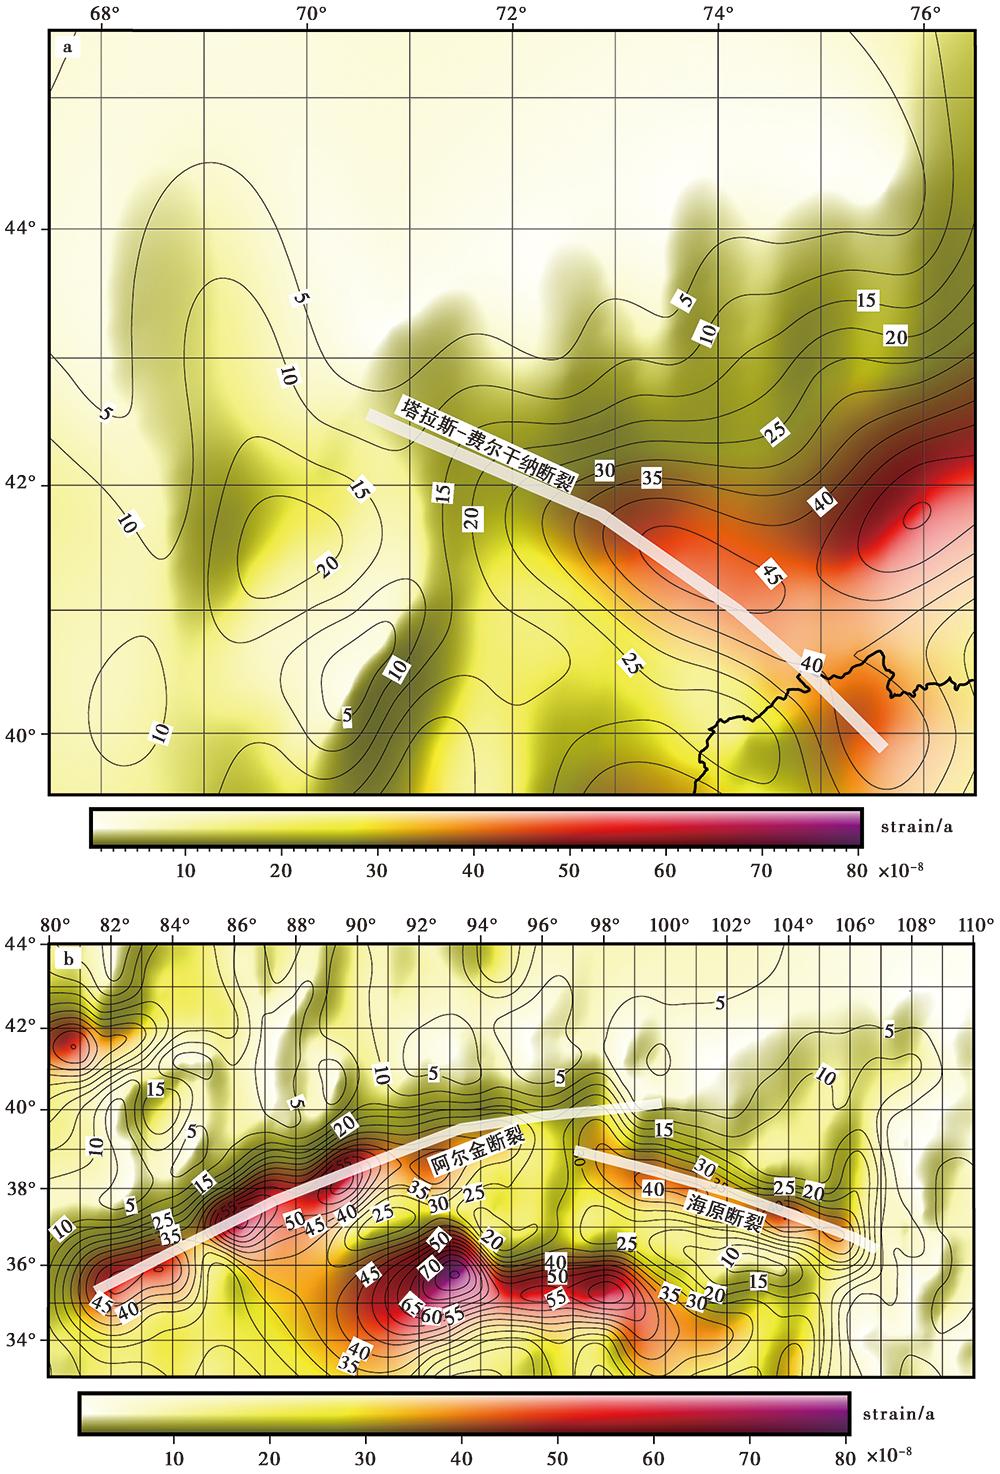 | 图 5 a 塔拉斯-费尔干纳断裂相关区域现今地壳的最大剪应变率; b 青藏高原北缘阿尔金断裂和海原断裂沿线地区的最大剪应变 对比图a、 b可知, 塔拉斯-费尔干纳断裂的走滑强度远低于阿尔金断裂, 甚至弱于海原断裂Fig. 5 The current crustal maximum shear strain rate in the area related to the TFF(a), and the maximum shear strain map of the area along the Altyn Fault and Haiyuan Fault on the northern margin of the Tibetan plateau(b). |
综合图 4 和图 5a的地壳应变率图, 可以看出以下主要特征:
(1)西天山造山带承受的挤压应变为NNW向, 大致与天山山脉的走向正交, 典型量值高达40~50nano strain/a, 并且向W逐渐减小。
(2)哈萨克地块内部的应变率非常小, 典型量值< 10nano strain/a, 表明哈萨克地块内部变形微弱, 比较稳定。
(3)在整个塔拉斯-费尔干纳断裂西北段沿线的近场区域和断裂两侧的中场区域, 最大剪应变率均非常低, 仅为10~20nano strain/a, 这表明该断裂段的剪切错动较弱。
(4)在费尔干纳盆地东北缘的一个小区段内, 塔拉斯-费尔干纳断裂两侧的GPS差异运动速度场似乎显示了较为显著的近场差异, 但远场差异不显著。 与之相对应的是, 该区段的最大剪应变率也存在局部高值(约45nano strain/a), 但并未集中于断裂附近。
为了进一步直观地说明塔拉斯-费尔干纳断裂总体的低滑动速率, 我们选取青藏高原北缘地区, 将具有较大滑动速率的阿尔金断裂和海原断裂沿线的最大剪应变率及其分布特征与塔拉斯-费尔干纳断裂的结果进行对比, 得到以下结论:
前人对阿尔金断裂和海原断裂的滑动速率开展了大量研究, 得到的地质和GPS观测结果有很好的一致性。 例如, 徐锡伟等(2003)在卫星影像判读和野外断错地貌位移测量的基础上, 结合地质年代学方法得到阿尔金断裂不同段落的全新世左旋走滑速率, 其中西段可达(17.5± 2)mm/a, 而GPS大地测量的估计结果也高达9~15mm/a(Gan et al., 2007)。 利用地质方法估算的海原断裂的走滑速率结果为3~12mm/a(袁道阳等, 1997; Lasserre et al., 1999; 何文贵等, 2000), GPS大地测量的估算速率为4~8mm/a(甘卫军等, 2005; 崔笃信等, 2009; Jolivet et al., 2012, 2013)。 我们同样采用Wang等(2020)所提供的GPS速度场资料计算了青藏高原北缘区域的地壳最大剪切应变率(图 5), 可以看出阿尔金断裂和海原断裂沿线的最大剪切应变率集中于断裂沿线区域, 且分别约达60nano strain/a和40nano strain/a, 远大于塔拉斯-费尔干纳断裂沿线的总体最大剪切应变率, 这说明塔拉斯-费尔干纳断裂的滑动速率远小于阿尔金断裂的9~15mm/a的走滑速率, 甚至要低于海原断裂4~8mm/a的滑动速率。 因此, 我们认为塔拉斯-费尔干纳断裂的现今活动速率并没有一些地质学方法所估算的8~20mm/a那样强。
为了更加精确地定量分析塔拉斯-费尔干纳断裂不同区段现今的走滑速率及其分段变化特征, 我们以GPS速度场为约束, 采用较为严密的 “ 半无限弹性空间三维断裂位错模型” (Okada, 1985, 1992)构建地壳运动速度场与区域断裂运动速率之间的相互关系, 并由此反演滑动速率。 根据该模型的运动学解析关系, 弹性体内任意矩形几何面的滑动(走滑和倾滑)所引起的地表某一点的位移三分量均与滑动面的滑动量成正比。 三分量各自的比例系数由该点与滑动面的相对位置、 滑动面的大小、 倾角、 深度和介质参数惟一确定。 如果存在多个矩形滑动面, 则地表某一点的位移是由这些矩形面各自滑动所引起的该点位移的简单叠加。 在具体应用中, 人们通常可将一条震间期的活动断裂模型化为一系列上部层闭锁、 下部层 “ 无限” 向下延伸并持续匀速滑动的 “ 断层段矩形滑动面” 的组合(Savage et al., 1997)。 其中每一个断层段的矩形滑动面可具有不同的尺度、 倾角、 闭锁深度和滑动速率。 这种断裂运动的几何学模型已被广泛地用于解释GPS地壳形变场和断层震间滑动之间的相互关系(Gan et al., 2007; Savage et al., 1997)。
塔拉斯-费尔干纳断裂的相关区域分布着大大小小一系列活动断裂。 理论上, 我们的GPS速度场或形变场包含着每条断裂运动的贡献, 但从现实可行和抓主要矛盾的角度出发, 在断裂的建模过程中只能考虑到一系列主要断裂。 这种做法的合理性是基于许多小断裂的规模和运动所产生的地表形变在影响范围和量值上均非常微弱, 可以忽略不计。 基于上述的考虑和策略, 本研究选取了9条主要断裂(图 6), 并利用数字化的活动断裂资料将其模型化为一系列上部闭锁耦合、 下部自由错动的 “ 矩形片” 的组合(图 7)。 在闭锁深度方面, 根据前人的研究结果, 如张国民等(2005)认为新疆地区的平均震源深度为(21± 3)km、 Wang等(2011)给出的新疆整体地区平均闭锁深度为9km, 在以上深度合理区间范围内, 结合研究区域MW> 6.0地震的震源深度, 分别设定各段断裂的闭锁深度。 每个断裂的建模几何参数(包括分段、 倾角、 倾向和闭锁深度等)如表2所示。
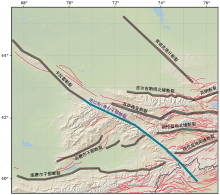
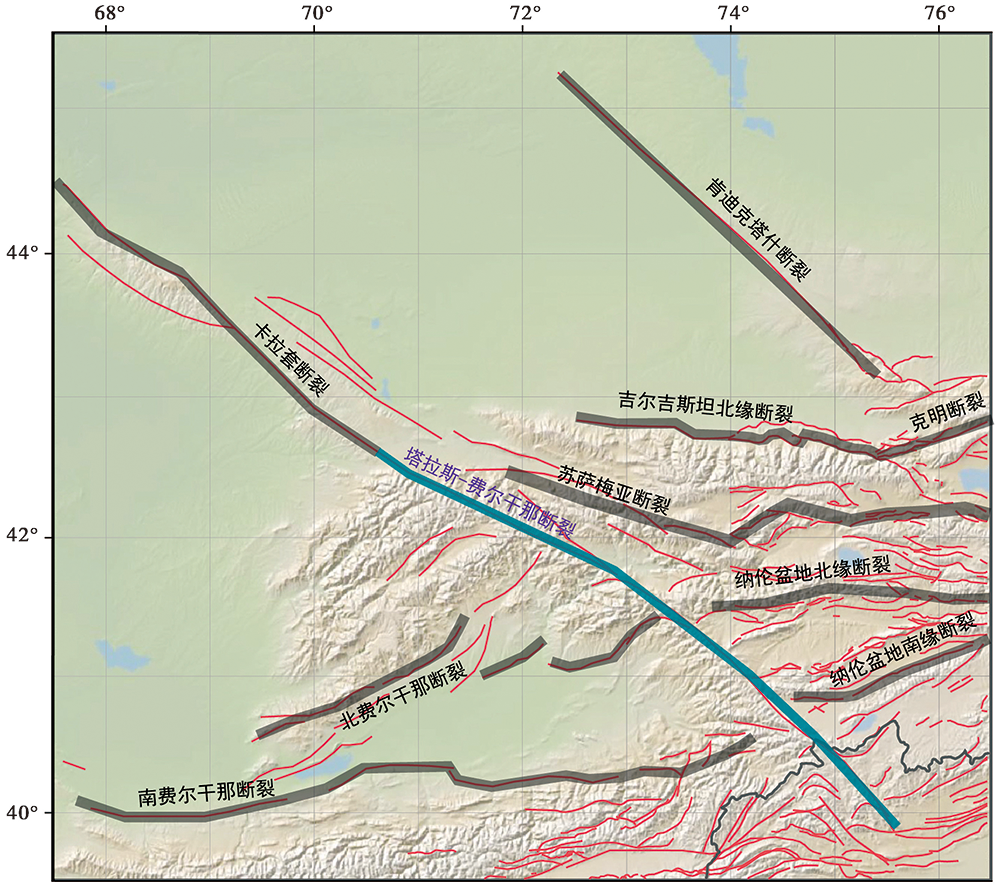 | 图 6 本研究在断裂运动速率的GPS速度场约束反演中所考虑的主要活动断裂Fig. 6 The main active faults considered in the GPS velocity field constrained inversion of the fault motion rate in this study. |
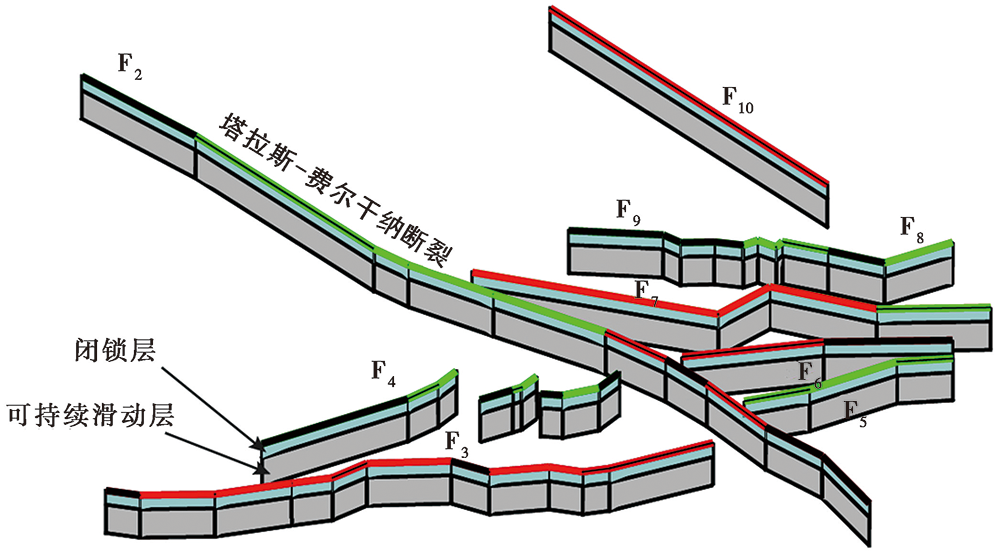 | 图 7 模型化的区域主要断裂带的三维示意图 F2卡拉套断裂; F3费尔干纳盆地南缘断裂; F4费尔干纳盆地北缘断裂; F5那伦盆地南缘断裂; F6那伦盆地北缘断裂; F7苏萨梅亚断裂; F8克明断裂; F9吉尔吉斯山北缘断裂; F10肯迪克塔什断裂Fig. 7 A three-dimensional schematic diagram of the main fault zones in the modeled area. |
| 表2 断裂的参数及反演结果 Table 2 Fault parameters and inversion results of the model |
基于断裂带三维几何模型, 若为每个断层段赋予已由地质等方法所确定的滑动速率, 则可通过半无限空间弹性位错模型正演计算出每个GPS观测点的三维速度矢量。 反之, 如果将所有或部分断裂的滑动速率作为未知参数, 那么通过GPS速度场的约束, 借助于半无限空间弹性位错模型, 可反演获得各个断层段的运动速率。 这里, 我们采用美国地质调查局(USGS)的成熟软件(Savage et al., 1997; Gan et al., 2007), 进行了最小二乘拟合反演。
图 8 展示了GPS速度场和最佳模型的理论速度场及其残差。 可以看出, 模型的反演值与实际观测值在整体上可较好吻合(图 8a)。 GPS站点速度拟合残差大部分< 3mm/a, 接近2~3mm/a的平均观测精度(图 8b— d)。
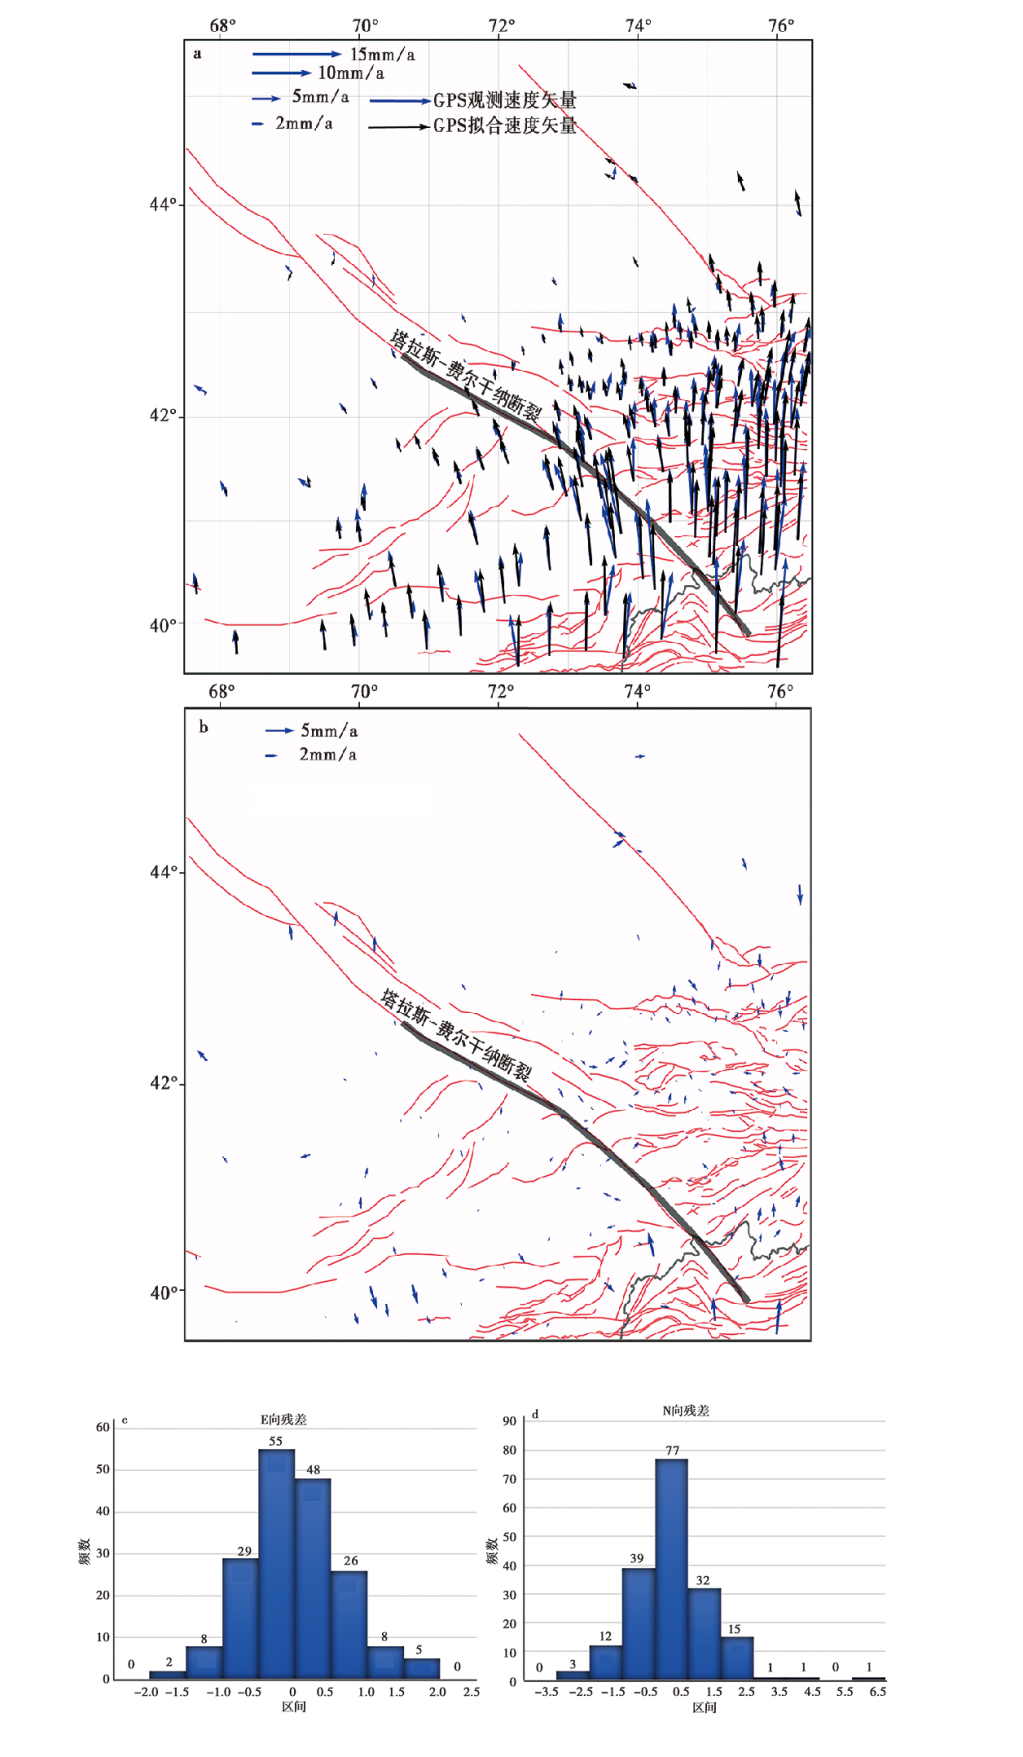 | 图 8 GPS速度场模型拟合效果图 a 实际观测的GPS速度矢量和模型拟合的速度矢量; b 模型拟合残差图; c E向残差分布; d N向残差分布Fig. 8 Fitting effect diagram of GPS velocity field model. |
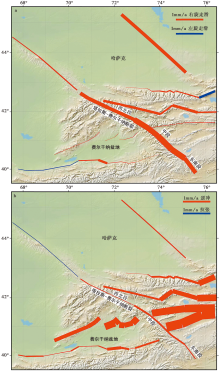
表2列出了主要断裂各区段现今滑动速率的反演结果。 图 9中, 以线条的粗细程度表示断裂运动速率大小的差异, 直观地展示了各断裂的走滑速率和倾滑速率的大小。
 | 图 9 GPS约束最佳拟合反演的主要断裂运动速率示意图 a 主要断裂走滑(左、 右旋)运动速率示意图; b 主要断裂倾滑(逆冲、 正断)运动速率示意图Fig. 9 Schematic diagram of the main fault motion rates from the GPS-constrained best-fit inversion. |
反演结果表明:
(1)塔拉斯-费尔干纳断裂存在分段活动性, 其西北段、 中段和东南段的右旋走滑速率分别为(2.1± 0.7)mm/a、 (3.3± 0.4)mm/a和(2.4± 0.7)mm/a(图 9a), 即中段的速率略大于西北段和东南段, 但量值均不突出。 这一结果与前人利用地质方法所估计的8~20mm/a的强烈走滑速率(Burtman et al., 1996; Korzhenkov et al., 2014; Rust et al., 2018)存在巨大的差异, 但与Rizza等(2019)采用多种测年方法所估算的2.2~6.3mm/a的结果比较一致。
(2)塔拉斯-费尔干纳断裂以走滑运动为主, 但在塔拉斯-费尔干那断裂中段也存在微弱的逆冲运动, 量值约为1mm/a(图 9b)。
塔拉斯-费尔干纳断裂虽然在整个中亚地区具有引人注目的规模和尺度, 但基于GPS速度场约束得到的其西北段、 中段和东南段的右旋走滑速率分别为(2.1± 0.7)mm/a、 (3.3± 0.4)mm/a、 (2.4± 0.7)mm/a, 其中段还伴有约1mm/a的微弱倾滑运动。 断裂带的走滑速率整体上约为3mm/a, 表明该断裂现今的运动并不强烈, 这与前人基于GPS大地测量数据所得到的结果(Abdrachmatov et al., 2002; 杨少敏等, 2008; Zubovich et al., 2010)基本一致, 而且契合了塔拉斯-费尔干纳断裂沿线自1770年以来鲜有破坏性中强地震发生的事实(Buslov et al., 2003)。 虽然通过地质手段得到的研究结果推算出塔拉斯-费尔干纳断裂具有高达8~20mm/a的全新世滑动速率(Burtman et al., 1996; Korzhenkov et al., 2014; Rust et al., 2018), 但最近得到的低至2.2~6.3mm/a的滑动速率结果(Rizza et al., 2019)与GPS大地测量结果具有较好的一致性。
针对地质结果和GPS结果之间的巨大差异, Rust等(2018)曾提出塔拉斯-费尔干纳断裂或许现今正处于 “ 强闭锁” 状态, 故GPS观测获得了低滑动速率。 但是, 通过GPS地壳运动速度场矢量可以看出, 无论是塔拉斯-费尔干纳断裂沿线两侧的近场还是远场的差异运动都很弱, 并未呈现出 “ 远场差异大、 近场或中场差异小” 的典型 “ 强闭锁” 特征。 同时, 最近有研究也表明断裂沿线的应变积累和释放在不同时间尺度上都呈现相对稳定的状态(Vernant, 2015; Gold et al., 2017)。 因此, 我们认为塔拉斯-费尔干纳断裂的现今运动状态是 “ 弱活动” 而非 “ 强闭锁” 。
除了斜向贯穿天山山脉的塔拉斯-费尔干纳断裂的滑动速率(2.4~3.3mm/a)非常低以外, 其北部与之相连的卡拉套断裂现今的走滑速率也极低, 为< 1mm/a(图 9a)。 那么, 现今斜向的大型走滑断层在分担垂直于天山山脉的SN向挤压中的作用非常有限, 占据非常次要的地位, 并没有地质滑动速率所揭示的作用那么巨大。 同时, 塔拉斯-费尔干纳断裂走滑速率的分段性也印证了其具有次级调节作用。 其西北段和东南段的走滑速率明显小于中段的速率, 即断层沿线的走滑速率从NW到SE呈现低、 高、 低的现象。 我们发现, 前人利用地质方法测算断层走滑速率的调查点均位于现今走滑速率最高的中段, 这在一定程度上使得塔拉斯-费尔干纳断裂现今GPS观测的低速率与地质学方法所得的高速率达成了 “ 和谐” 。 但是, 现今速率和地质手段所揭示的长期运动速率的差异仍是十分显著且巨大的。 我们认为现今天山的主要变形方式表现为山体的SN向缩短和垂直抬升(杨少敏等, 2008)。 那么, 这是否意味着自塔拉斯-费尔干纳断裂形成以来, 天山地区的变形方式曾经发生过大规模的转变?同时, 具有较高走滑速率的断层中段对应着较高的局部应变和显著的近断层速度差异, 是否意味着这一区段存在断层的浅层蠕滑?其两侧强烈运动的EW走向的逆冲断层对它具有怎样的影响?最后, 塔拉斯-费尔干纳断裂是否已经深入至西天山南缘山前盆地内部?以上这些问题还需要借助更加精细的GPS观测结果加以探索。
致谢 中国特种设备研究院周德敏博士为本文提供了部分区域地质资料; 中国地震局地质研究所李涛研究员为本文提供了境外断层数据; 中国地震局地质研究所陈杰研究员为本文提供了重要的修改意见。 在此一并表示感谢!
| [1] |
|
| [2] |
|
| [3] |
|
| [4] |
|
| [5] |
|
| [6] |
|
| [7] |
|
| [8] |
|
| [9] |
|
| [10] |
|
| [11] |
|
| [12] |
|
| [13] |
|
| [14] |
|
| [15] |
|
| [16] |
|
| [17] |
|
| [18] |
|
| [19] |
|
| [20] |
|
| [21] |
|
| [22] |
|
| [23] |
|
| [24] |
|
| [25] |
|
| [26] |
|
| [27] |
|
| [28] |
|
| [29] |
|
| [30] |
|
| [31] |
|
| [32] |
|
| [33] |
|
| [34] |
|
| [35] |
|
| [36] |
|
| [37] |
|