
基于时-空ETAS模型的新疆伽师地区背景及触发地震活动的探讨
[张盛峰1, 2)  , 张永仙
, 张永仙2) , 范晓易3) ]
, 张永仙|
|


〔作者简介〕 张盛峰, 男, 1988年生, 2019于中国地震局地球物理研究所获固体地球物理专业博士学位, 现为中国地震局地震预测研究所博士后, 主要从事地震预测预报基础理论及统计地震学研究, 电话: 15806417170, E-mail: 085012104@163.com。
新疆伽师地区历史上发生过多次 MS6.0以上地震, 2020年1月19日该地区再次发生了 MS6.5地震。 这些地震属于独立的背景地震活动, 还是与已发生的其他地震存在一定的相互触发关系?探索与此问题相关的背景地震活动和触发地震活动特征, 对深化这一区域地震活动特征的认识具有重要意义。 为此, 文中利用时-空ETAS模型对该区1970年1月1日以来的地震序列进行分析, 拟合得到了较为稳定可靠的模型参数, 给出了区域背景地震活动水平、 表示地震活动丛集特征的丛集率指标及包含背景及丛集活动的总活动水平等结果, 并利用随机除丛方法将背景地震活动与丛集活动剥离开来, 得到了每个地震事件作为背景事件或触发余震事件的概率。 结果显示, 研究区北部与南部的背景地震活动和触发丛集活动存在明显差异, 丛集地震活动为总体地震活动的主要成分; 计算结果表明, 此次 MS6.5地震被触发的可能性达99%, 其中2020年1月18日 MS5.3地震对其触发贡献最大, 达94%; 在对其他地震事件具有触发贡献的个体中, 2020年4月21日 ML4.1地震 “干预”其他事件发生过程的平均能力相对较高, 达0.505, 但需要通过其他手段进一步佐证。 文中工作是中国地震局开展的针对此次地震的虚拟科考工作的一部分, 所得结果可以为后续深入研究该地震提供帮助。
Several earthquakes above MS6.0 occurred in Jiashi, Xinjiang region in China in history. A new MS6.5 event occurred in this area on Jan. 19, 2020, for which a ‘virtual scientific investigation’ was carried out by China Earthquake Administration in a short time after the earthquake. In this ‘virtual investigation’, a vital important question is that which fault controls the occurrence process of this event, and what is the correlation between this event with other previous earthquakes. To understand the solutions of these questions well, the seismologists analyzed different types of monitoring data, the source parameters, focal mechanisms, seismic waves, InSAR data, regional tectonics, seismic activity including the aftershock sequence, abnormalities of CH4 and GPS TEC, etc. Some conclusions can be drawn on the features of this earthquake and the potential of large aftershocks based on analysis of these kinds of data.
Statistical seismology tools may provide a significant constraint in the case that some earthquakes cannot be described very well through traditional approaches. Concerning the seismicity in the Jiashi area, whether this earthquake is independent background seismicity, or has a certain triggering relationship to the other previous events, is a main question to be well answered during this research. So, to explore the features of the background events and the triggering ability of the events in this area, we used the spatial-temporal epidemic type aftershock sequence(ETAS)model to fit the seismicity using the earthquake events from Jan. 1, 1970 to Jun. 1, 2020 to obtain the spatial and temporal distribution of total seismicity rate, background seismicity rate and clustering seismicity rate. Then the stochastical declustering method based on ETAS model was used to separate all the events into background events and clustering events. The result shows that the clustering seismicity has a main contribution to the total seismicity in this region. The north and south part of the study area show different features of background and triggering seismicity. The north part shows a more homogenous spatial distribution of background seismicity, while the south part shows a high level of triggering or clustering seismicity. Through the calculation of the ETAS algorithm, this MS6.5 event has a 99%probability of being a triggered event, in which the main contribution is from an MS5.3 event that occurred 1 day before this event. On the other hand, we find that among all of the events which have contribution to others, an ML4.1 event that occurred on Apr. 21, 2020 has the highest ability to ‘disturb’ the other events, the probability reaches 0.505, but this needs to be confirmed by other methods. As generally recognized by seismologists, this MS6.5 event and other previous large earthquakes are mainly influenced by the western Himalayan syntaxis in this region.
As everyone knows, to find the statistical solutions for these questions based on the stochastic or statistical theory, we need focus on the analysis of large group events, rather than a single one. Some algorithms and methods of statistical seismology seem to provide us an opportunity to analyze the group features of seismicity in the study region. Through the analysis using spatial-temporal ETAS model, we can use the statistical methods to describe the spatial and temporal behavior of the background and triggered events, and obtain some special information which cannot be obtained effectively with other traditional tools in some cases. In addition, the traditional ETAS models have been rapidly expanded and developed in recent years, such as 3D-ETAS model incorporating focal depth information, and the finite element ETAS model incorporating the element of spatial morphology of the seismogenic faults. In this view, we can suggest that statistical seismology approaches may have a chance to supply a significant balance point between the pure scientific research and the earthquake consultation work in the future, especially between the conventional seismic research and operational work in China.
2020年1月19日21时27分, 新疆喀什地区伽师县(39.83° N, 77.21° E)发生了MS6.5地震, 震源深度为16km。 此次地震发生在青藏高原西构造结的NE侧, 与中国地震科学实验场所在的青藏高原东构造结遥相呼应。 为加强对中国地震科学实验场区外发生的典型地震的研究, 中国地震局开展了针对此次地震的虚拟科考工作。 其中, 针对这一地区的背景地震活动和触发地震活动进行时空特征分析, 将为更好地回答与这一地震相关的科学问题提供重要参考。 为此, 本工作利用时-空ETAS模型分析地震序列特征, 从统计地震学的角度探索本地区背景地震活动和触发地震活动的分布规律, 以进一步深入认识此次地震的相关性质。
通过传统方法判断某个地震事件属于背景地震活动还是被触发的余震活动往往较为困难(Helmstetter et al., 2003), 通常需要对其及主震所处的时空范围进行对比加以确定(Keilis-Borok et al., 1980)。 然而, 地震活动的丛集特征在不同的研究区域存在差异, 这为有效识别余震活动带来了困难。 因此, 若干识别方法被相继提出, 如基于窗口(windows-based)(Utsu, 1970; Gardner et al., 1974)和基于关联(link-based)(Reasenberg, 1985)的去丛方法等。 在使用这些方法进行判定时, 优化时空窗参数或关联距离的选取较为依赖于研究人员的主观经验, 同时, 一些不应该被判定为余震的事件常被确定性地删除, 从而导致有用信息受到损失(Zhuang et al., 2005)。 以传染型余震序列(Epidemic Type Aftershock Sequence model, ETAS模型)为代表的统计模型主要是以分支点过程的形式研究地震丛集的时空发生行为(Kagan, 1991; Musmeci et al., 1992; Rathbun, 1996; Ogata, 1998, 2004; Console et al., 2001, 2003; Zhuang et al., 2002; Ogata et al., 2003)。 通常, 这些模型将地震活动性分为2部分, 即背景地震活动和丛集活动。 其中每个地震事件, 无论是来自背景成分(通常假定为时空泊松过程, 稳定或非平稳, 均质或非均质), 还是由另一个事件触发生成, 都会根据一些分支规则产生(触发)自己的后代(余震)。 为了获得准确去丛的目录, Zhuang等(2002, 2004)提出了一种随机去丛方法作为传统方法的替代方法。 在这种方法中, 不再划定地震是背景事件还是由其他事件触发, 而认为每个事件都有可能是背景事件或其他事件触发的直接后代, 根据用于描述地震丛集特征的一些模型估计每个事件的概率。 由于这一方法所基于的时-空ETAS模型可以较好地描述地震活动的行为, 并且可在概率分布上定量分析背景地震活动和触发地震活动, 因此在研究背景地震或触发地震方面得到了广泛应用(蒋长胜等, 2010, 2013; 龙锋等, 2010; 蒋海昆等, 2012; Kawamura et al., 2013; Yoder et al., 2014; Kattamanchi et al., 2017)。
目前, 已有多种分支过程(Branching Processes)模型用于描述地震活动的时-空丛集特征(Ogata, 1988, 1992, 1998; Kagan, 1991; Musmeci et al., 1992; Rathbun, 1993; Console et al., 2001, 2003), 这些模型一般用条件强度函数的形式(Daley et al., 2007)表示地震发生率。 本工作使用的随机除丛法主要基于Ogata(1998)给出的时-空ETAS模型, 其涉及的基本原理已在相关文献中有系统描述(Omori, 1894; Utsu, 1970; Ogata, 1978, 1998; Rathbun, 1993, 1996; Console et al., 2003; Daley et al., 2003; Ogata et al., 2006; Zhuang et al., 2006), 这里不再赘述。
随机除丛方法的关键就是对点过程的 “ 瘦化” 运算, 地震i对其后发生的在地震j处(tj, xj, yj)的总地震发生率的相对贡献可表示为
其中,
表示地震i触发 “ 子震” 过程的发生率。 因此可以将ρ ij看作地震j被地震i触发的概率, 即地震j作为地震i “ 子震” 的概率。 同理, 地震j作为背景地震的概率为
而地震j被之前地震触发的概率, 即丛集地震概率可表示为1-φ j。
Zhuang等(2002)的算法分为同时求取背景地震活动强度和模型参数的迭代算法以及随机除丛法2部分。 可以看出, 与传统的删除余震算法所不同的是, 随机除丛法为每个地震事件的性质赋予1个概率值, 利用 “ 家谱” 的形式描述丛集地震, 即每个 “ 子震” 根据相关概率随机地找到自己的 “ 母震” , 提供了可针对去丛效果进行定量评估的不确定度。
本工作使用了中国地震台网中心产出的震源区(38.83° ~40.83° N, 76.21° ~78.21° E)1970年1月1日— 2020年6月21日的正式地震目录数据, 区域地震空间分布见图 1, 可见研究区北部的活动断裂较多, 多呈NE向分布, 南部地区多为平坦的沙漠地区, 而本地区ML3.5以上的地震事件在空间上同样呈现明显的南、 北分布差异: 北部地区的地震活动分布相对分散且广泛, 而南部地区则相对集中, MS6.0以上地震主要分布于中部地区。 表1和图 2e给出了本地区发生的4个MS6.5以上地震事件的目录及其在累计频次曲线上所处的位置。
 | 图 1 1970年1月1日— 2020年6月21日研究区ML> 3.5地震的空间分布 黑色实线为断裂, 黄色、蓝色和红色实心圆分别表示震级范围ML3.5~5.9、 ML6.0~6.4和6.5级及以上地震事件, 左上角给出了本研究区所在的位置Fig. 1 Spatial distribution of events above ML3.5 during Jan. 1, 1970 to Jun. 21, 2020 in the study region. |
| 表1 研究区1970年1月1日— 2020年6月21日MS6.5以上地震事件 Table 1 List of events above MS6.5 from Jan. 1, 1970 to Jun. 21, 2020 in the study region |
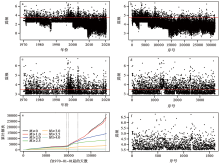
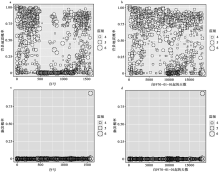
 | 图 2 研究区1970年1月1日— 2020年6月21日地震目录的若干分析 a 全部地震事件的震级-时间分布; b 全部地震事件的震级-序号分布; c ML3.0以上地震事件的震级-时间分布; d ML3.0以上地震事件的震级-序号分布; e 不同震级范围的地震事件随时间的累计频次变化曲线; f ML3.5以上地震事件的震级-序号分布。 a— d中红色横线表示ML=3.5标尺的位置; e中垂直虚线表示研究区发生的MS6.5以上地震事件的发震时刻Fig. 2 Analysis for the earthquake catalog during Jan. 1, 1970 to Jun. 21, 2020. |
科学评估地震目录的完整性水平并较为稳妥地选择所需要的截止震级MC是较好地应用时-空ETAS模型的前提条件。 本工作使用的目录包含ML和MS 2种震级标度, 一般4.5级以上取MS 震级, 以下取ML震级。 为科学评估本地区地震目录的完整性水平, 这里采用与地震目录相关的若干可视性方法对其进行分析。 图 2 给出了研究区所包含地震事件的震级-时间、 震级-序号、 震级累计频次等统计结果。 从图 2a、 b中可以看出, 自2000年以来研究区的地震监测水平得到大幅提升, 尤其是2010年以后可记录到研究区0级以下事件; 从图 2c、 d中可以看出, 研究区发生的1996年MS6.8、 1997年MS6.5和2003年MS6.7地震均触发了一定数量的余震事件, 这一现象也在图 2e中的不同震级事件累计频次随时间的变化曲线中有所显示, 但1970年以来的累计频次曲线同样说明从ML3.5开始的累计频次曲线不再明显地受几个强震所影响。 图 2d、 f所示的震级-序号分布显示, 在1997年4月11日MS6.5地震震后短时间内, 由于背景噪声或强余震波形的影响, 没有充分识别ML3.5以下的余震事件, 导致这些事件缺失, 造成震后的 “ 空白三角” 现象。 由于时-空ETAS模型进行地震活动拟合时对地震事件的数量有一定要求, 若综合考虑整个研究区域1970年以来的地震序列, MC取ML3.5可较好地保证地震目录的完整性程度, 如图 2a— d中的红色横线所示。 考虑到模型所需地震数量和完整性水平二者的平衡性, 本文将ML3.5作为模型拟合所使用的参数。
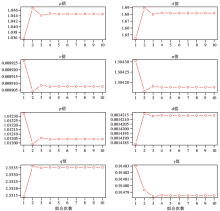
除截止震级MC外, 时-空ETAS模型还需要设定若干用于计算的参数, 包括目录起始时间、 模型起算时间、 模型参数初始值和最小带宽等。 图 3 为截止震级取ML3.5, 拟合起始时刻tc取1970年1月1日时计算得到的时-空ETAS模型参数随拟合次数的变化情况。 可见, 经过10次模型拟合, 最终取得了较为稳定的模型参数, 而获取稳定可靠的模型参数又是针对地震活动进行随机除丛处理的基础。
 | 图 3 截止震级MC取ML3.5、 拟合起始时刻tc取1970年1月1日时计算得到的时-空ETAS模型参数随拟合次数的变化情况Fig. 3 Variation of model parameters with fitting times using the input parameters of MC=ML3.5 and tc=1970-01-01. |
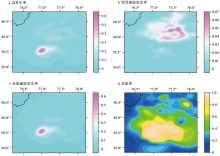
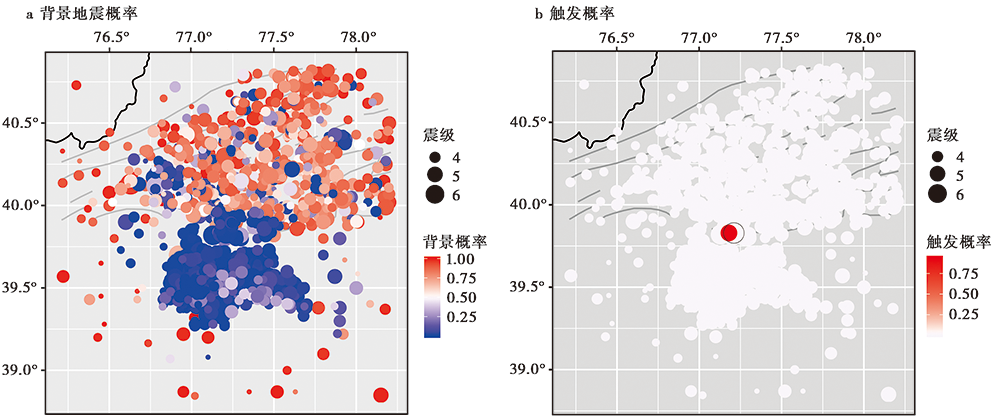
获取可靠的模型参数后, 进而可计算得到研究区空间总地震发生率、 背景地震发生率、 丛集地震发生率和丛集率空间分布, 结果如图 4 所示。 可以看出, 研究区北部的背景地震活动水平较高且分布相对均匀, 南部多为触发的丛集活动。 对于整个区域而言, 丛集地震活动对总体地震活动的贡献最大。 图 4d中的丛集率结果显示, 南部区域的丛集率接近1.0, 但范围更大。 可见, 虽然该区域的背景地震发生率不高, 但一旦发生较强的地震事件, 后期易触发一定数量的余震事件, 同时也容易造成震后短时间内的余震记录缺失现象。 这一区域内的地震互相触发作用及断层活动机制也在前人的研究中有所提及(张竹琪等, 2008)。
 | 图 4 时-空ETAS模型计算得到的空间总地震发生率(a)、背景地震发生率(b)、 丛集地震发生率(c)和丛集率分布(d) a— c 单位为事件个数/((° )2· d), 每个网格点的丛集率计算误差可通过总地震发生率或地震事件空间分布密度粗略估计Fig. 4 Spatial distribution of total seismicity rate(a), background seismicity rate(b), clustering seismicity rate(c), and cluster ratio(d). |
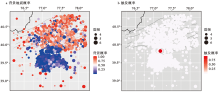
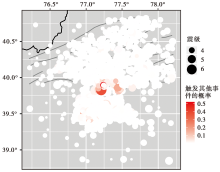
利用基于时-空ETAS模型的随机除丛方法可区分背景地震活动与触发丛集地震活动。 图 5a为给每个事件赋予背景事件概率后的地震活动空间分布, 若将0.5作为区分背景地震事件和触发地震事件的阈值, 则可看出背景地震事件大多较为均匀地分布于北部区域, 而受到触发的丛集事件主要集中于南部区域, 与丛集率高值区域及地震事件空间分布高密度区域一致。 经过计算, 此次MS6.5地震被触发的概率达99%, 说明其发生过程存在较强的触发作用。 图 5b给出了对此次MS6.5地震具有触发贡献的地震活动空间分布, 可以看出大部分事件对此次MS6.5地震的触发概率均较低, 仅2020年1月18日发生的MS5.3地震(图中红色圆点所示事件)对此次地震的触发贡献达到了94%(与图 6c, d对应)。
 | 图 5 随机除丛方法对背景地震活动及地震事件触发作用的分析结果 a 以色标形式表示背景地震事件概率水平的地震活动空间分布; b 伽师MS6.5地震发生前地震活动的空间分布, 其中色标表示这些事件对此次MS6.5地震(黑色圆圈)的触发贡献, 红色圆点表示对其触发贡献最大的2020年1月18日MS5.3地震Fig. 5 Analysis results of background events and their triggering contribution to earthquake events in the study region using the stochastic declustering method. |
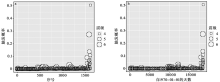
 | 图 6 基于随机除丛方法计算得到的地震事件背景地震概率随地震序号(a)、 时间(b)变化的分布和其他事件对2020年6月26日MS6.5地震触发贡献随地震序号(c)、 时间(d)变化的分布Fig. 6 Probability of each event as a background event vs. sequence number(a)and time(b), and contribution of others to the Jun. 26, 2020 MS6.5 event vs. sequence number(c)and time(d). |
为研究其他事件对此次地震触发贡献的时序变化, 与图 5 相对应, 图 6 给出了地震事件的背景地震概率及其他事件对2020年1月19日MS6.5地震触发贡献随地震序号和时间的变化分布。 从图 6a、 b中可以看出, 1996年MS6.8、 1997年MS6.5和2003年MS6.7地震均明显触发了大量余震事件, 而主要分布于北部地区的地震事件的背景地震概率结果在序号和时间上的分布较为均匀; 图 6c、 d为此次地震被触发的概率随地震序号和时间分布, 显示结果与图 5b一致。
与分析此次地震作为被触发余震的概率类似, 利用随机除丛方法同样可以得到研究地区地震事件个体对其他事件的触发贡献水平, 以便更清楚地看到哪些事件更 “ 容易” 干预其他事件的发生过程。 图 6 给出了研究区1970年以来ML3.5以上地震对其他事件触发贡献平均水平的空间分布, 可以看出这些容易触发其他个体的事件主要分布于此次MS6.5地震震源区周围, 即位于高背景地震活动的北部区域和多触发丛集事件的南部区域之间。 图 8 给出了与图 7 相对应的地震触发能力随时间和地震序号变化的图像, 可见在与图 7 所对应的地震事件中, 2020年4月21日ML4.1地震对之后地震事件发生过程的平均触发贡献达0.505, 表2给出了 “ 干预” 其他个体的能力排序靠前的几个事件的信息。 值得一提的是, 这一结果是基于当前所选区域和使用数据的条件下得到的模型计算结果, 与实际情况是否吻合, 仍需要开展更加细致的研究和调查。
 | 图 7 研究区自1970年1月1日以来ML3.5以上地震事件对其他个体的触发能力的空间分布Fig. 7 Spatial distribution of triggering contribution of each event above ML3.5 to others in the study region since Jan. 1, 1970. |
| 表2 研究区自1970年1月1日以来的地震事件对其他个体触发贡献平均水平排序靠前的地震事件 Table 2 Cases of top average contribution of each event triggering others since Jan. 1, 1970 in the study region |
 | 图 8 基于随机除丛方法计算得到的地震事件对其他个体触发贡献随地震序号(a)和时间(b)的分布Fig. 8 Contribution of each event to others vs. sequence number(a)and time(b). |
本工作针对新疆伽师地区, 利用时-空ETAS模型分析了震源区1970年以来的地震活动特征, 基于随机除丛方法在概率水平上区分了背景地震活动和触发余震地震活动, 结果显示研究区北部与南部分别呈现均匀分布的背景地震活动和触发丛集活动, 且丛集地震活动为总体地震活动的主要成分; 计算显示, 此次MS6.5地震被触发的概率为99%, 2020年1月18日MS5.3地震对其产生的触发作用较为明显, 达94%; 在对其他个体具有触发贡献的地震事件中, 2020年4月21日ML4.1地震 “ 干预” 其他事件发生过程的平均能力最高, 达0.505, 而这一结果是否与实际情况吻合, 需要通过其他手段进行详细研究。 值得一提的是, 本工作主要从统计模型的角度对研究区的群体事件进行了分析, 从概率出发分析了事件之间可能的触发关系, 而伽师地区由于受到所处西构造结的影响, 挤压变形明显, 强烈的地质活动特征与此地区多个强震的发生过程有较大关系(赵翠萍等, 2003; 徐锡伟等, 2006)。
以ETAS模型为基础的随机除丛方法可从概率水平上判定地震事件属于背景地震活动还是丛集地震活动, 这种工作思路成为衔接纯粹的科学研究和中国地震会商业务体系的有效桥梁。 虽然模型的部分结果受到与地震目录相关的因素影响, 如本文计算显示2020年4月21日ML4.1地震对之后地震事件的触发作用相对较高, 这一结果受到选取目录的截止时刻影响较大, 目前还无法确定是否与实际情况相符, 但对于一些利用其他手段无法有效解决的问题, 本模型的计算结果仍会给出参考。 在ETAS模型的不同应用场景中, 当前应用较多的情况仍然是将地震事件当作点源看待, 但随着这一模型的发展, 近年来也出现了增加震源深度约束的3D-ETAS模型(Ogata et al., 2019)和断裂空间形态的新模型(Guo et al., 2015), 而对于地震发生后需要快速了解触发概率等信息的地震会商工作而言, 建设与这些新模型相关的断裂数据库及提高震源深度的测定精度等是这些新模型能够得到较好应用的前提条件。 与模型中背景地震活动水平(μ )设置为固定值或可变值的操作类似, 判定某个地震事件属于背景地震活动还是触发地震活动的关键因素— — 概率阈值, 是否也需要根据特定的环境而进行调整? 例如, 在某些条件下, 当触发概率> 0.7则认为该事件为被触发的余震活动, < 0.3则认为其是背景地震活动等。 以上问题均需要针对模型和应用地区的地震活动性特点开展进一步研究。
致谢 本工作是针对2020年1月19日新疆于田MS6.5地震虚拟科考工作的一部分, 科考队专家在震后提供的相关分析结果为作者更好地认识此次地震提供了条件; 作者在日本数理统计研究所学习期间与庄建仓准教授、 Ogata Y教授、 郭一村博士等专家学习讨论了时-空ETAS模型的相关问题; 审稿专家为本文的修改完善付出了辛勤劳动。在此一并表示感谢!
| [1] |
|
| [2] |
|
| [3] |
|
| [4] |
|
| [5] |
|
| [6] |
|
| [7] |
|
| [8] |
|
| [9] |
|
| [10] |
|
| [11] |
|
| [12] |
|
| [13] |
|
| [14] |
|
| [15] |
|
| [16] |
|
| [17] |
|
| [18] |
|
| [19] |
|
| [20] |
|
| [21] |
|
| [22] |
|
| [23] |
|
| [24] |
|
| [25] |
|
| [26] |
|
| [27] |
|
| [28] |
|
| [29] |
|
| [30] |
|
| [31] |
|
| [32] |
|
| [33] |
|
| [34] |
|
| [35] |
|
| [36] |
|
| [37] |
|