


考虑区域特征的地震动模拟——以2020年伽师 MS6.4地震为例
[王宏伟 , 温瑞智
, 温瑞智* , 任叶飞]
, 温瑞智, 任叶飞]
|
|


〔作者简介〕 王宏伟, 男, 1990年生, 2017年于中国地震局工程力学研究所获防灾减灾工程与防护工程博士学位, 助理研究员, 主要研究方向为地震动特征及地震动预测, 电话: 15104547806, E-mail: whw1990413@163.com。
为研究伽师地区地震动的区域特征, 提高地震动预测的可靠性, 文中利用伽师地区近10a收集的强震动观测记录, 采用非参数谱反演方法分离了地震动的震源、 传播路径及场地影响, 建立了反映伽师地区地震动区域特征的路径衰减、 路径持时、 场地线性反应等经验模型, 并给出了伽师地区46次地震的震源参数(矩震级、 拐角频率和应力降)。 文中确定的伽师 MS6.4地震的矩震级为5.893、 拐角频率为0.362Hz、 应力降为6.684MPa。 伽师地区地震动的近场路径衰减较慢, 而远场更快的路径衰减与显著的非弹性衰减有关, 文中将伽师地区的路径衰减近似地描述为双段线性几何扩散经验模型和品质因子 Q=60.066 f0.988 表示的非弹性衰减项的叠加; 伽师地区地震动的路径持时较长, 明显高于四川地区; 对比SS14场地线性反应模型, 伽师地区局部场地对10~30Hz频段地震动的线性放大效应很弱, 其他频段的场地线性反应与SS14模型接近, 在此基础上提出了适用于伽师地区的SS14调整模型。 文中进一步将伽师地区地震动区域特征应用于伽师 MS6.4地震的地震动模拟, 震源破裂过程采用随机产生的震源运动学破裂模型表示, 通过对比观测和模拟记录的峰值和反应谱, 检验了区域特征的可靠性, 最后给出了伽师 MS6.4地震的地震动场。
The regional characteristics of seismic ground motion are of importance for its reliable prediction, and the resulting seismic hazard mitigation and seismic risk controllability. The Jiashi region in Northwest China, which is located in the boundary between the western segment of the South Tianshan and the northwest Tarim Basin, is subject to high seismic hazard due to the active seismicity. This region has frequently suffered from the moderate to strong earthquakes. For the purpose of investigating the regional characteristics of the ground motion in Jiashi region, we separated simultaneously the earthquake source spectra, propagation path attenuation, and site responses from the horizontal S-wave spectra in the 366 three-component strong-motion recordings with high quality after manual detection and selection based on the nonparametric spectral inversion technique. The datasets were recorded at 25 strong-motion stations in 46 earthquakes of M3.0~6.4 from July 2007 to February 2020 occurring in the Jiashi region, mainly including both Jiashi seismic sequences in 2018 and 2020.
We thus developed the region-specific empirical models for the Jiashi region, including the path attenuation, the path duration, and the linear site response models. At the same time, the source parameters theoretically depicting the omega-square source spectral model, including seismic moment MW, corner frequency fc, and stress drop Δ σ were retrieved from the inverted source spectra for the 46 earthquakes considered using the grid-searching method. Their reliability was further verified from the normalized fitting residuals between the inverted and theoretical source spectra varied with fc, and the fc- MW plots. We determined that MW=5.893, fc=0.362Hz, and Δ σ=6.684MPa for the MS6.4 Jiashi earthquake in 2020. According to the inverted path attenuation curves against hypocentral distance less than 120km, the ground motions generally show the slower path attenuation at local distances, while the faster path attenuation at regional distances was clearly found, which could be ascribed to the significant anelastic attenuation in the Jiashi region. The path attenuation in the Jiashi region was approximately modeled by the empirical expression, simultaneously including the hinged bilinear geometrical spreading model and the anelastic attenuation term in the function of quality factor Q. The yield Q values were regressed as 60.066 f0.988 at frequencies of 0.254~30Hz. The strong anelastic attenuation may be attributed to the prominent interaction of the seismic wave propagating within the high inhomogeneous crust. The transition distance R1=60km, and the geometrical spreading exponents n1=0.30 and n2=0.59 before and after R1 well defined the preferred hinged bilinear geometrical model. The site responses show the dependence on the VS30 values, and the higher amplifications are generally predominant at sites with the lower VS30 values, and vice versa. Compared with the linear site amplification model proposed by Syehan and Stewart(2014) for the NGA-West2 project, the local sites in the Jiashi region show the very weak amplification effects on the high-frequency ground motions at 10~30Hz, while the good consistencies at low-to-intermediate frequency bands occur. On the basis of the SS14 model, the modified model applicable for the Jiashi region was proposed in this study. The path durations, defined by an effective 95%~5%significant duration, were calculated for the strong-motion recordings(a total of 502)in the Jiashi region, and were applied for the development of the empirical model. The prolonged path durations were observed in those ground motions recorded in the Jiashi region, significantly higher than those observed in the Sichuan region.
Furthermore, the yield regional characteristics were preliminary examined by the ground motion simulations. The stochastic finite-fault method was further applied to reproduce ground motions in the MS6.4 Jiashi earthquake with these regional characteristics under consideration. The kinematic source models were first generated stochastically by the filtering method in the two-dimensional wavenumber domain. These stochastic source models can well represent the source rupture process in physical and its sufficient variability. We then verified the reliability of these regional characteristics from the good agreements of the ground motion intensity measures between the observations and the simulations, including the peak ground accelerations and velocities, and the spectra accelerations. Moreover, the key role of the regional characteristics in ground motion simulation was clearly showed by the significant deviations of the long-period ground motions at large distances between the observations and the simulations based on the path attenuation models in the Sichuan-Yunnan region. Finally, the ground motion maps were developed for the MS6.4 Jiashi earthquake according to the regional characteristics and a best-performing source kinematic rupture model.
The region-specific ground motion empirical models are very helpful for reliably predicting ground motions, and mitigating seismic hazards in the Jiashi region with the active seismicity.
伽师地区位于南天山西段与塔里木盆地西北部的交界区域, 受南天山向S的挤压作用, 北部发育有近EW向展布的柯坪塔格逆冲褶皱带, 位于迈丹断裂与柯坪塔格逆冲断裂之间, 南部塔里木盆地内则发育有隐伏断裂(刘启元等, 2000; 徐锡伟等, 2006), 诸多研究认为塔里木刚性块体向北部远程传递的印度板块向N推挤欧亚板块的压应力与该地区的构造变形有关(Laborde et al., 2019)。 地震活动性特别强烈的伽师地区曾发生过一系列中强以上的破坏性地震, 例如1996年阿图什MS6.9地震、 1997— 1998年伽师强震群、 2003年巴楚-伽师MS6.8地震、 2011年阿图什MS5.8地震、 2018年伽师MS5.5地震等。 1902年阿图什8 ¼ 级地震是该地区有记录以来发生的最大震级地震。 2020年1月19日柯坪塔格逆冲断裂西段发生了伽师MS6.4地震。 频发的中强以上地震对伽师地区的防震减灾工作提出了广泛需求, 可靠地预测地震动有助于减轻地震灾害与控制地震风险。
地震动是地震震源、 地震波传播路径及局部场地综合作用的结果, 因不同区域的地震构造、 地质构造、 地表土层形成等的差异, 地震动普遍具有明显的区域特征。 Boore等(2014)利用NGA-West2计划的强震动数据集揭示了不同区域(美国西部、 日本、 意大利、 中国台湾、 四川等)地震动非弹性衰减的显著差异及其对远场地震动衰减的影响; Xu等(2020)将中国南北地震带6次MW6.0~6.2地震的地震动残差分解为事件内残差和事件间残差, 发现高频地震动差异主要与地震应力降相关, 而远场地震动差异主要与区域非弹性衰减相关; Kale等(2015)在研究伊朗和土耳其地区地震动预测模型时发现2个地区地表浅层土层的剪切波速结构显著影响地震动强度; Boore等(2015)的研究表明美国东部地震动路径持时明显高于美国西部, 这可能与地壳介质差异导致的地震波衰减差异有关。 为提高地震动预测的可靠性, 有必要考虑地震动的区域特征, 强震动观测记录包含了地震动路径衰减、 场地效应等区域特征的重要信息。
布设于南天山西段的48个自由场强震动观测台站自2007年以来已陆续在60余次伽师地区M2.8~6.4地震中收集了超过500组三分量强震动观测记录(截至2020年2月), 这些观测记录为研究伽师地区的地震动区域特征提供了重要的基础数据。 目前已有学者利用伽师地区单次或几次地震的强震动观测记录分析地震动的路径衰减、 持时、 场地效应等(张振斌等, 2019; 李文倩等, 2020), 但尚未系统地给出伽师地区地震动的区域特征以及可用于地震动预测的经验模型。 本文利用伽师地区近10a来收集的强震动观测记录, 基于两步非参数谱反演方法分离地震震源谱、 地震波路径衰减及场地效应, 建立伽师地区的路径衰减、 路径持时、 场地线性反应等经验模型, 并利用区域经验模型模拟2020年伽师MS6.4地震的地震动, 通过对比模拟和观测记录检验本文给出的区域特征的可靠性, 最后模拟给出伽师MS6.4地震的地震动场。
本文基于强震动观测记录S波的两步非参数谱反演方法估计伽师地区的地震震源参数、 地震波路径衰减及场地效应, 建立该地区地震动区域特征经验模型。
两步非参数谱反演方法由Castro等(1990)提出。 第1步, 从地震动水平向S波傅氏谱Oij(f, Mi, Rij)中分离路径衰减项Aij(f, Rij), 即
其中, Mai(f)为与第i次地震的震级大小(Mi)相关的量, fm为第m个频率点的频率, Rij为第i个地震震源至第j个台站的距离。 求解式(1)时需给定路径衰减项的约束条件, 即参考距离R0处无路径衰减且路径衰减为距离的平滑曲线。 本文计算中将频率fm所有可用谱划分为ND, m个5km间距的距离段, 式(1)中以A(fm, Rk, m)代替A(fm, Rij), Rk, m表示第k个距离段内频率fm可用谱震源距的平均值。 第2步, 从S波傅氏谱中移除路径衰减项后分离得到震源和场地项, 即
求解式(2)时需分配震源和场地项之间的权衡, 一般采用参考场地作为约束条件。
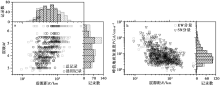
本文收集了伽师地区59次M2.8~6.4地震中48个强震动观测台站获取的502组三分量加速度波形记录, 记录的震源距主要为20~200km, 大多数记录的水平向峰值地面加速度(PGA)≤ 50cm/s2(图 1)。 依次采用基线校正、 记录首尾加余弦窗并补零、 巴特沃斯非因果带通滤波处理观测记录。 低通滤波的拐角频率统一设定为30Hz; 高通滤波的拐角频率(fhp)随记录变化: 首先根据2个经验关系给出fhp的预估值, 分别为记录最小可用频率(flb)与矩震级MW的经验关系(Yenier et al., 2015)和flb=1.25fhp(Abrahamson et al., 1997), 近似以中国地震台网中心发布的地震面波震级(MS)或地方震级(ML)作为MW初步估计fhp; 利用fhp预估值对记录进行带通滤波处理后, 通过人工检查记录的低频段傅氏谱形状判断fhp的预估值是否合适, 如果随频率降低呈下降的抛物线形则fhp预估值合适, 如果随频率降低呈先下降后翘起的抛物线, 则将fhp调高至翘起前的频率; 重复上述人工检查过程直至得到合适的fhp, 最终确定fhp为0.10~1.17Hz。 为了尽可能确保场地不出现非线性反应, 剔除了PGA> 100cm/s2的记录; 为了清晰地识别S波部分并尽可能消除触发阈值引起的地震动偏差(Abrahamson et al., 2016), 剔除了R> 120km的记录; 为了确保充分的数据冗余, 剔除了不能同时满足记录不少于3组的台站和地震的记录。 之后截取剩余的386组记录的S波窗, 首尾加余弦窗并补零处理后计算S波傅氏谱, 截取与S波窗长度相同的事前噪声窗, 进行相同处理后计算噪声傅氏谱和信噪比(SNR), 根据SNR> 5.0判断S波傅氏谱的可用频段。 最终, 本文选用了25个强震动台站在46次M3.0~6.4地震中获取的366组强震动记录进行谱反演分析, 选用的地震及台站分布如图 2 所示。 将谱反演选用记录的最小震源距作为参考距离R0, R0=20.33km。
 | 图 1 a 伽师地区强震动记录的震级-震源距分布; b 水平向PGAFig. 1 Magnitude vs. hypocentral distance(a), and the peak ground accelerations at both horizontal components(b)for strong-motion recordings in Jiashi region. |
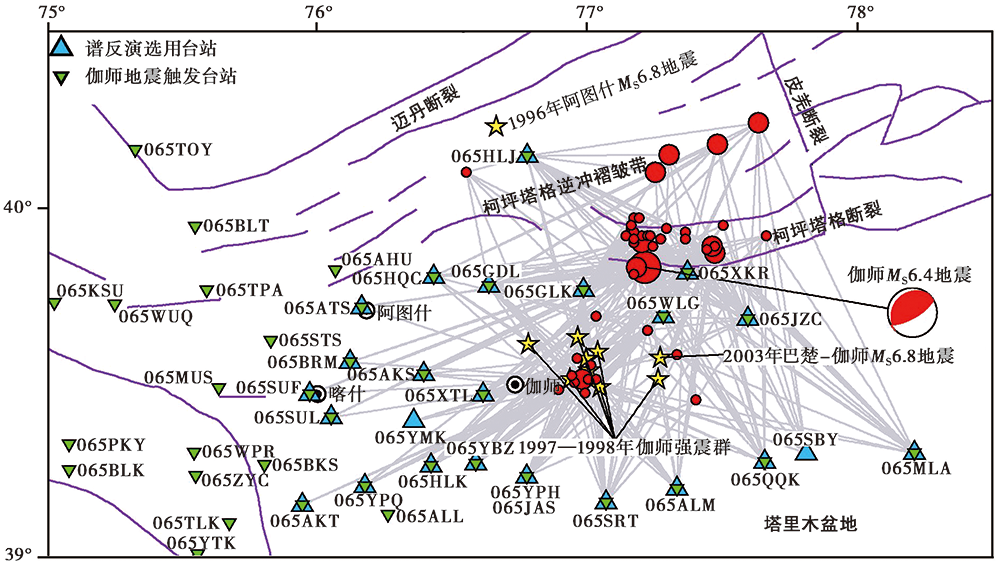 | 图 2 谱反演选用的地震(红色圆圈)及台站(蓝色三角形)分布 黑紫色实线为断层(邓起东等, 2003), 灰色实线为传播路径, 黄色五角星为部分6.0级以上历史地震Fig. 2 The epicenters of earthquakes(red circles)and the locations of strong-motion stations(blue triangles)considered in the spectral inversion analysis. |
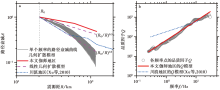
第1步谱反演给出了伽师地区不同频率的S波路径衰减曲线, 如图 3a所示。 路径衰减随震源距(R)增大而减小, 当R≤ 60km时路径衰减大体上介于(R0/R)0.5~(R0/R)1.0 之间, 当R更大时路径衰减普遍< (R0/R)1.0, 路径衰减曲线上凸说明随R增大其衰减速度明显增大, 这与显著的远场非弹性衰减有关。 采用频率无关的几何扩散项和频率相关的非弹性衰减项表示路径衰减, 不同几何扩散模型(线性、 双段或三段线性模型等)在拟合地震动的距离衰减时差异不明显(Bora et al., 2015)。 本文的几何扩散采用双段线性模型表示, 路径衰减可表示为
lnA(fm, Rk, m)=n1· ln(R0/Rk, m)+[fm/Q(fm)]· [-π (R0-Rk, m)/β ], Rk, m≤ R1
lnA(fm, Rk, m)=n1· ln(R0/R1)+n2· ln(R1/Rk, m)+[fm/Q(fm)]· [-π (R0-Rk, m)/β ], Rk, m> R1 (3)
其中, 剪切波速β =3.60km/s(赵翠萍等, 2008), 通过最小二乘法拟合得到R1=60km, 几何扩散指数n1和n2分别为0.30和0.59, 各频率的S波品质因子结果见图3b。 以幂函数Q0fη 拟合品质因子得到Q=60.066f0.988, 低Q0高η 的特征与伽师地区强地震活动性有关。 与川滇地区的几何扩散和Q值(Xu et al., 2010)进行对比可知, 伽师地区的几何扩散明显更弱, 但低频段的非弹性衰减更强(Q值更小)。
 | 图 3 a 伽师地区不同频率S波谱路径衰减; b S波品质因子Fig. 3 S-wave spectral attenuation versus distance at each frequency(a)and S-wave quality factor(b) in Jiashi region. |
第2步谱反演需权衡震源和场地项, 而本文采用的台站中没有可直接作为参考场地的坚硬岩石场地台站。 根据台站场地钻孔资料及建筑抗震设计规范对场地类别划分的规定(中华人民共和国住房和城乡建设部, 2010), 有7个台站场地可划分为Ⅱ 类场地(065AKS、 065ALM、 065HLJ、 065AKT、 065BRM、 065ATS、 065SUF), 其余均为Ⅲ 类场地。 利用水平垂直谱比法(Nakamura, 1989)计算了记录不少于5组的3个Ⅱ 类场地台站(065AKS、 065ALM、 065HLJ)的场地反应, 本文将这3个Ⅱ 类场地台站用作参考场地。
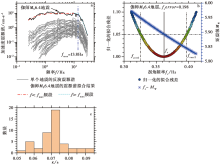
第2步反演得到的46次地震的加速度震源谱如图 4a所示, 当f< 10Hz时震源谱大体符合ω -2 理论震源谱模型(Brune, 1970), 但震源谱的快速衰减则普遍出现在f> fmax的高频段, f< 10Hz频段的反演震源谱可采用ω -2 理论震源模型ST表示, 即
 | 图 4 a 单个地震的反演震源谱及伽师MS6.4地震反演震源谱拟合结果; b 伽师MS6.4地震反演与理论震源谱拟合残差随拐角频率fc的变化及震源参数fc-MW的估计值, c κ 估计值Fig. 4 Inverted source spectra for individual earthquakes and the best-fitted theoretical spectra for the Jiashi MS6.4 earthquake(a), the normalized fitting residuals between the inverted and theoretical source spectra varying with corner frequency fc, and the fc-MW plots(b), and the estimated κ values(c). |
其中, M0、 fc分别为地震矩和拐角频率, RΘ Φ 、 V、 F分别表示平均辐射模式因子、 水平向S波占S波总能量的比例、 自由表面放大因子, 取值分别为0.55、 0.707、 2(Boore, 2003), ρ =2.61gcm-3为地壳介质密度(赵翠萍等, 2008)。 利用Abercrombie等(2017)提出的方法估计地震震源参数(M0、 fc)并判断估计结果的可靠性, 图4b给出了伽师MS6.4地震反演震源谱与理论震源谱的归一化拟合残差(拟合残差与拟合残差最小值之比)随拐角频率fc取值的变化以及得到的震源参数(MW、 fc), MW=(
本文选用的46次地震的应力降为1.126~16.455MPa, 其平均应力降为3.942MPa, 对数标准差(lg)为0.284, 其中伽师MS6.4地震的应力降为6.684MPa, 明显高于赵翠萍(2006)通过反演地震震源破裂过程给出的1998年2次伽师强震(MS6.0、 MS6.4)和2003年伽师-巴楚MS6.8地震的破裂面平均应力降(< 1MPa), 但更接近破裂面上最大滑动位错处的应力降(1.3MPa、 7.7MPa、 3.8MPa), 更小的平均应力降可能与设定的破裂面过大有关。
采用高频衰减项exp(-π fκ )表示震源谱在f> fmax的高频段的快速衰减, 其中κ 为高频衰减系数, 可将高频段震源谱表示为
拟合f> fmax高频段震源谱估算κ 及fmax, 所选用的地震震源谱的fmax为10~20Hz, κ 为0.053~0.094s, 其均值为0.071s(图 4c), 其中伽师MS6.4地震的fmax和κ 分别为13.8Hz和0.069s。
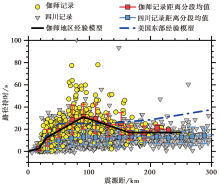
地震动持时由震源持时和路径持时2部分组成。 震源持时以地震拐角频率的倒数表示, 计算得到本文谱反演选用的46次地震的震源持时, 进一步计算了这46次地震中470组强震动记录的5%~95%显著持时(D5%~95%)。 为了确保地震动D5%~95%的部分主要为S波, 本文以2倍的20%~80%显著持时(D20%~80%)表示D5%~95%(Boore et al., 2015)。 伽师地区地震动路径持时如图 5 所示, 根据距离分段的路径持时均值, 本文给出了伽师地区地震动路径持时(dP)的经验模型:
 | 图 5 伽师地区强震动记录的路径持时及经验模型Fig. 5 Path duration of ground motion and its empirical model in Jiashi region. |
同时, 对比了利用2008年汶川地震的132次余震、 2013年MS7.0芦山地震的30次余震及2017年九寨沟MS7.0地震的强震动记录得到的四川地区地震动路径持时(图 5)。 伽师地区与四川地区地震动路径持时存在显著的差异, 伽师地区路径持时整体上高于四川地区, 且在30~150km震源距范围内尤为明显。 此外, 还注意到当震源距< 150km时伽师地区与美国东部的地震动路径持时较为接近(Boore et al., 2015)。
本文经谱反演给出了25个台站的场地反应(图 6), 谱反演选用的记录均为PGA≤ 100cm/s2的弱震记录, 可近似认为场地不出现非线性反应, 本文得到的场地反应均表示线性场地反应。 台站场地的30m土层等效剪切波速(VS30)为220~290m/s, 按VS30 将台站分为2组, 分别为220~250m/s和250~290m/s, 2组台站场地VS30 的平均值为233.77m/s和269.33m/s, 2组台站的平均场地反应及± 1倍标准差的范围如图 6 所示, VS30 较小的台站组的平均场地反应整体上强于较大组。 此外, 对比Seyhan等(2014)根据美国场地资料建立的场地线性反应经验模型(SS14模型)可知, 本文得到的伽师地区高频段场地反应与SS14线性模型差异明显, SS14线性模型显著地高估了伽师地区10~30Hz频段的场地反应。 针对伽师地区场地反应结果, 本文调整了SS14场地线性反应模型以适用于伽师地区, 经调整后的模型更有效地反映了伽师地区的场地反应(图 6)。
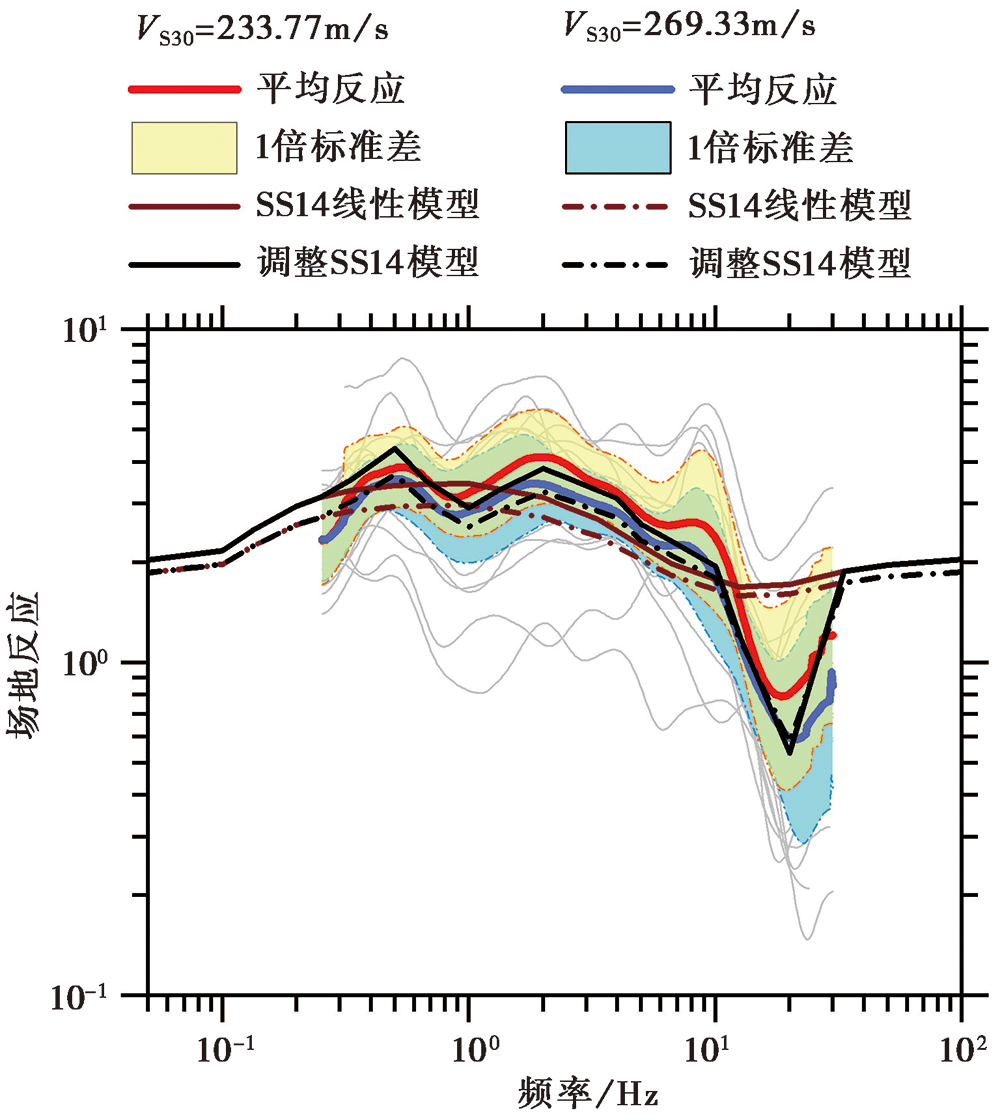 | 图 6 反演给出的台站场地反应及SS14场地线性反应调整模型Fig. 6 Inverted site responses and the modified SS14 linear site response model. |
据中国地震台网中心测定的伽师MS6.4地震震中位置为(39.83° N, 77.21° E), 震源深度为16km。 根据USGS提供的震源机制解可知, 此次地震为逆冲型地震, 震源破裂面的走向角和倾角分别为221° 和20° 。 根据Wells等(1994)建立的逆冲地震破裂面几何尺寸(长度L和宽度W)、 破裂面平均滑动位错(DAvg)与MW的经验关系, 将伽师MS6.4地震破裂面的L、 W、 DAvg分别设定为10km、 6km、 32.8cm, 将破裂面划分为1km× 1km的60个子断层。 地震起始破裂点在破裂面上的位置服从特定的概率分布(Mai et al., 2005), 走滑地震和地壳内倾滑地震的起始破裂点在破裂面上沿倾向和沿走向的位置分别服从韦布尔(Weibull)分布和正态分布, 沿倾向和沿走向的位置分别于0.6W和0.5L时出现概率最大, 本文设定伽师MS6.4地震的起始破裂点在破裂面上沿倾向和沿走向的位置分别为3.6km和5km, 此时破裂面上边缘的深度为14.77km。
本文采用Graves等(2010, 2015, 2016)提出的方法建立滑动位错不均匀、 破裂速度与滑动位错相关的震源运动学随机破裂模型, 该方法基于冯· 卡门相关函数的波数域滤波方法在波数域生成二维随机场, 然后将其转换至空间域, 并规定子断层滑动位错服从均值为DAvg、 标准差为0.8DAvg的正态分布, 最后得到滑动分布不均匀的震源运动学模型。 本文生成了200个伽师MS6.4地震的震源随机破裂模型, 其中4次破裂模型如图 7 所示, 震源随机破裂模型的明显差异说明生成的破裂模型具有很好的随机性, 可以较为充分地描述破裂过程的不确定性, 每个随机震源模型都有可能代表了伽师MS6.4地震的破裂过程, 后文将分别采用每个随机震源模型给出地震动模拟结果, 200个震源随机破裂模型的模拟结果可近似代表设定地震的地震动, 并能反映出与破裂过程相关的地震动的不确定性。
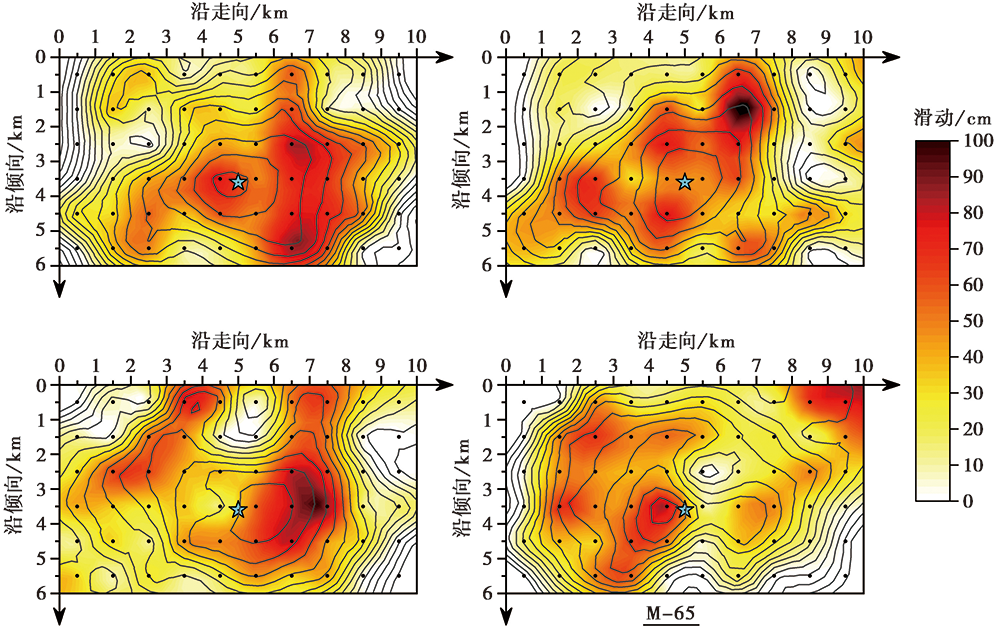 | 图 7 伽师MS6.4地震的震源随机破裂模型Fig. 7 Source rupture models stochastically generated for the Jiashi MS6.4 earthquake. |
地震震源破裂面可划分为N个可看做点源的子断层, 叠加各子断层产生的地震动ai得到整个破裂面产生的地震动, 即
地震破裂自起始破裂点开始并辐射至整个破裂面, Δ ti表示第i个子断层的地震动相对起始破裂点的延迟, 包括破裂延迟和传播延迟, 采用随机点源方法模拟子断层产生的地震动(Boore, 2003), 第i个子断层产生的地震动的S波傅氏谱以子断层震源谱(式(4)、 (6))、 路径衰减经验模型(式(3))及场地效应模型表示, 转换至时域得到ai, 采用Saragoni等(1973)给出的窗函数约束地震动加速度时程的波形。 本文利用随机有限断层方法模拟了伽师MS6.4地震中震源距≤ 200km的39个触发强震动台站(图 2)的水平向地震动加速度时程, 模拟输入参数见表1。
| 表1 随机有限断层模拟输入参数 Table 1 Input parameters in the stochastic finite-fault simulation |
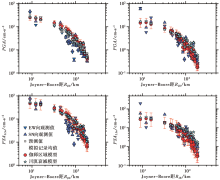
图 8 给出了200次震源随机破裂过程的水平向模拟记录的PGA、 峰值地面速度(PGV)以及部分周期(0.3s和3.0s)的5%阻尼比拟加速度反应谱(PSA)的平均值及1倍标准差范围。 模拟记录地震动强度指标整体上可以较好地代表观测值, 能体现出地震动的近场饱和效应及远场衰减规律; 1倍标准差范围体现了与破裂过程相关的地震动不确定性, 地震动的不确定性表现出周期相关性, 长周期地震动的不确定性更明显。 对比俞言祥等(2013)建立的新疆地震区基岩场地PGA预测方程的PGA预测值, 长轴方向与破裂面的走向一致(220° N)。 为了体现场地条件的影响, 根据中国地震动参数区划图(中华人民共和国国家质量监督检验检疫总局, 2015)中不同场地类别相对于Ⅱ 类场地的地震动峰值加速度调整系数, 得到考虑场地条件影响的PGA预测值, 模拟记录的PGA均值和PGA预测值也具有很好的一致性。 模拟记录的PSA均值与观测记录的PSA残差(log10(Yo)-log10(Ys))如图 9 所示, 短周期(< 0.3s)的PSA模拟值普遍高估了观测值, 但整体上可以很好地预测0.3~10s周期段的地震动。 考虑伽师地区地震动区域特征模型之后, 地震动的模拟结果与观测记录强度指标较好的一致性说明本文给出的伽师地区地震动区域特征较为可靠。
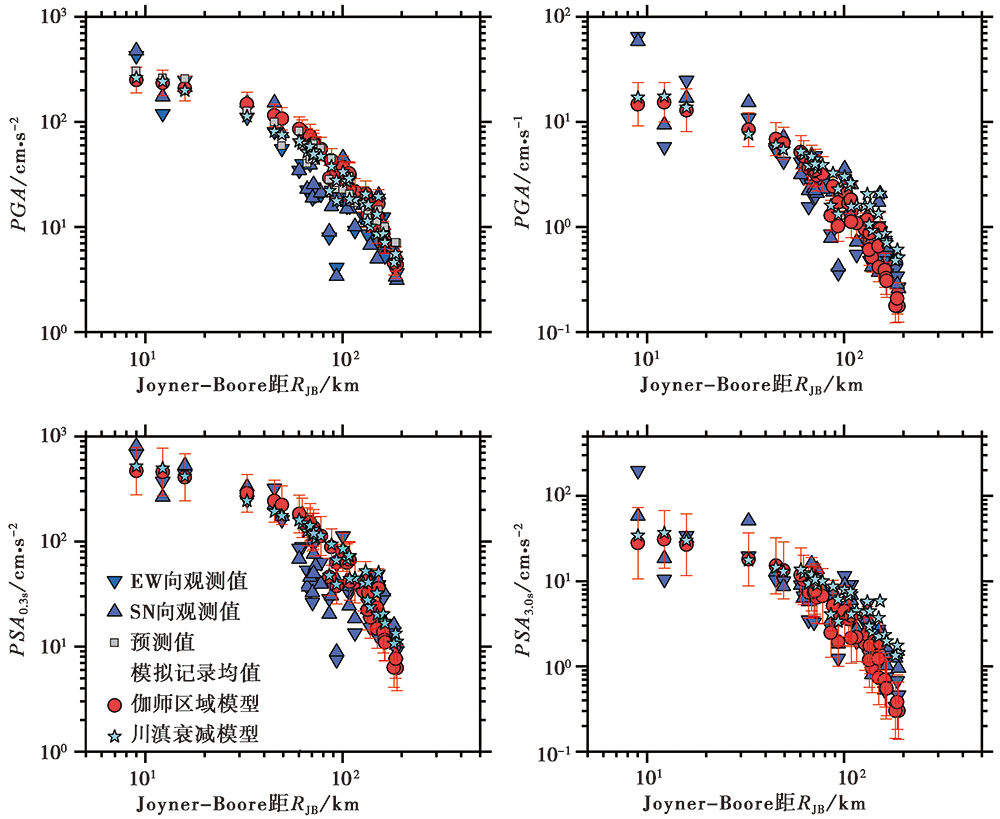 | 图 8 对比模拟与观测记录的PGA、 PGV、 周期为0.3s和3.0s的PSAFig. 8 Comparisons of PGA, PGV, and PSAs at 0.3s and 3.0s between observations and simulations. |
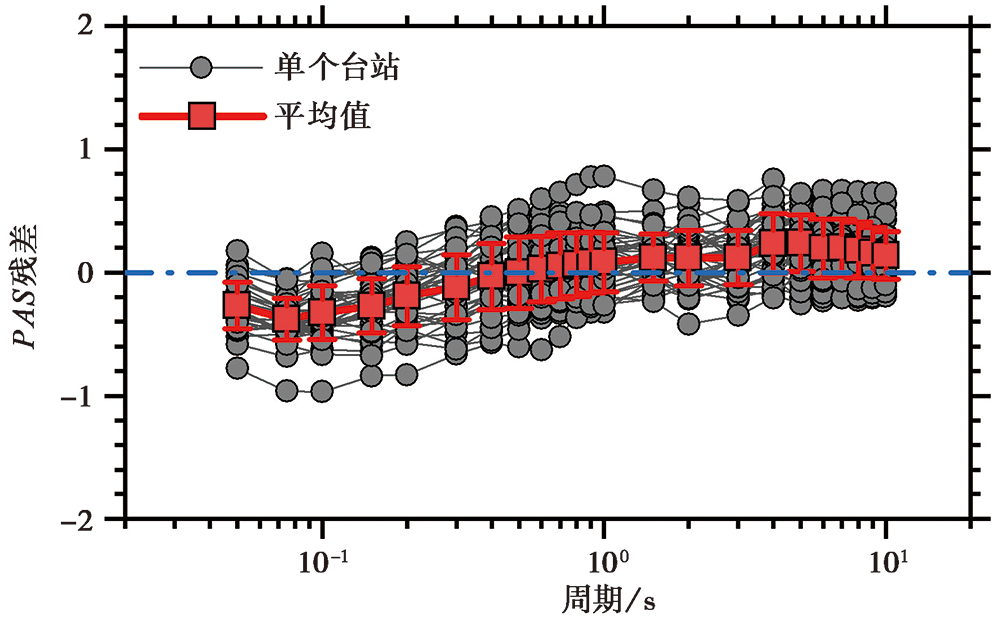 | 图 9 模拟记录的PSA残差Fig. 9 Residuals for the simulated PSAs at 42 strong-motion stations. |
为了说明区域特征对地震动模拟结果的影响, 本文也采用川滇地区的地震动衰减模型(Xu et al., 2010)代替伽师地区衰减模型给出了伽师MS6.4地震的地震动(图 8), 衰减模型对高频地震动(PGA、 周期为0.3s的PSA)模拟结果的影响不明显, 但对远场(> 60km)低频地震动(PGV、 周期为3.0s的PSA)影响显著, 川滇地区衰减模型不能有效地反映伽师地区低频地震动的远场快速衰减特征。
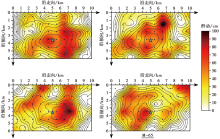
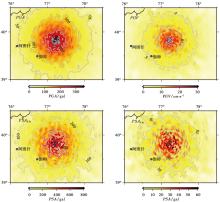
本文从200次震源随机破裂过程的模拟记录中选取了与观测记录PSA最接近的模拟记录所对应的一次随机破裂过程(M-65)(图 7)作为伽师MS6.4地震的震源破裂模型, 采用本文给出的伽师地区地震动区域特征模型, 模拟了M-65随机破裂模型的地震动场, 包含了以震中为中心200km范围内辐射状分布的3 636个虚拟观测点的水平向加速度时程, 虚拟观测点VS30 均设定为250m/s(相当于表2中Ⅲ 类场地VS30 的平均值)。 图 10 给出了伽师MS6.4地震模拟记录PGA、 PGV、 周期为0.3s和3.0s的PSA的空间分布情况, 近断层区域的PGA> 300cm/s2。 由于不考虑局部场地条件的影响, 远场地震动强度指标等值线近似为圆形, 近场区域受破裂过程的影响显著, 地震动强度等值线不规则。
 | 图 10 伽师MS6.4地震模拟记录PGA、 PGV、 周期为0.3s和3.0s的PSA的空间分布 蓝色矩形框为破裂面的水平投影Fig. 10 Spatial distributions for PGA, PGV, and PSA at 0.3s and 3.0s produced for the MS6.4 Jiashi earthquake. |
| 表2 震源距≤ 200km的39个触发台站的场地条件 Table 2 Site information for 39 stations that recorded the Jiashi MS6.4 earthquake |
本文利用伽师地区强震动观测记录, 基于非参数谱反演方法分离地震动的震源、 传播路径和场地影响, 建立了体现伽师地区地震动区域特征的路径衰减、 路径持时、 场地线性反应经验模型, 根据谱反演得到的地震震源谱估计了46次伽师地区中小地震的地震震源参数。 2020年伽师MS6.4地震的矩震级MW=5.893、 拐角频率fc=0.362Hz、 应力降Δ σ =6.684MPa, 利用伽师地区地震动区域模型基于随机有限断层方法模拟了2020年伽师MS6.4地震的地震动场, 取得的主要认识如下:
(1)强震动记录含有地震动的震源、 路径衰减及局部场地影响的重要信息, 非参数谱反演方法能够从地震动中分离出这些重要信息, 进而建立体现地震动区域特征的经验模型; 在地震动模拟中考虑地震动区域特征, 可以有效地提高模拟结果的可靠性。
(2)在强震动记录数不足以建立地震动预测模型的地区, 可以利用有限的强震动记录得到地震动区域性特征, 并给出模拟地震动, 结合少量观测记录与大量模拟记录建立地震动预测模型。
(3)伽师地区地震动的近场路径衰减较慢, 由于显著的非弹性衰减, 远场路径衰减较快, 伽师地区的路径衰减可近似地表示为双段线性几何扩散经验模型和非弹性衰减项的叠加, 几何扩散经验模型的转换距离R1=60km, 前、 后2段的几何扩散指数n1和n2分别为0.30和0.59, 品质因子Q=60.066f0.988; 伽师地区地震动的路径持时较长, 明显高于四川地区; 对比SS14场地的线性反应模型, 伽师地区局部场地对10~30Hz频段地震动的线性放大效应很弱, 其他频段的场地线性反应与SS14模型接近。
致谢 伽师MS6.4地震虚拟科考工作队在本研究基础数据获取方面给予了协调; 中国地震局工程力学研究所 “ 国家强震动台网中心” 和新疆维吾尔自治区地震局为本研究提供了强震动观测数据和强震动台站场地钻孔资料。 在此一并表示感谢!
| [1] |
|
| [2] |
|
| [3] |
|
| [4] |
|
| [5] |
|
| [6] |
|
| [7] |
|
| [8] |
|
| [9] |
|
| [10] |
|
| [11] |
|
| [12] |
|
| [13] |
|
| [14] |
|
| [15] |
|
| [16] |
|
| [17] |
|
| [18] |
|
| [19] |
|
| [20] |
|
| [21] |
|
| [22] |
|
| [23] |
|
| [24] |
|
| [25] |
|
| [26] |
|
| [27] |
|
| [28] |
|
| [29] |
|
| [30] |
|
| [31] |
|
| [32] |
|
| [33] |
|
| [34] |
|
| [35] |
|