
基于无人机航测获取高分辨率DEM数据的断层几何结构精细解译与分析——以海原断裂唐家坡为例
[孙稳 , 何宏林
, 何宏林* , 魏占玉, 高伟, 孙浩越, 邹俊杰]
, 何宏林, 魏占玉, 高伟, 孙浩越, 邹俊杰]
|
|


〔作者简介〕 孙稳, 男, 1992年生, 2015年于合肥工业大学获资源勘查工程专业学士学位, 现为中国地震局地质研究所构造地质学专业在读博士研究生, 主要从事活动构造与地貌学研究, 电话: 010-62009031, E-mail: sunw0219@ies.ac.cn。
与断层活动相关的构造地貌是多次强震活动与长期地表过程共同作用的结果, 其形态特征包含着丰富的强震活动信息。 但由于测量手段和数据精度的限制, 如何从形态复杂的构造地貌中准确识别这些信息一直是活动构造研究的难点。近年来, 结合运动重建模型(SfM, Structure from Motion)的小型无人机(sUAV, small Unmanned Aerial Vehicle)低空航测技术为研究者提供了一种低成本、 高灵活性、 快速获取高精度3D地形数据(DEM)和正射影像(DOM)的方法。 文中利用该方法获得了海原断裂唐家坡西田埂位错区域的高精度、 高分辨率DEM数据, 然后基于DEM数据进行了构造地貌解译和断层陡坎形貌分析。 通过地貌单元划分并对其与断层的切割关系进行解译, 识别出一系列走滑断裂的伴生构造, 并讨论走滑断层发育过程中的破裂类型及其样式。 基于对冲沟水平位错量、 断层陡坎垂直位错量的统计和断层陡坎坡度拐点的分析, 认为研究区地貌面形成以来经历了2次地表破裂型地震事件。 其中, 最新一次事件的水平和垂直位移量分别为(4.3±0.4)m和(0.95±0.14)m, 该位移量也代表了1920年海原地震的同震位移量; 较老一次事件的水平和垂直位移量分别为(4.3±0.95)m和(0.85±0.22)m。
Fault-related tectonic geomorphologic features are integrated expressions of multiple strong seismological events and long-term surface processes, including crucial information about strong earthquake behavior of a fault. It's of great significance to identify the strong seismic activity information from faulted landscapes, which include the date and sequence of the seismic activities, displacements, active fault features, for studying the seismic rupture process, predicting the future seismic recurrence behavior and evaluating the seismic hazard of the fault.
However, due to the restriction of measuring techniques and the subsequent poor quality of the acquired data, it has been difficult to accurately extract such information from complex tectonic landforms to study active faults for a long time. Recently, “small Unmanned Aerial Vehicle(sUAV)” photogrammetric technique based on “Structure from Motion(SfM)”provides a cost-efficient and convenient access to high-resolution and high-accuracy “digital elevation models(DEMs)”of tectonic landforms.
This paper selects the Tangjiapo area at the Haiyuan Fault to conduct data collection, in which the structural and geomorphic features are well preserved. Using a small quadrotor unmanned aerial vehicle(Inpire 2), we collect 1598 aerial photographs with a coverage area of 0.72km2. For calibrating the accuracy of the aerial data, we set 10 ground control points and use differential-GPS to obtain the spatial coordinates of these control points. We use model software Agisoft PhotoScan to process these digital pictures, obtaining high-resolution and high-accuracy DEM data with the geographic information, in which data resolution is 2.6cm/pix and the average density of point cloud is 89.3 point/m2. The data with these accuracy and resolution can fully show the real geomorphic features of the landform and meet the requirements for extracting specific structural geomorphic information on the surface.
Through the detailed interpretation of the tectonic landforms, we identify a series of structures associated with the strike-slip fault and divide the alluvial fan into four stages, named s1, s2, s3, and s4, respectively.
Wherein, the s1 is the latest phase of the alluvial fan, which is in the extension direction of the Haiyuan Fault and there isn't any surface fracture, indicating that the s1 was formed after the M8.5 Haiyuan earthquake in 1920. The rupture zone on the s2 fan is composed of varied kinds of faulting geomorphologic landforms, such as a series of en echelon tension-shear fractures trending 270°~285°, fault scarps and seismic ridges caused by the left-lateral motion of the seismic fault. In addition, a number of field ridges on the s2 fan were faulted by the 1920 Haiyuan M8.5 earthquake, recording the co-seismic displacements of the latest earthquake event. Relatively speaking, the surface rupture structure of the s3 fan is simple, mainly manifested as linear fault scarp with a trend of 270°~285°, which may indicate that multiple earthquakes have connected the different secondary fractures. And a small part of s4 fan is distributed in the southwest of the study area without fault crossing.
Furthermore, we measured the horizontal displacements of river channels and vertical offsets of fault scarps. The faulted ridge on the s2 fan and faulted gully on the s3 fan provide good linear markers for obtaining the fault left-lateral dislocation. We used the graphical dislocation measurement software LaDiCaoz developed based on Matlab to restore the gully position before the earthquake by comparing the gully morphology on both sides of the fault, and then determined the horizontal offset of s2, which is(4.3±0.4)m and that of s3 is(8.6±0.6)m. In addition, based on the DEM data, we extracted the fault scarp densely along the fault strike, and obtained the vertical offset of s2, which is(4.3±0.4)m and that of s3 is(1.79±0.16)m.
Moreover, we detect slope breaks in the fault scarp morphology. For compound fault scarps generated by multiple surface rupture earthquakes, there are multiple inflection points on the slope of the topographic section, and each inflection point represents a surface rupture event. Therefore, the slope break point on the scarp becomes an important symbol of multiple rupture of the fault. The statistical result shows that the slope breaks number of s2 is 1 and that of s3 is 2.
Based on the analysis of horizontal displacements of river channels and vertical offsets of fault scarps as well as its slope breaks, two surface rupturing events can be confirmed along the Tangjiapo area of the Haiyuan Fault. Among them, the horizontal and vertical displacements of the older event are(4.3±0.95)m and(0.85±0.22)m, respectively, while that of the latest event are(4.3±0.4)m and(0.95±0.14)m, which are the coseismic horizontal and vertical offsets of the 1920 Haiyuan earthquake.
These recognitions have improved our cognitive level of the fine structure of seismic surface rupture and ability to recognize paleoearthquake events. Therefore, the high-resolution topographic data obtained from the SfM photogrammetry method can be used for interpretation of fine structure and quantitative analysis of microgeomorphology. With the development of research on tectonic geomorphology and active tectonics toward refinement and quantification, this method will be of higher use value and practical significance.
大地震(M> 5.5)发生时震源断层可错动至地表, 形成类型丰富的断错地貌, 如线性陡坎、 断错水系和地表裂隙等(Hilley et al., 2008)。 这些断错地貌记录着断裂带数百a到数万a的活动历史, 对于预测下次地震最可能发生的地点具有至关重要的意义。 断错地貌分析的目的之一就是识别这些断错地貌中隐含的强震活动信息, 包括地震期次、 位移量和断层活动特征等, 结合年代学和震级经验公式, 可进一步估计发震时间、 复发周期以及震级等(邓起东等, 2008; 扈桂让等, 2017)。 这些信息对于研究地震的破裂过程、 预测断裂带未来地震的复发模式以及评价地震危险性具有重要意义。 因此, 调查和分析与强震活动相关的断错地貌是研究断层几何结构与活动性(Wallace, 1981)、 断层破裂过程(Parsons, 2007)、 地震复发周期(Sieh et al., 1984)以及地震危险性评估(Bull et al., 2006)等工作的重要方法。
尽管地质学者早已认识到与强震活动相关的构造地貌蕴含着丰富的强震活动信息, 但由于测量手段和数据精度的限制, 如何从类型丰富、 形态复杂的断错地貌中识别和获取强震信息一直是活动构造研究的重点和难点(邓起东等, 2004; 苏鹏等, 2015)。 近年来, 高精度测量技术, 特别是激光LiDAR及航空摄影测量技术的迅速发展, 使地质学者所获取的地形地貌数据达到前所未有的高时空分辨率和细微度。 其中, 新型航空摄影测量SfM(Structure from Motion)技术因其低成本、 高灵活性并且能快速获取高精度3D地形数据等优势, 已经成为一种广泛使用的获取高精度DEM数据的方法(Klinger et al., 2011)。 许多学者已经将该技术应用于多个地学研究领域中, 如冰川消融分析(Baltsavias et al., 2001)、 河流地貌分析(Bird et al., 2010)、 古地震分析(高伟等, 2017)和微构造地貌解译(Johnson et al., 2014)等。 前人基于沿海原断裂获取的LiDAR数据对该断裂的位错和强震破裂模式进行了综合分析, 获得了沿整条断裂带的水平位移量分布, 得到了关于断裂的古地震期次及其分段性破裂等新认识(Ren et al., 2015), 但是目前的研究中缺少基于高精度数据的关键点的精细地貌形态特征分析。 本文选取海原断裂构造地貌特征保存良好的唐家坡段, 利用小型无人机获取的高精度地形数据, 对其断错地貌特征进行精细解译, 通过对水平及垂直位错量、 坡度等形态变化特征的量化分析识别古地震事件及其同震位移。 研究展示了无人机获取的高精度数据对识别微构造地貌、 解析断层几何形态及识别地震事件期次等方面的应用价值。
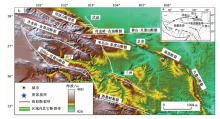
海原断裂是青藏高原东北缘的一条大型左旋走滑活动断裂, 其与冷龙岭-金强河断裂、 老虎山-毛毛山断裂、 海原断裂和六盘山断裂等一起构成了调节活动地块间相对运动的主要构造边界(Zhang et al., 1988a, b; Gaudemer et al., 1995)(图 1)。 1920年12月16日该断裂带发生了M8.5地震, 形成了长达237km的同震地表破裂带和5~10m的同震位移, 造成约22万人死亡, 是20世纪中国乃至全球最大的毁灭性地震之一(国家地震局地质研究所等, 1990)。
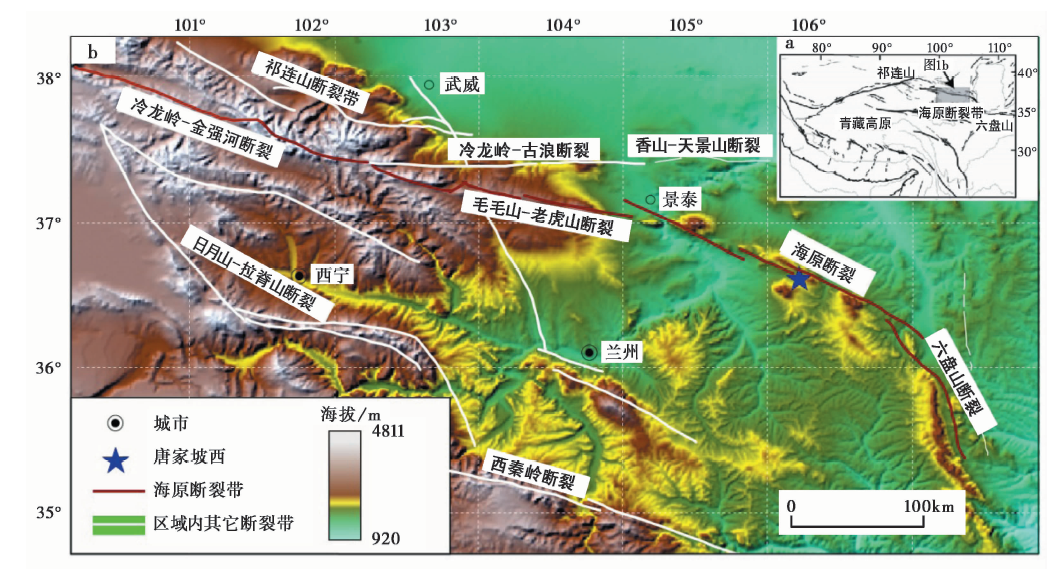 | 图 1 青藏高原东北缘主要断裂(据陈涛等, 2014) a 青藏高原构造简图, 灰色矩形指示图b的范围; b 青藏高原东北缘的主要断裂, 断层资料来自中国活动构造图, 蓝色五角星标示本文研究点的位置Fig. 1 Major faults in the northeastern margin of the Tibetan plateau(after CHEN Tao et al., 2014). |
海原断裂晚第四纪活动以强烈的左旋走滑为主要特征, 长期活动使得沿断裂发育了大量典型的走滑断错地貌, 如断层陡坎、 位错冲沟、 挤压鼓包等。 干旱— 半干旱的气候条件使这些因地震形成的构造微地貌保存得较为完整, 被断层错断的河流、 冲洪积扇等自然地貌和田埂等人工构筑物记录了大小不等的累积位移量。 这些典型的断错地貌使得该地区成为运用定量地貌学方法进行活动断裂研究的理想地区(刘静等, 2013; 陈涛等, 2014)。 前人基于LiDAR数据对整条断裂带的水平位错量进行过分析, 但是并没有对断裂经过的地貌类型及其在地表形成的破裂迹线进行精细分析。
我们选取了海原断裂唐家坡段的断错地貌作为研究对象, 该区域内不但发育并保存了丰富的断错地貌类型, 还有人工地貌标志物(如田埂等)。 本文借助SfM技术获取了该区域的高精度地形数据并开展断错地貌的精细解译, 以识别断错地貌中隐含的地震活动信息。
本文采用SfM技术获取研究区的高精度地形数据。 SfM技术基于“ 立体摄影测量(Stereoscopic photogrammetry)” 的基本原理, 从重叠二维图像序列中提取目标物体的数字三维模型, 其处理过程由基于静态图像构建3D模型的软件(如Agisoft Photoscan, Bundler Photogrammer Package)完成, 其过程包括图像特征匹配及跟踪、 基于图像特征解算相机的空间位置、 计算测量点的相对坐标和利用地面控制点(GCP)进行空间校正(魏占玉等, 2014, 2015; 杨海波等, 2016; 高帅坡等, 2017)。
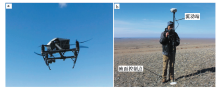
航拍影像数据利用小型四旋翼无人飞行器(品牌型号为大疆inspire 2)采集(图2a)。 该无人机专门为航空摄影所设计, 搭载有GPS测量系统和惯性导航系统, 可为航测数据提供m级定位精度, 同时搭载8.8mm固定焦距高清相机, 可获取2 000万级像素的影像。 航测数据的采集时间为2017年5月20日中午, 无云及良好的光照条件保证了照片的质量, 航测飞行高度为106m, 航拍影像的航向和旁向重叠率分别为85%和67%, 影像数据存储为JPG格式。 在上述参数的设置下, 共采集1 598张航拍照片, 覆盖长约1 800m、 宽约400m的研究区。 为校准航测数据精度, 我们在航测区域内布设了10个地面控制点, 并采用差分GPS获取这些控制点的空间坐标。
 | 图 2 地形数据及地面控制点采集工作照 a 大疆inspire 2无人机; b 利用RTK(Trimble R8)测量地面控制点Fig. 2 Working photos about the collection of topographic data and ground control points. |
采用模型软件Agisoft Photoscan处理航测数据, 以获取高密度地形点云数据, 处理流程参考前人的方法, 以保证处理结果的可靠性(王鹏涛等, 2016; 毕海芸等, 2017; 范熙伟等, 2017)。 处理结果显示, 不同航测架次之间存在至少50m的航向重叠, 无航拍空区存在; 影像重叠密度不低于6张, 表明航测过程中从不同角度观测地貌, 保证了地貌三维特征的准确性; 地形点云的平均密度为89.3个/m2, 正射影像的像素分辨率为2.6cm。 我们利用Surfer专业软件, 采用自然邻近插值的方法对点云数据进行插值生成网格数据DEM, 网格尺寸为0.1m。 此数据精度和分辨率完全可以表现出研究区地貌面的真实地貌特征, 满足在地貌面上提取特定构造地貌信息的要求。
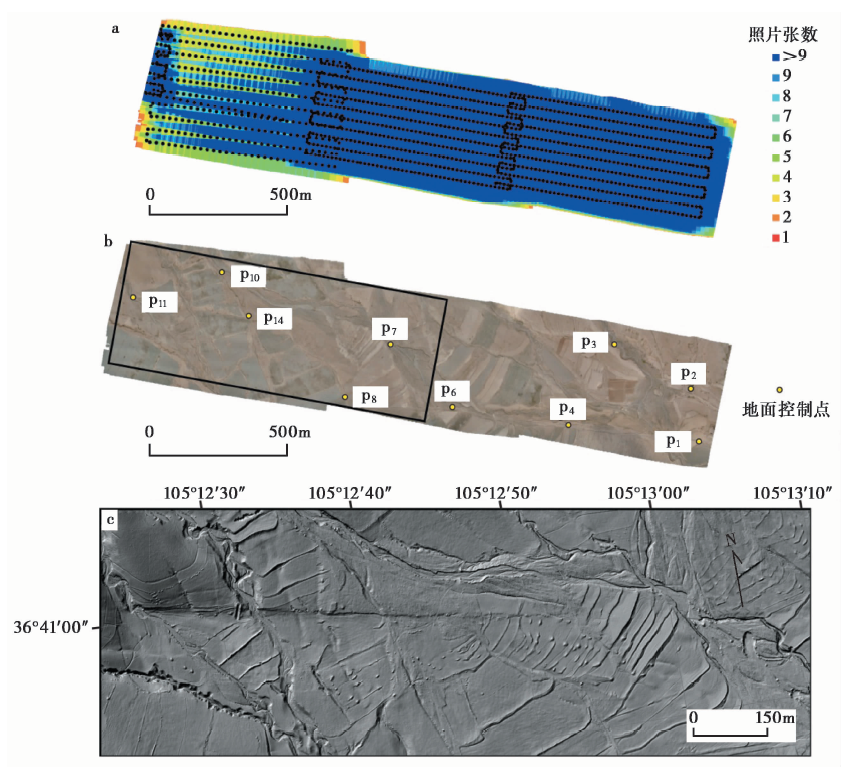 | 图 3 照片重叠度(a)、 正射影像及其地面控制点分布(b)、 研究区地形阴影图(c) a 不同颜色代表不同的航拍照片重叠密度, 黑点代表图像中心在地面的投影位置; b 黑色方框表示研究区图c的范围Fig. 3 Density map of photographs(a), digital orthophoto and distributions of ground control points(GCPs)(b), and hillshade map of the study area(c). |
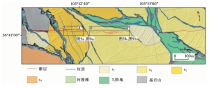
通过高分辨率DEM阴影图, 并结合野外实地考察, 我们对研究区主要的地貌单元、 地震地表破裂带的分布及断错地貌类型进行解译。 根据研究区的影像纹理结构(包括冲沟密度等)、 地形坡度、 扇体的规模形态及其相互之间的切盖关系, 发现研究区层状地貌面发育, 可将冲洪积扇划分为4个期次, 从新到老依次命名为s1、 s2、 s3和s4(图 4)。
 | 图 4 基于DEM数据的地貌分类解译 2个黑框分别指示图 5和图 9的位置Fig. 4 Interpretations of landforms based on the Digital Elevation Model(DEM). |
s1为最新一期洪积扇, 其主要分布在2个出水口附近, 该扇面处于断裂的延伸方向而地表无破裂迹线, 表明该期扇面是1920年海原M8.5地震之后形成的冲洪积扇; s4为区内最老一期洪积扇, 仅少部分分布于西南区域, 且无断裂穿过。
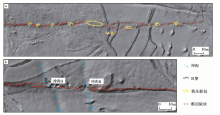
s2扇体上的破裂带由一系列走向270° ~285° 的雁列张剪裂隙或断层陡坎、 走向295° ~310° 的挤压鼓包等断错地貌组成, 形成了宽4~25m的地表左旋剪切破裂带(图5a)。 地震挤压鼓包出现在左旋右阶羽列和雁列次级破裂的挤压岩桥区, 单个鼓包呈长椭圆状, 长轴长数十cm, 最大可达十多m, 长宽比一般为2︰1— 6︰1不等。 大多数挤压鼓包与右阶雁列或羽列组合的次级张剪裂隙相间出现, 构成有规律的组合形式。 另外, s2扇面上有多条田埂被1920年海原M8.5地震错断, 记录了最新地震事件的同震位移量。
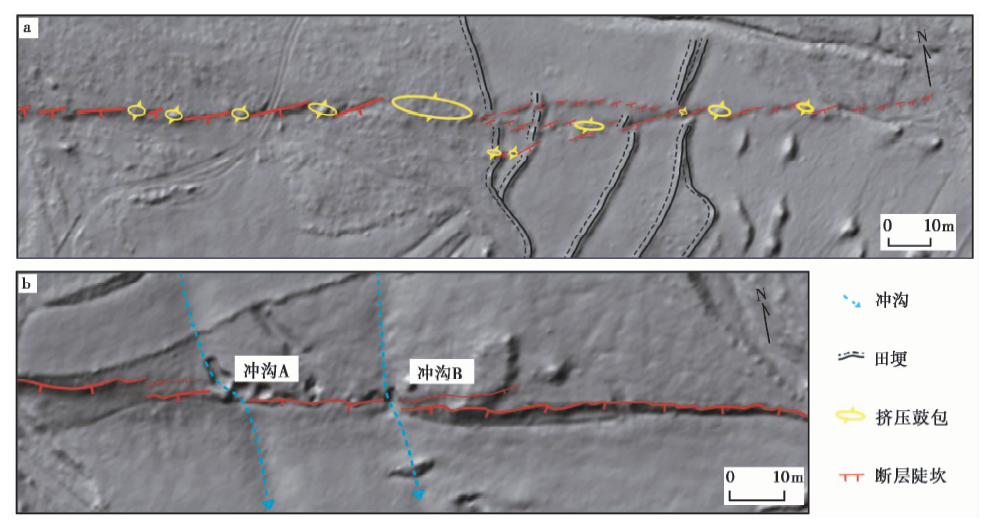 | 图 5 精细活动构造地貌解译Fig. 5 Detailed interpretations of tectonic landforms. |
与s2扇体上的地表破裂相比, s3扇体上的地表破裂结构相对简单(图5b), 主要表现为走向270° ~285° 的线性断层陡坎, 没有发现斜列的次级张剪裂隙和挤压鼓包, 这也许表明多次地震已将次级破裂连接贯通。 在地貌面上, 2条冲沟近垂直穿过地表破裂带, 并发生左旋位错(图5b)。
研究区内因地震活动形成的地表破裂迹线清晰, 分别断错s2、 s3扇体和基岩山区, 并形成了走向NWW、 倾向S的线性陡坎。
3.2.1 水平位错量
断裂发生水平活动时, 横穿断裂的线性标志物(如冲沟)将被左旋或右旋断错, 其位错距离即为断裂的水平位错量。 s2扇体上的断错田埂和s3扇体上的断错冲沟为获取断裂左旋位错量提供了良好的线性标志物。 利用基于Matlab开发的图形化位错测量软件LaDiCaoz, 通过比对断层两侧的冲沟形态以恢复震前的冲沟位置, 进而确定水平位错量, 该方法提高了水平位错的测量精度(Zielke et al., 2010, 2012)。
下面以图5b中的左旋冲沟A为例, 简要介绍该方法。 首先确定断层的位置和走向, 然后在断层两侧截取一小段冲沟来拟合冲沟迹线, 并在变形带外获取冲沟的上、 下游剖面。 软件会自动对所截剖面进行垂向和水平方向的平移和伸展, 使断层两侧的冲沟剖面相匹配。 两侧冲沟迹线重叠后, 水平移动的距离即所测地貌标志的水平位错量。 最后, 软件会给出位错恢复图及置信区间, 测量结果的质量根据置信区间来确定。 需要注意的是, 该方法的主要误差源于测量人员对断层位置及走向的判断, 因此, 为最大限度减少主观误差对测量结果的影响, 所有测量工作均在认真讨论确定断层位置和走向的基础上由同一人完成。
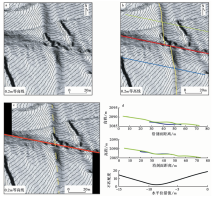
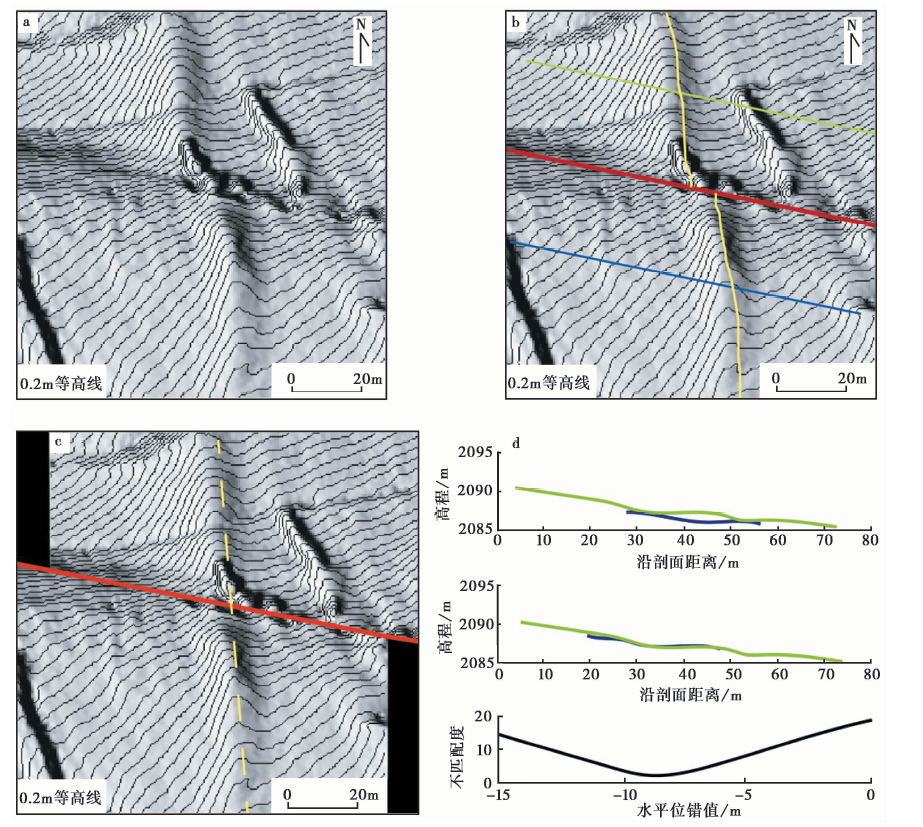 | 图 6 基于DEM数据测量冲沟的水平位错量(以图5b中的冲沟A为例) a 等高线间隔为0.2m的地形阴影图; b 确定断层的位置和走向, 冲沟上、 下游的趋势线及剖面的位置; c 位错恢复图, 8.6m 的位错恢复使得冲沟上、 下游重现为线性沟渠; d 地形剖面的重建: 水平位错的置信区间为8.2~9.6m, 最优值为8.6mFig. 6 Measurement of horizontal offset of river channel based on DEM(in the case of the channel A in Fig.5b). |
利用该方法分别对s2扇面上的位错田埂和s3扇面上的位错冲沟A进行水平位错测量。 测量结果显示, 田埂的位错量为(4.3± 0.4)m, 冲沟A的位错量为(8.6± 0.6)m, 这与Ren等(2015)在该点得到的位错结果相一致。 因研究区在历史文献记录中只经历过1次地表破裂型地震, 即1920年海原M8.5地震, 我们认为田埂的(4.3± 0.4)m位错量代表了1920年海原地震的同震水平位移。 而s3扇面上冲沟的(8.6± 0.6)m位错, 因其所在地貌面s3的年龄更老, 分析认为其代表了地貌面s3上冲沟A形成以来的累积水平位移量。
3.2.2 垂直位错量
洪积扇s2和s3上的线性标志物被左旋水平错断, 同时在扇体上形成了坡向S、 SE或SW的断层陡坎, 说明研究区内的断层活动除了左旋走滑运动外, 还存在倾滑运动。 基于获得的高精度DEM数据, 我们沿断层走向提取密集的断层陡坎剖面, 通过量取陡坎高度获得断裂带的垂直位错量。
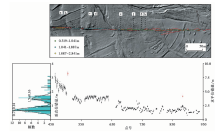
首先在DEM阴影图上确定局部断层陡坎走向, 然后垂直陡坎走向确定陡坎剖面的位置。 断层陡坎剖面应足够长, 以便获取陡坎两侧的原始地貌面。 采用最小二乘法分别对坎上和坎下的地形剖面数据进行线性拟合来确定原始地貌面, 2条拟合线之间的高差即是该点的垂直位错量。 需要注意的是, 拟合过程中要借助正射影像手动识别出未被改造的地貌面地形数据, 排除植被覆盖和侵蚀冲沟部分的数据; 另外, 垂直位错测量点需保证坎上和坎下地貌面为同一地貌单元。 沿断层走向平均每隔2m提取断层陡坎剖面量取垂直位错量, 共获得195个垂直位错量值。 测量结果显示位移值分布在0.34~3.0m, 具有自西向东递减的趋势。 扇面s2上有119个点, 位错值集中分布在0.6~0.8m, s3上有76个点, 位错值集中分布在1.4~1.6m(图 7)。
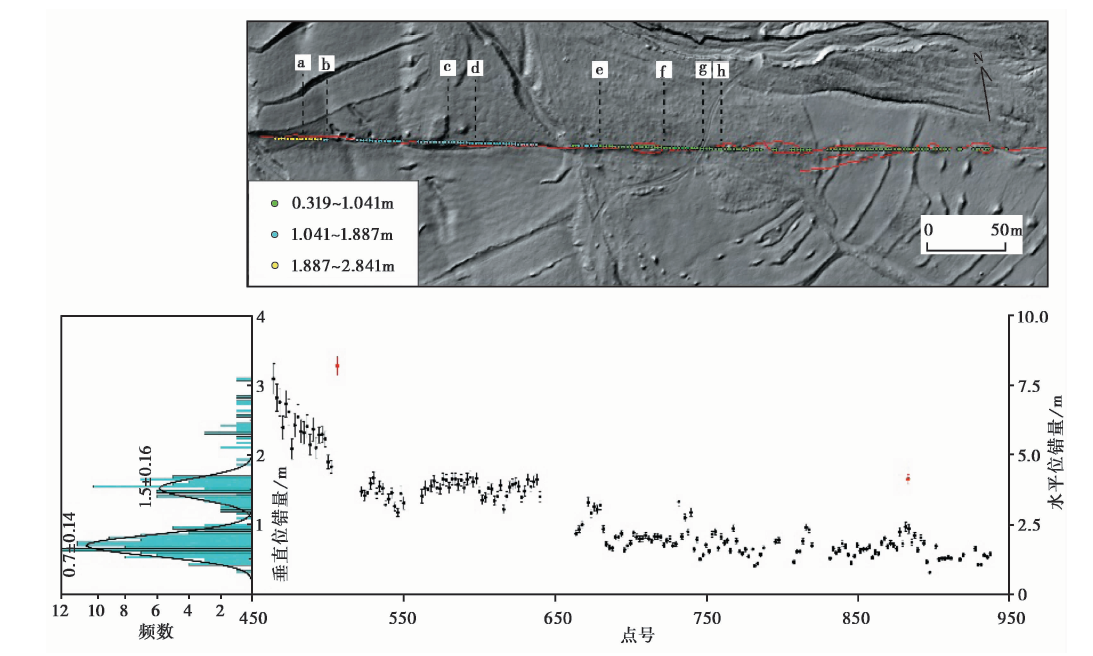 | 图 7 位错分布及频数直方图Fig. 7 Distribution of the horizontal and vertical offsets and their frequency histogram. |
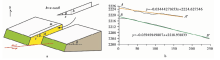
断层陡坎高度是断层垂直位移与地形效应共同作用的结果。 在倾斜的地貌面上, 断层的水平位移会产生虚假的垂直断错地貌(如眉脊效应产生的陡坎), 可称之为视位错。 研究区的断层陡坎位于山前倾斜的冲洪积扇体上, 鉴于该断层活动具有显著的水平位错量, 故有必要分析地形效应产生的垂向断错距离, 进而获取真实的垂直位错量。 地形效应产生的垂向视位错量与水平走滑量和地貌面沿断层走向的坡度有关(图 8)。 在扇面s2和s3上分别沿断层走向画1条平行断层的直线(位置见图 4), 代表2期扇体上断层经过位置的地形起伏, 再分别用直线拟合2条剖面线, 得到扇面s2的坡度为3.4° , 扇面s3的坡度约1.9° 。 另外, 取扇面s2的水平位错量为(4.3± 0.4)m、 扇面s3的水平位错量为(8.6± 0.6)m, 由斜率与水平位错量的乘积分别得到2期扇面上的视位错: s2的垂向视位错为(0.25± 0.01)m, s3的垂向视位错为(0.29± 0.02)m。 结合陡坎高度统计值, 确定扇面s2的垂直位错量为(0.95± 0.14)m, 扇面s3的垂直位错量为(1.79± 0.16)m。
 | 图 8 误差分析示意图Fig. 8 Diagrammatic plot of error analysis. |
地震地表破裂的平面几何展布、 构造变形组合直接反映了这一破裂带的各种特征, 是认识其破裂机制的一个重要依据(Deng et al., 1986)。 高精度三维地形地貌数据的应用, 能够帮助我们从断裂带精细结构的角度理解构造地貌演化与强震活动、 地表过程的相关性及地貌形态特征的指示意义。 海原断裂所在地区为干旱— 半干旱气候, 风化剥蚀速度慢, 而最新一次破裂事件发生于1920年, 因此为我们保留了教科书式的地震地表断错地貌样式, 如断层陡坎、 挤压鼓包等。
海原断裂唐家坡附近发育的走滑断错地貌类型主要有2种: 一种是由断层水平运动将地貌错移形成的各种断错地貌, 如冲(洪)积扇、 跨断层的冲沟及人工构筑物等发生系统性位错的地貌; 另一种是因断层两侧活动块体水平运动产生的局部挤压或拉张而形成的派生构造地貌, 研究区内此类伴生构造样式丰富。
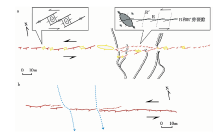
首先, 扇面s2上断层迹线是由一系列不连续的次级张剪断层组成, 呈雁列式分布。 这些次级断层与走滑断层的运动方向一致, 与剪切方向的夹角一般为12° ~16° , 应为R剪裂隙, 即低角度里德尔裂隙(图9a)。 走滑断层一般出现2组共轭的剪切破裂R和R', 即与剪切方向相反的高角度里德尔裂隙。 研究区没有发育R'剪切, 这可能与松散层的含水量较高有关(Yeats et al., 1997)。 同时, 次级张剪断层首尾之间的岩桥区发育一系列挤压鼓包, 挤压鼓包的长轴方向为NEE, 与左行右阶次级断层阶区处的挤压应力状态一致(图9a)。 另外, 扇面s3上的断层迹线相对平直, 无R剪裂隙和挤压鼓包发育(图9b), 可能是扇面s3地貌年龄更老、 经历事件较多、 阶区被贯通的结果, 与室内黏土试验的结果一致(Tschalenko, 1970)。 s2上的断错微地貌反映了走滑断层发育初期的破裂类型及样式, 而s3上的断错微地貌则反映了断层多期演化的结果。
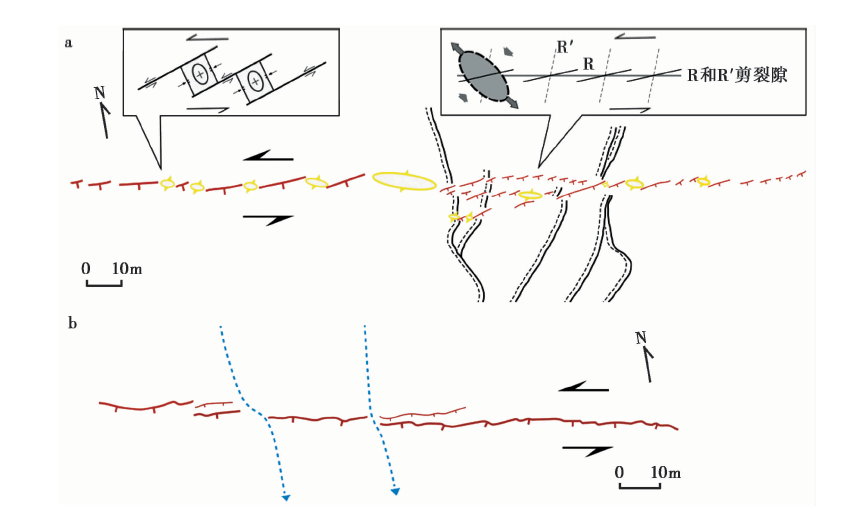 | 图 9 断层几何结构特征及成因机制Fig. 9 Geometry and mechanism of the fault surface trace. |
自20世纪90年代以来, 研究者开始利用位移丛集分布来识别古地震事件及其同震位移(McGill et al., 1991; Grant et al., 1994)。 近年来, 随着大范围高精度地形地貌数据的应用, 研究者可以基于上百个位移数据识别古地震事件、 讨论强震复发模型和破裂过程。 中国学者已开展利用高精度位移分布数据重建海原断裂带大地震破裂过程的研究, 改变了以往对该断裂地震复发模型的认识(Ren et al., 2015)。 由此可见, 基于高精度地形地貌数据的位移分布分析已成为研究古地震的重要手段。
我们采用同样的方法, 基于高精度地形数据获取沿断裂走向的垂直位移分布特征, 进而识别古地震事件及其同震位移(图 7)。 结果显示, 垂直位移分布存在显著的丛集特征和分段性。 第一组位移主要分布在0.6~0.8m, 峰值位于0.7m, 主要分布在s2上; 第二组位移主要分布在1.4~1.6m, 峰值位于1.5m, 主要分布在s3上。 同时, 经分析还发现不同地貌面上的水平位错也具有倍数关系: 扇体s2上位错田埂的水平位错为(4.3± 0.4)m, 扇体s3上的冲沟水平位错为(8.6± 0.6)m。 因此, 我们推测扇体s2上的位错反映了1920年海原大地震的同震位移, 扇体s3的位错为该断裂上2次事件的累积位移。
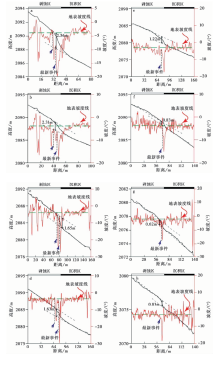
除断错陡坎高度的丛集性与分段性外, 断层陡坎的地形坡度变化也是研究断层活动历史、 识别古地震的重要形貌特征之一(Avouac et al., 1993; McCalpin, 1996; Arrowsmith et al., 1998)。 对于由多次地表破裂型地震产生的复合断层陡坎, 其地形剖面坡度上存在多个拐点, 每1个拐点代表1次地表破裂型事件, 因此断层坎上的坡折点就成为断层多次破裂的重要标志。 最近的一些研究就利用陡坎的坡折点成功地识别出数ka以来的多期古地震事件(Carretier, 2002)。 分析对比横跨断层陡坎的地形剖面, 发现位于扇面s2上的剖面通常只有1个拐点; 而扇面s3上的剖面则通常存在2个拐点(图 10 中的黑色曲线)。 对这些跨断层陡坎的地形剖面取一阶导数, 获得断层陡坎的坡度分布(图 10 中的红色曲线)。 位于扇面s3上横跨断层陡坎的地形剖面坡度分布显示, 在断层陡坎的位置上出现了2次突变(图10a— d); 而扇面s2上跨断层陡坎的地形剖面坡度分布在断层附近仅出现1次突变。 这种坡度分布的突变, 也指示了s2经历了1次地震事件, 而s3自形成以来则经历了2次地震事件。
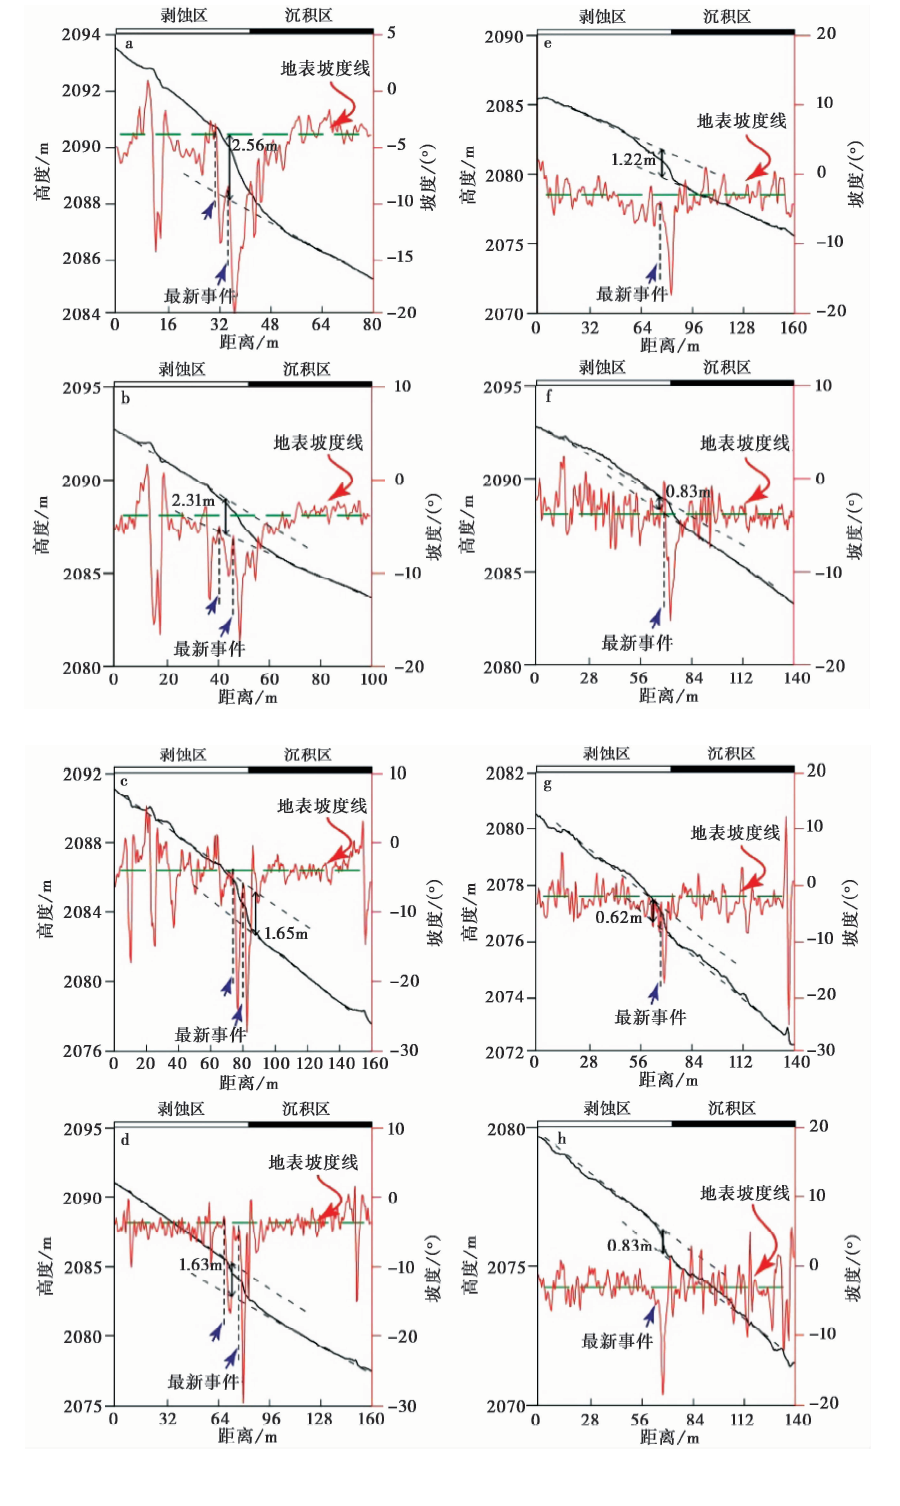 | 图 10 垂直走向的断层陡坎地形剖面(黑色)及坡度(红色) a— d P480、 P498、 P578及P596点的地形剖面与坡度图, 位于扇面s3; e— h P680、 P720、 P746及P760点的地形剖面与坡度图, 位于扇面s2。 黑色实线代表地形剖面, 红色实线代表坡度, 黑色虚线为地貌面拟合线。 各点位置分布见图 9Fig. 10 Topographic profiles(black line)of fault scarps and their slope(red line). |
综合2期地貌面上断层的破裂类型及样式、 位错量的倍数关系及断层陡坎的坡度拐点分析, 我们得出以下认识: s2形成以来只经历了1次地表破裂型地震, 即1920年M8.5地震, s2上断错地貌记录的位错量代表最新地震事件的同震位移, 其中水平位错量为(4.3± 0.4)m, 垂直位错量为(0.95± 0.14)m; s3形成以来经历2次地表破裂型地震事件, 其位错量代表2次事件的累积结果; 剔除1920年海原地震的同震位移量, 前一次事件的水平和垂直位错量分别为(4.3± 0.95)m和(0.85± 0.22)m。
本文基于小型无人机获取的唐家坡西高精度DEM数据, 解译出不同期次的地貌单元及一系列张剪断层、 挤压鼓包等构成的走滑断裂的伴生构造。 这些丰富的破裂样式反映了断裂带的演化历史和形成机制。 通过对冲沟水平位错、 断层陡坎垂直位错分布和断层陡坎坡度拐点的分析, 我们发现: 1)扇面s2形成以来经历了1次地表破裂型地震事件, 即1920年海原8.5级地震, 该扇面上的(4.3± 0.4)m的水平位错和(0.95± 0.14)m的垂直位错分别代表了1920年海原地震的水平和垂直同震位移; 2)扇面s3形成以来经历了2次地表破裂型地震事件, 其水平和垂直位错量是2次事件的累积结果, 剔除1920年海原地震的同震位移量, 前一次事件的水平和垂直位错量分别为(4.3± 0.95)m和(0.85± 0.22)m。
本文获得的认识提高了对地震地表破裂精细结构的认知水平和古地震的识别能力。 因此, 由低空无人摄影测量技术得到的高分辨率地形数据可以用于微地貌的精细解译及定量分析。随着构造地貌、 活动构造研究向着精细化、 定量化的方向发展, 该方法将有更大的使用价值和实用意义。
| [1] |
|
| [2] |
|
| [3] |
|
| [4] |
|
| [5] |
|
| [6] |
|
| [7] |
|
| [8] |
|
| [9] |
|
| [10] |
|
| [11] |
|
| [12] |
|
| [13] |
|
| [14] |
|
| [15] |
|
| [16] |
|
| [17] |
|
| [18] |
|
| [19] |
|
| [20] |
|
| [21] |
|
| [22] |
|
| [23] |
|
| [24] |
|
| [25] |
|
| [26] |
|
| [27] |
|
| [28] |
|
| [29] |
|
| [30] |
|
| [31] |
|
| [32] |
|
| [33] |
|
| [34] |
|
| [35] |
|
| [36] |
|
| [37] |
|
| [38] |
|
| [39] |
|