
SEISMOLOGY AND GEOLOGY ›› 2025, Vol. 47 ›› Issue (2): 597-609.DOI: 10.3969/j.issn.0253-4967.2025.02.20240152
Previous Articles Next Articles
COSEISMIC SLIP AND COULOMB STRESS OF THE 2024 MW7.1 HYUGANADA EARTHQUAKE
YANG Si-yuan1,2)( ), HU Yan1,2),*()
- 1) Institute of Deep Space Sciences, Deep Space Exploration Laboratory, Hefei 230088, China
2) School of Earth and Space Sciences, University of Science and Technology of China, Hefei 230026, China
-
Received:2024-12-01Revised:2025-02-10Online:2025-04-20Published:2025-06-07
2024年日向滩 MW7.1 地震的同震滑移分布及其库仑应力分布
杨思源1,2)(), 胡岩1,2),*()
- 1) 深空探测实验室深空科学研究院, 合肥 230088
2) 中国科学技术大学, 地球和空间科学学院, 合肥 230026
-
通讯作者:* 胡岩, 男, 1976年生, 研究员, 博士生导师, 现主要研究方向为地球和行星动力学数值模拟, E-mail: yanhu11@ustc.edu.cn。 -
作者简介:杨思源, 女, 1996年生, 现为中国科学技术大学地球物理学专业在读博士研究生, 主要研究方向为地球动力学数值模拟, E-mail: syyang@mail.ustc.edu.cn。
-
基金资助:深空探测实验室前沿科研计划项目(DSEL-QYKJ-YX-2023007); 中国科学院战略性先导科技专项(XDB42020104)
Cite this article
YANG Si-yuan, HU Yan. COSEISMIC SLIP AND COULOMB STRESS OF THE 2024 MW7.1 HYUGANADA EARTHQUAKE[J]. SEISMOLOGY AND GEOLOGY, 2025, 47(2): 597-609.
杨思源, 胡岩. 2024年日向滩 MW7.1 地震的同震滑移分布及其库仑应力分布[J]. 地震地质, 2025, 47(2): 597-609.
share this article
Add to citation manager EndNote|Ris|BibTeX
URL: https://www.dzdz.ac.cn/EN/10.3969/j.issn.0253-4967.2025.02.20240152
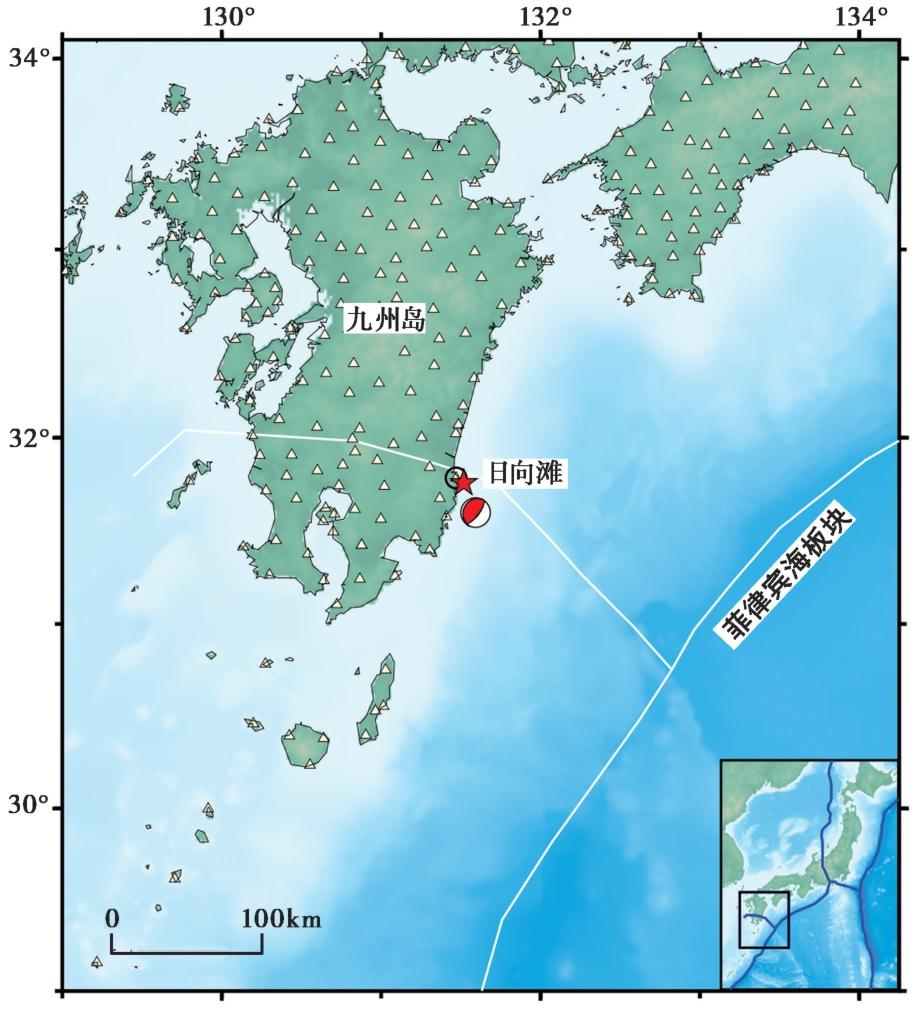
Fig. 1 Tectonic setting of the southwestern Japan.
| 发震日期 | 东经/(°) | 北纬/(°) | 深度/km | 震级/MW |
|---|---|---|---|---|
| 2024-08-08 | 131.5021 | 31.7599 | 24.000 | 7.1 |
| 2024-08-08 | 131.6976 | 31.7663 | 30.264 | 4.8 |
| 2024-08-08 | 131.5939 | 31.5649 | 40.157 | 4.6 |
| 2024-08-08 | 131.6549 | 31.4937 | 43.391 | 4.3 |
| 2024-08-08 | 131.526 | 31.8229 | 37.67 | 4.2 |
| 2024-08-08 | 131.6514 | 31.6003 | 41.015 | 4.4 |
| 2024-08-08 | 131.3023 | 31.8192 | 18.196 | 5.3 |
| 2024-08-08 | 131.5107 | 31.6973 | 27.573 | 4.3 |
| 2024-08-08 | 131.3995 | 31.7782 | 22.853 | 4.3 |
| 2024-08-09 | 131.6486 | 31.3675 | 33.123 | 4.3 |
| 2024-08-09 | 131.5502 | 31.3525 | 35.000 | 4.3 |
| 2024-08-10 | 131.5454 | 31.8606 | 47.204 | 4.9 |
| 2024-08-11 | 131.8052 | 31.4414 | 43.119 | 4.2 |
| 2024-08-15 | 131.5505 | 30.9900 | 38.098 | 4.5 |
| 2024-08-22 | 131.4084 | 31.1423 | 51.559 | 4.5 |
| 2024-08-31 | 131.7998 | 31.9125 | 44.209 | 4.9 |
Table1 Earthquakes in the study area from August 8, 2024 to August 31, 2024
| 发震日期 | 东经/(°) | 北纬/(°) | 深度/km | 震级/MW |
|---|---|---|---|---|
| 2024-08-08 | 131.5021 | 31.7599 | 24.000 | 7.1 |
| 2024-08-08 | 131.6976 | 31.7663 | 30.264 | 4.8 |
| 2024-08-08 | 131.5939 | 31.5649 | 40.157 | 4.6 |
| 2024-08-08 | 131.6549 | 31.4937 | 43.391 | 4.3 |
| 2024-08-08 | 131.526 | 31.8229 | 37.67 | 4.2 |
| 2024-08-08 | 131.6514 | 31.6003 | 41.015 | 4.4 |
| 2024-08-08 | 131.3023 | 31.8192 | 18.196 | 5.3 |
| 2024-08-08 | 131.5107 | 31.6973 | 27.573 | 4.3 |
| 2024-08-08 | 131.3995 | 31.7782 | 22.853 | 4.3 |
| 2024-08-09 | 131.6486 | 31.3675 | 33.123 | 4.3 |
| 2024-08-09 | 131.5502 | 31.3525 | 35.000 | 4.3 |
| 2024-08-10 | 131.5454 | 31.8606 | 47.204 | 4.9 |
| 2024-08-11 | 131.8052 | 31.4414 | 43.119 | 4.2 |
| 2024-08-15 | 131.5505 | 30.9900 | 38.098 | 4.5 |
| 2024-08-22 | 131.4084 | 31.1423 | 51.559 | 4.5 |
| 2024-08-31 | 131.7998 | 31.9125 | 44.209 | 4.9 |
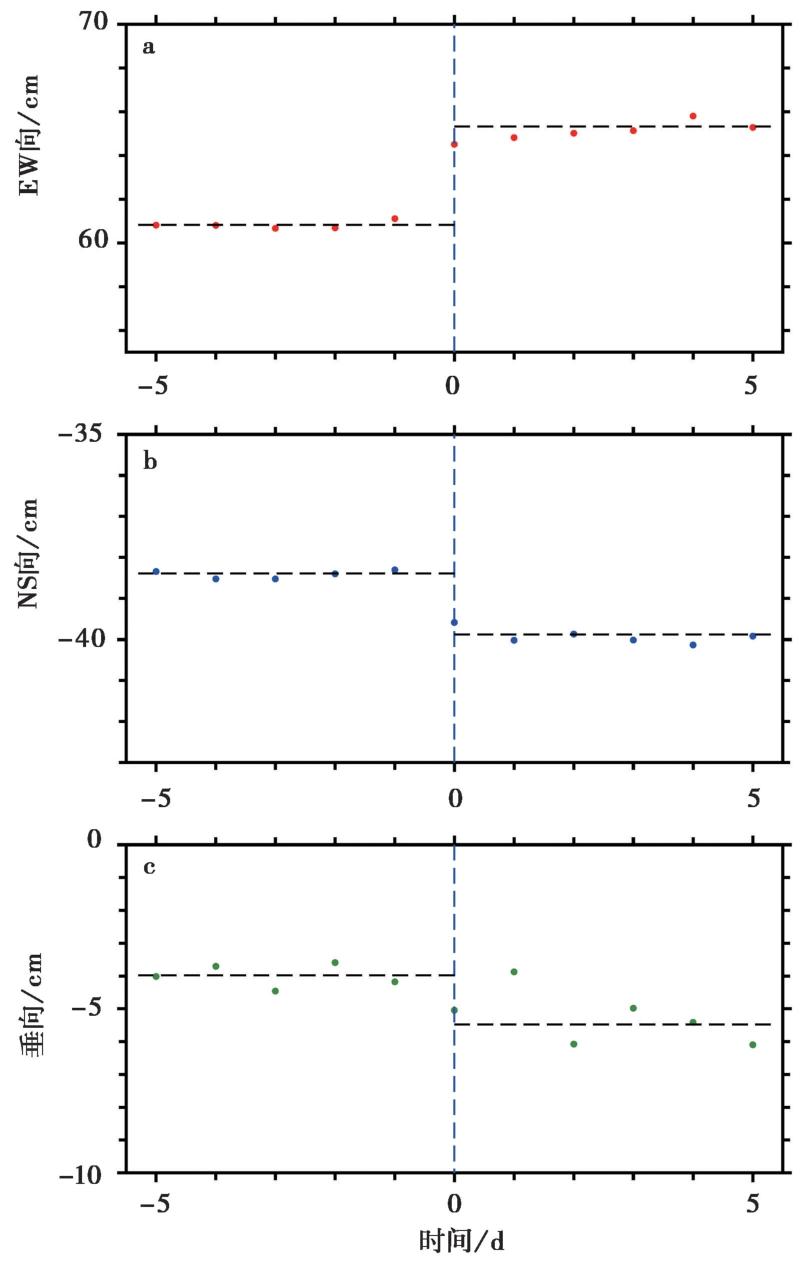
Fig. 2 The time series of the G211 station.

Fig. 3 Comparison of GNSS observations with model predictions.
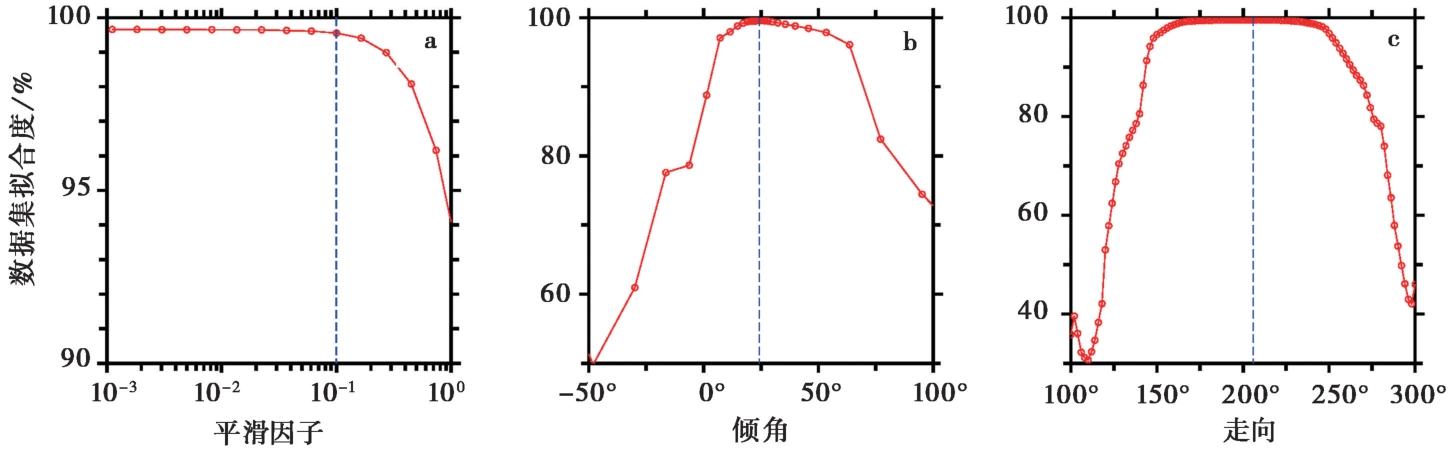
Fig. 4 Percentage of recovery of datasets versus different parameters for coseismic slip inversion.
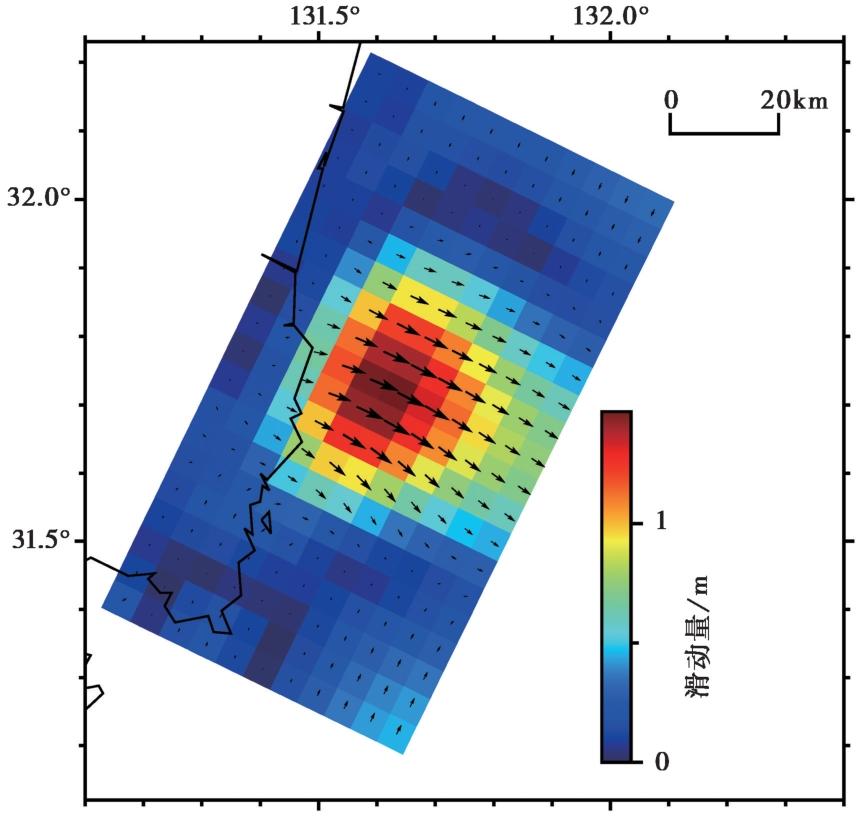
Fig. 5 Coseismic slip model.
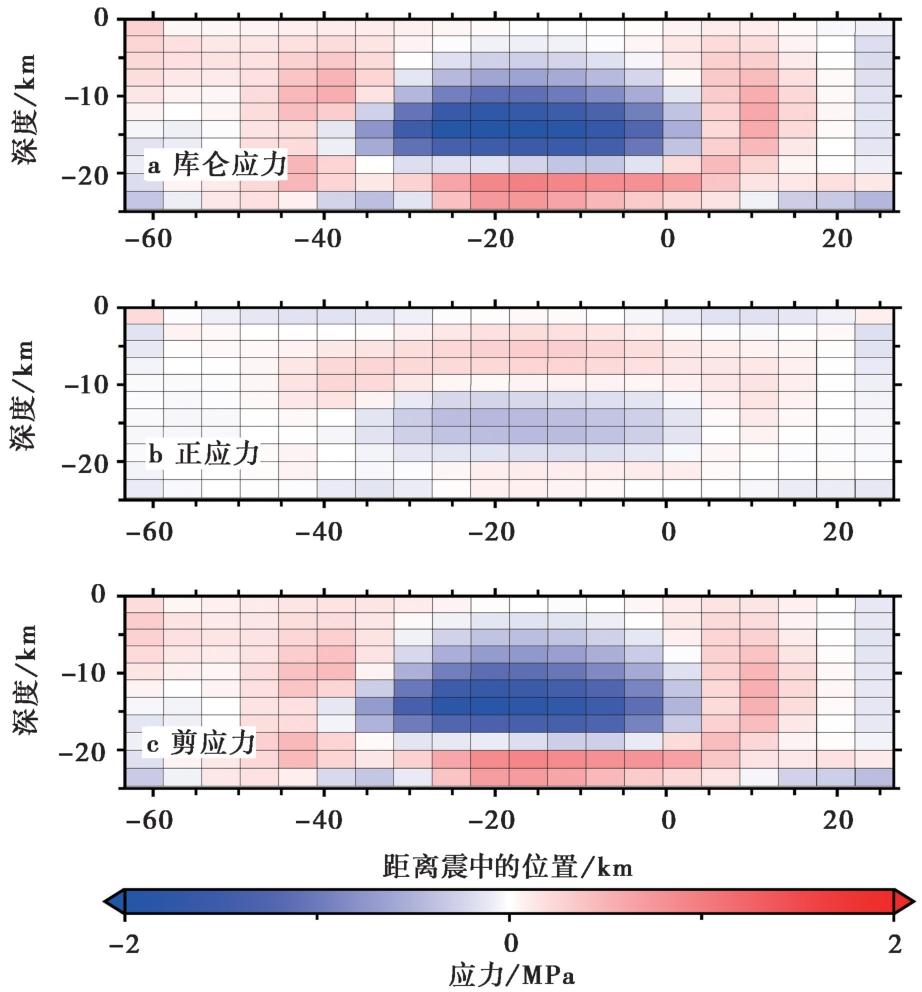
Fig. 6 Stress distribution over the ruptured fault.
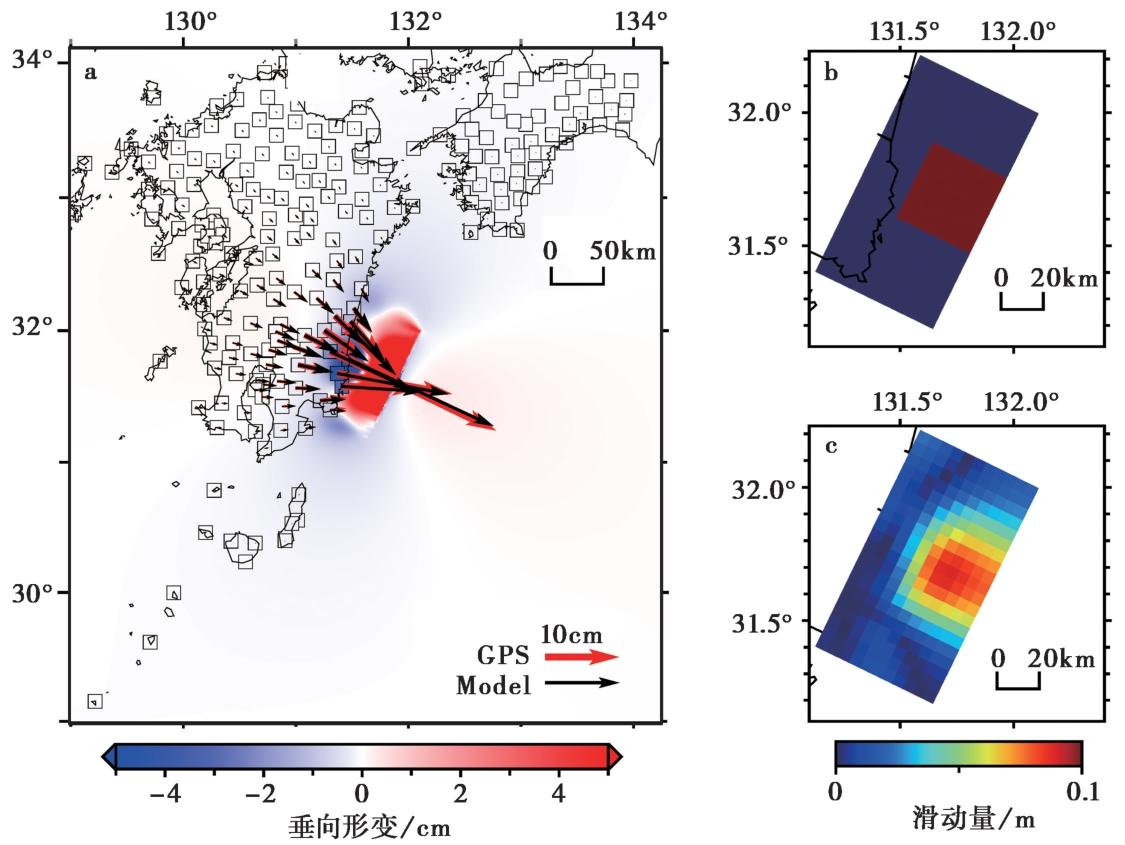
Fig. 7 Sensitivity test.
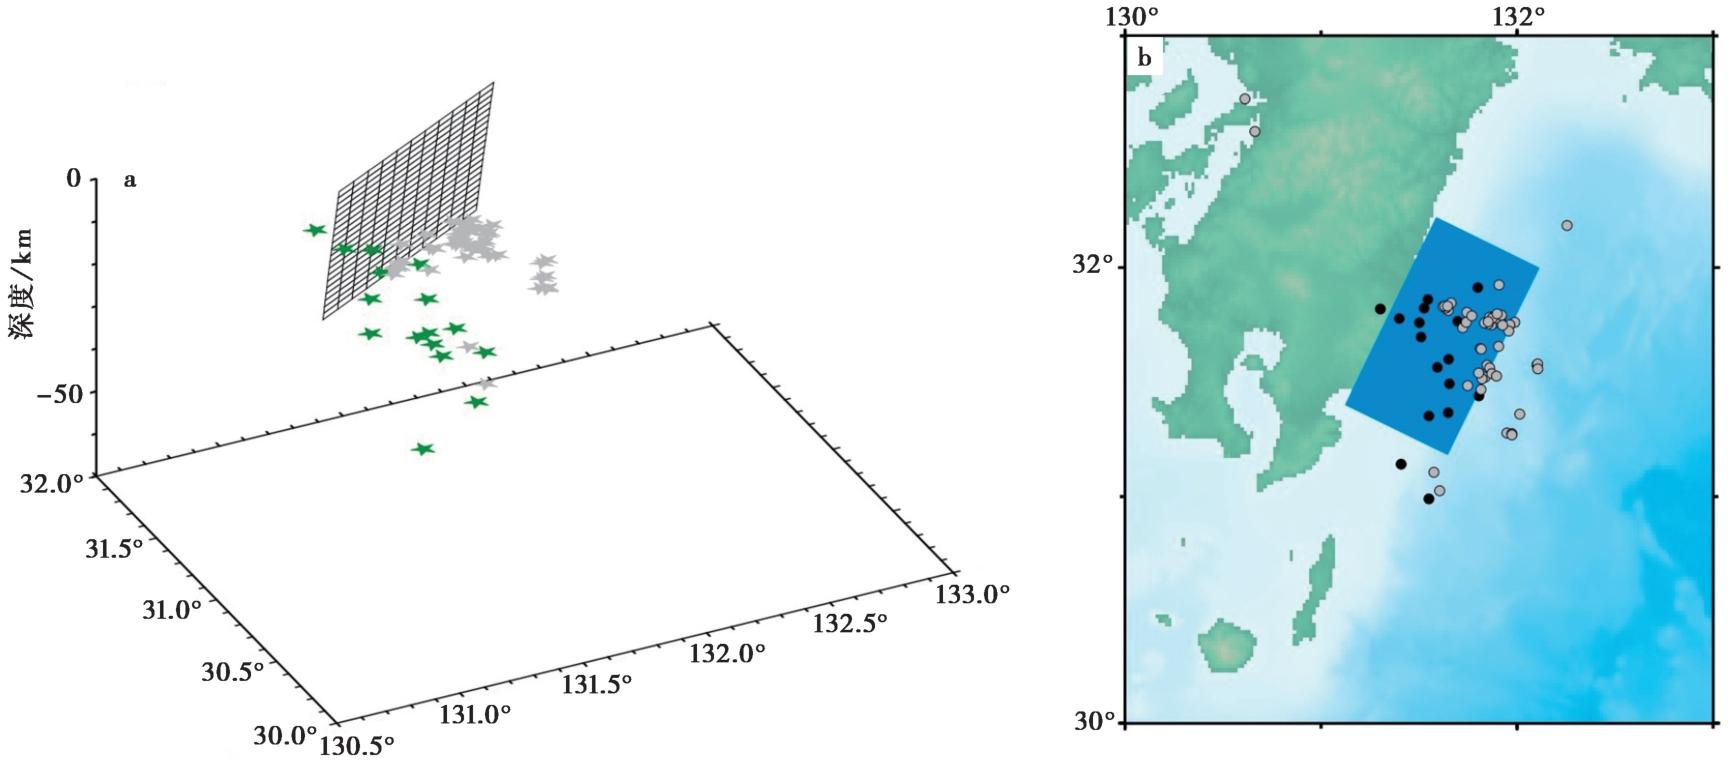
Fig. 8 Location of the ruptured fault and the aftershocks.
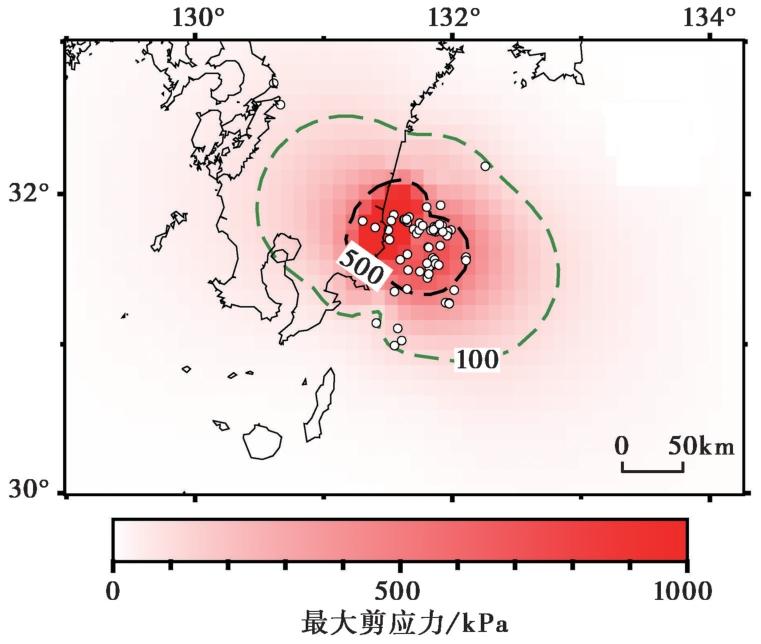
Fig. 9 Distribution of maximum shear stress.
| [1] |
单新建, 张国宏, 汪驰升, 等. 2015. 基于InSAR和GPS观测数据的尼泊尔地震发震断层特征参数联合反演研究[J]. 地球物理学报, 58(11): 4266-4276.
DOI |
|
|
|
| [2] |
邵志刚, 武艳强, 江在森, 等. 2011. 基于GPS观测分析日本9.0级地震同震位错与近场形变特征[J]. 地球物理学报, 54(9): 2243-2249.
|
|
|
|
| [3] |
王克林. 2021. 俯冲带大断层的强度问题[J]. 地球物理学报, 64(10): 3452-3465.
|
|
|
|
| [4] |
王敏. 2009. 基于GPS同震位移场约束反演2008年5·12汶川大地震破裂空间分布[J]. 地球物理学报, 52(10): 2519-2526.
|
|
|
|
| [5] |
张小红, 郭斐, 郭博峰, 等. 2012. 利用高频GPS进行地表同震位移监测及震相识别[J]. 地球物理学报, 55(6): 1912-1918.
|
|
|
|
| [6] |
|
| [7] |
|
| [8] |
|
| [9] |
|
| [10] |
|
| [11] |
|
| [12] |
|
| [13] |
|
| [14] |
|
| [15] |
|
| [16] |
|
| [1] | LI Yan, CHEN Jun-lei, LÜ Si-yu, WANG Yu-dong, FU Lei. THE STRESS FIELD INVERSION AND TRIGGER RELATIONSHIPS OF THE JINGGU EARTHQUAKE SEQUENCE [J]. SEISMOLOGY AND GEOLOGY, 2026, 48(2): 561-581. |
| [2] | LIU Lian, QU Chun-yan, WU Dong-lin, RONG Yi-lin, CHEN Han. THE RUPTURE PROCESS INVERSION OF SEPTEMBER 2022 ML6.6 AND ML6.83 EARTHQUAKES IN TAIWAN ISLAND, CHINA [J]. SEISMOLOGY AND GEOLOGY, 2026, 48(1): 217-232. |
| [3] | YANG Jian-wen, JIN Ming-pei, LI Qing, LI Zhen-ling, YE Beng, LI Jian, ZHANG Ying-feng. COSEISMIC DEFORMATION FIELD AND SLIP MODELS OF JANUARY 23, 2024 MS7.1 WUSHI EARTHQUAKE, XINJIANG, CHINA [J]. SEISMOLOGY AND GEOLOGY, 2025, 47(5): 1382-1395. |
| [4] | YANG Ying-hui, XIE Li-yuan, XU Qiang, WANG Yun-sheng, ZHAO Jing-jing, WANG Dao-ming, CHEN Qiang. RESEARCH OF THE INSAR COSEISMIC DEFORMATION AND INTERSEISMIC FAULTING MECHANISM OF THE 2023 JISHISHAN MW6.1 EARTHQUAKE [J]. SEISMOLOGY AND GEOLOGY, 2025, 47(5): 1416-1437. |
| [5] | YANG Jiu-yuan, WEN Yang-mao, XU Cai-jun, YANG Jian-bing. SEISMOGENIC STRUCTURE OF THE DINGRI MW5.7 EARTH-QUAKE OF MARCH 20, 2020 (SOUTHERN QINGHAI-XIZANG PLATEAU) CONSTRAINED BY THE COSEISMIC AND POSTSEISMIC DEFORMATION [J]. SEISMOLOGY AND GEOLOGY, 2025, 47(4): 1292-1305. |
| [6] | GUO Zhao-wu, LU Ren-qi, ZHANG Jin-yu, FANG Li-hua, LIU Guan-shen, WU Xi-yan, SUN Xiao, QI Shi-miao. THREE-DIMENSIONAL MODEL OF SEISMOGENIC FAULT AND SEISMIC ENVIRONMENT OF XIZANG DINGRI MS6.8 EARTHQUAKE OF JANUARY 7, 2025 [J]. SEISMOLOGY AND GEOLOGY, 2025, 47(3): 671-688. |
| [7] | CHEN Zi-long, LIU Gang, LI Qi, CHEN Wei, ZHAO Xin-yu, LIN Mu, TAO Long-wen, QIAO Xue-jun, NIE Zhao-sheng. INSAR COSEISMIC DEFORMATION AND SEISMOGENIC STRUCTURE OF THE 2024 MW7.0 WUSHI EARTHQUAKE [J]. SEISMOLOGY AND GEOLOGY, 2025, 47(2): 429-447. |
| [8] | ZHU Shuang, GUO Nan-nan, PANG Ya-jin. STUDY ON FAULT DEFORMATION CHARACTERISTICS AND SEISMIC HAZARD IN THE KEPING THRUST BELT [J]. SEISMOLOGY AND GEOLOGY, 2025, 47(2): 448-462. |
| [9] | XU Bin-bin, ZHANG Yi-peng, LU Le-jun, TIAN Qing-ying, YANG Xue, WANG Yang, ZHANG Pei-zhen. STUDY ON SEISMOGENIC TECTONICS OF THE 2025 MYANMAR MS7.9 EARTHQUAKE [J]. SEISMOLOGY AND GEOLOGY, 2025, 47(2): 649-670. |
| [10] | YANG Jian-wen, JIN Ming-pei, YE Beng, LI Zhen-ling, LI Qing. SOURCE RUPTURE MECHANISM AND STRESS CHANGES TO THE ADJACENT AREA OF JANUARY 7, 2025, MS6.8 DINGRI EARTHQUAKE, XIZANG, CHINA [J]. SEISMOLOGY AND GEOLOGY, 2025, 47(1): 36-48. |
| [11] | NIU Peng-fei, HAN Zhu-jun, GUO Peng, LIU Guan-shen, LUO Jia-hong, GUO Zhao-wu. THE COULOMB STRESS TRIGGERING EFFECT OF 2016 MW5.9 AND 2022 MW6.7 EARTHQUAKES IN MENYUAN, QINGHAI AND THEIR INFLUENCE ON THE SURROUNDING SEISMOGENIC FAULTS [J]. SEISMOLOGY AND GEOLOGY, 2025, 47(1): 325-344. |
| [12] | XU Jing, JI Ling-yun, LIU Chuan-jin. REGIONAL DEFORMATION BACKGROUND AND COSEISMIC DEFORMATION CHARACTERISTICS OF THE 2022 LUDING MS6.8 EARTHQUAKE [J]. SEISMOLOGY AND GEOLOGY, 2024, 46(3): 645-664. |
| [13] | ZHAO De-zheng, QU Chun-yan, ZHANG Gui-fang, GONG Wen-yu, SHAN Xin-jian, ZHU Chuan-hua, ZHANG Guo-hong, SONG Xiao-gang. APPLICATIONS AND ADVANCES FOR THE COSEISMIC DEFORMA-TION OBSERVATIONS, EARTHQUAKE EMERGENCY RESPONSE AND SEISMOGENIC STRUCTURE INVESTIGATION USING INSAR [J]. SEISMOLOGY AND GEOLOGY, 2023, 45(2): 570-592. |
| [14] | ZHU Zhi-guo, ZHU Yi-qing, WANG Dong-zhen, HUSAN Irxat. COMPREHENSIVE ANALYSIS OF GRAVITY AND CRUSTAL DEFORMATION OF JIASHI MS6.4 EARTHQUAKE IN 2020 [J]. SEISMOLOGY AND GEOLOGY, 2023, 45(1): 269-285. |
| [15] | YU Shu-yuan, HUANG Xian-liang, ZHENG Hai-gang, LI Ling-li, LUO Jia-ji, DING Juan, FAN Xiao-ran. THE COSEISMIC RUPTURE MODEL AND STRESS CHANGE OF THE 2022 MENYUAN MW6.7 EARTHQUAKE [J]. SEISMOLOGY AND GEOLOGY, 2023, 45(1): 286-303. |
| Viewed | ||||||
|
Full text |
|
|||||
|
Abstract |
|
|||||
Copyright © SEISMOLOGY AND GEOLOGY, All Rights Reserved.
Tel: 010-62009049/9063 E-mail: dzdz@ies.ac.cn
Powered by Beijing Magtech Co., Ltd.