地震地质 ›› 2022, Vol. 44 ›› Issue (4): 1046-1058.DOI: 10.3969/j.issn.0253-4967.2022.04.014
陈丽娟1)( ), 陈学忠2), 李艳娥2), 龚丽文1)
收稿日期:2021-05-25
修回日期:2021-12-07
出版日期:2022-08-20
发布日期:2022-09-23
作者简介:陈丽娟, 女, 1988年生, 2015年于中国地震局地球物理研究所获固体地球物理学硕士学位, 工程师, 主要从事数字地震学研究, 电话: 18223100862, E-mail: 517133638@qq.com。
基金资助:
CHEN Li-juan1)(), CHEN Xue-zhong2), LI Yan-e2), GONG Li-wen1)
Received:2021-05-25
Revised:2021-12-07
Online:2022-08-20
Published:2022-09-23
摘要:
b值常用于评估区域应力水平。基于b值随应力升高而减小的理论基础, 文中试图找出b值的下降幅度与汶川地震孕震区的关系。以汶川地震的震中为中心, 选取10°×10°范围内2000年1月-2008年4月的地震目录, 通过格点搜索法搜索出汶川地震前b值具有明显下降变化的异常格点, 分析异常格点所在区域内b值的时序变化。结果显示, 异常格点的分布随着b值下降幅度的增大逐渐收敛至龙门山断裂带的都江堰-北川段, 与汶川地震破裂区的南段重合, 汶川地震起始破裂点位于异常区的东南缘。异常区内b值随时间呈现“趋势下降-平稳变化-临震前急剧下降”的变化形态, 分别持续3.5a、 2a和4个月。文中关注b值的下降变化过程, 能在较大范围内搜索出b值呈下降变化形态的区域, 而这些区域对应于应力增强区, 这可为未来强震的震中判定提供参考依据。
中图分类号:
陈丽娟, 陈学忠, 李艳娥, 龚丽文. b值下降幅度与汶川MS8.0 地震孕震区的关系[J]. 地震地质, 2022, 44(4): 1046-1058.
CHEN Li-juan, CHEN Xue-zhong, LI Yan-e, GONG Li-wen. RELATIONSHIP BETWEEN DECREASING AMPLITUDE OF b-VALUE AND THE SEISMOGENIC ZONE OF THE WENCHUAN MS8.0 EARTHQUAKE[J]. SEISMOLOGY AND GEOLOGY, 2022, 44(4): 1046-1058.
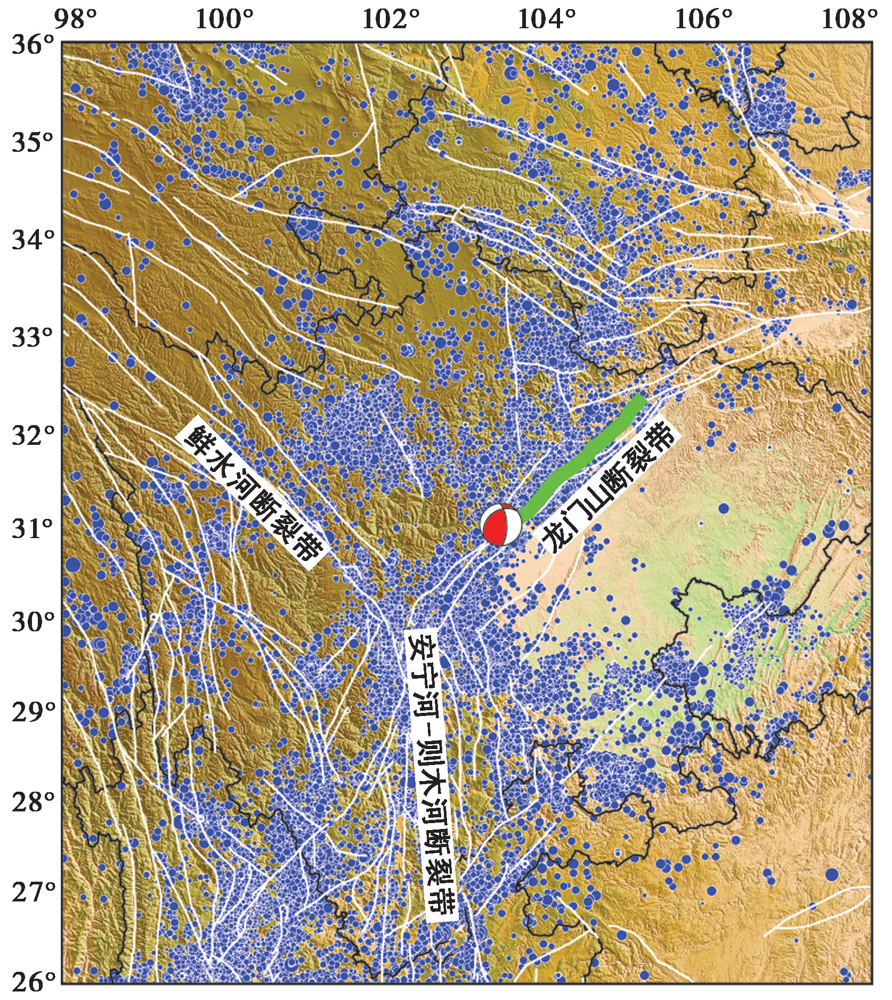
图1 研究区及2000年1月-2008年4月ML≥1.0地震分布图 蓝色实心圆为地震, 红色震源球为汶川 MS8.0 地震, 震源机制解来自GCMT(Global Centroid-Moment-Tensor)目录, 绿色实线为汶川地震的主破裂带(修改自史海霞等, 2018), 白色实线为断层
Fig. 1 The study area and earthquakes(ML≥1.0)from Jan. 2000 to April 2008.
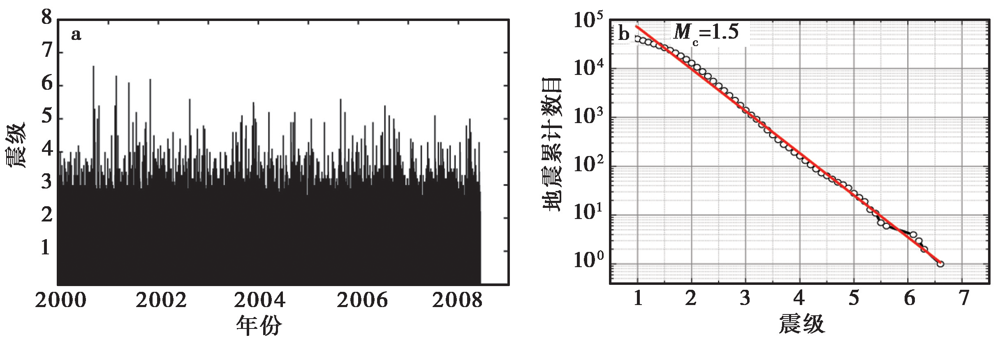
图2 研究区域内M-T图(a)和G-R关系图(b)
Fig. 2 The chronological orders of earthquakes(a)and magnitude-frequency relation(b)in the study area.
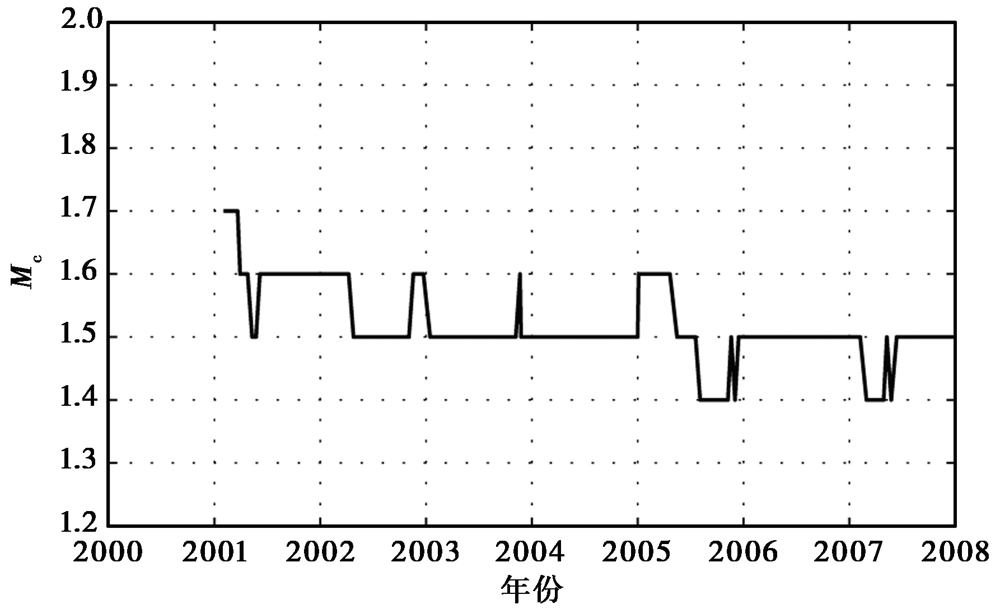
图3 研究区域内Mc随时间的变化
Fig. 3 Variation of Mc with time in the study area.
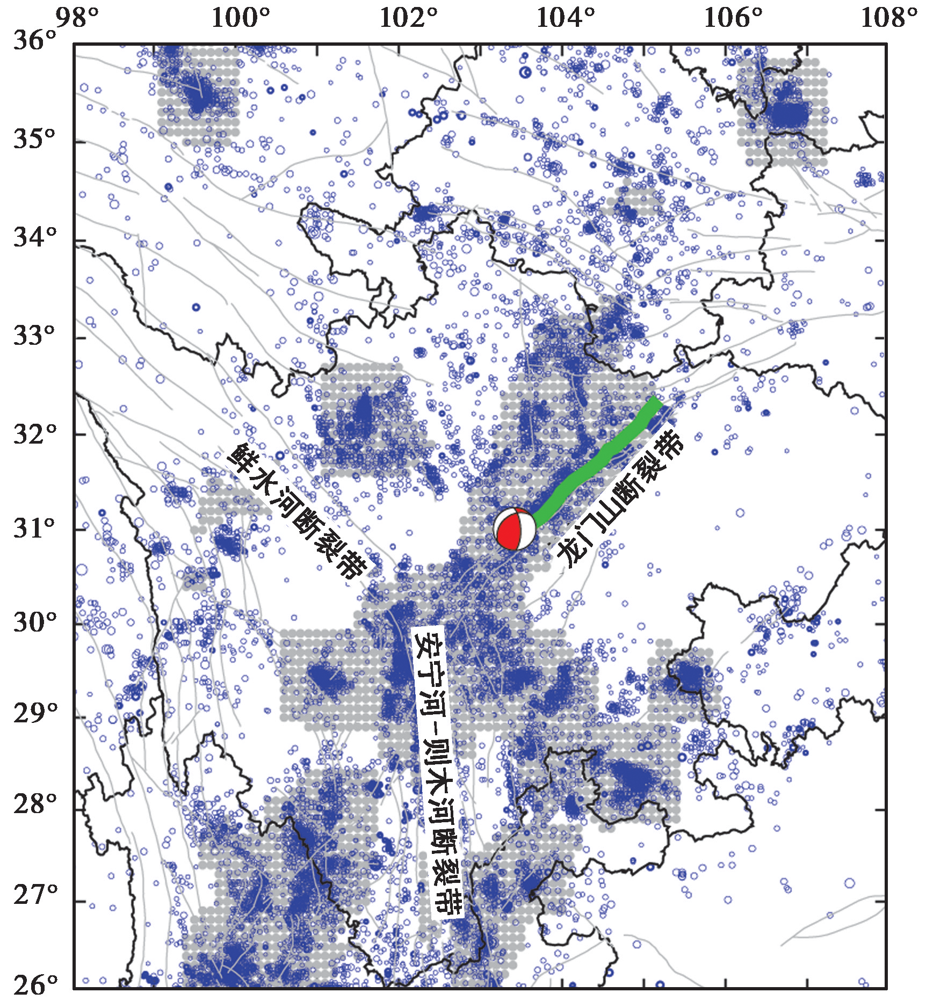
图4 计算了b值时间曲线的格点分布与所选取地震的震中分布 蓝色空心圆为ML≥1.7地震, 灰色实心圆为计算了时间曲线的格点, 红色震源球为汶川地震, 绿色实线为汶川地震的主破裂带
Fig. 4 The distribution of selected earthquakes and the grids calculated b-value time curves.
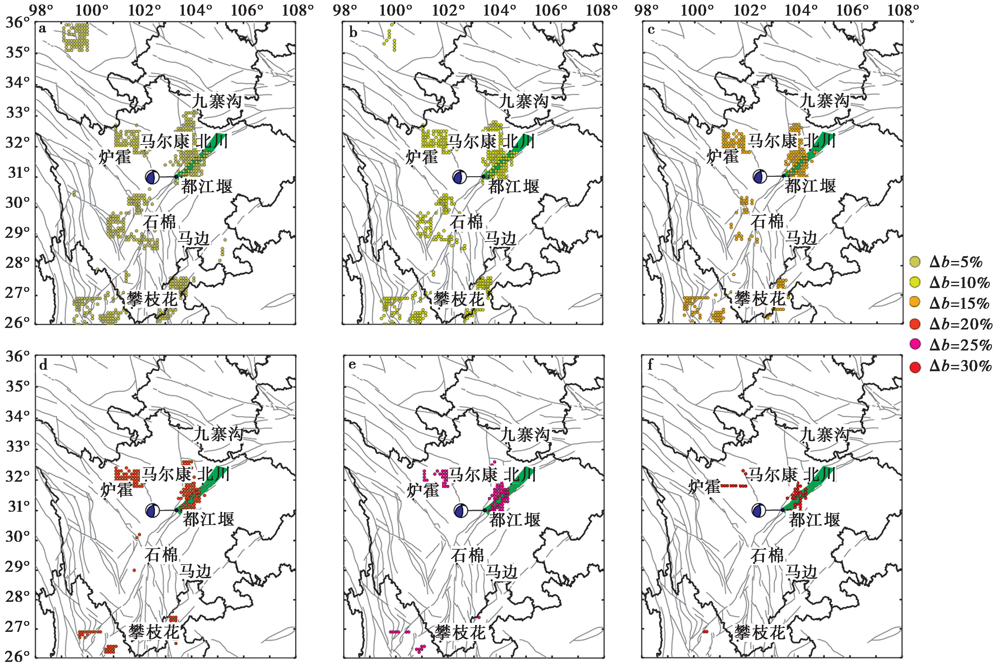
图5 不同b值下降幅度Δb对应的异常格点分布 绿色实线为汶川地震的主破裂带, 彩色实心圆为所在子区内b值时间曲线出现下降变化形态的格点, 图a-f为b值下降幅度Δb分别≥5%、 10%、 15%、 20%、 25%和30%时的格点分布
Fig. 5 The grid points distribution with decreasing b value obtained by grid point search method.
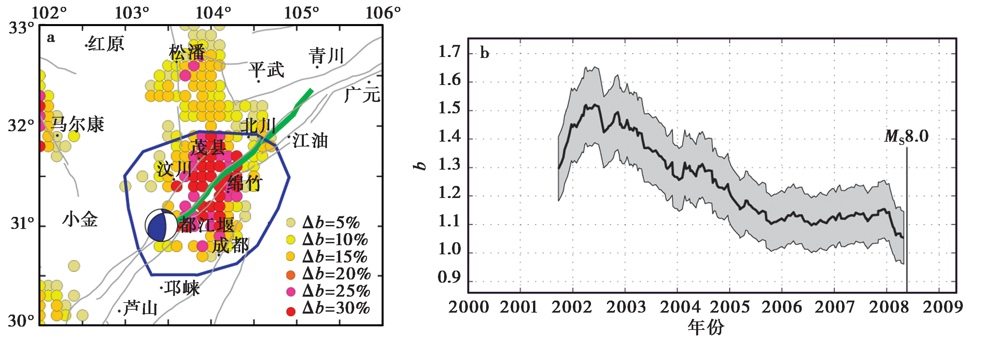
图6 b值异常区的选取(a)及异常区内b值的时间曲线(b) 彩色实心圆为异常格点, 蓝色线段为选取的异常区, 蓝色震源球标示汶川地震的起始破裂点, 绿色线段为汶川地震的主破裂带
Fig. 6 The abnormal area(a)and the time curve of b-value(a).
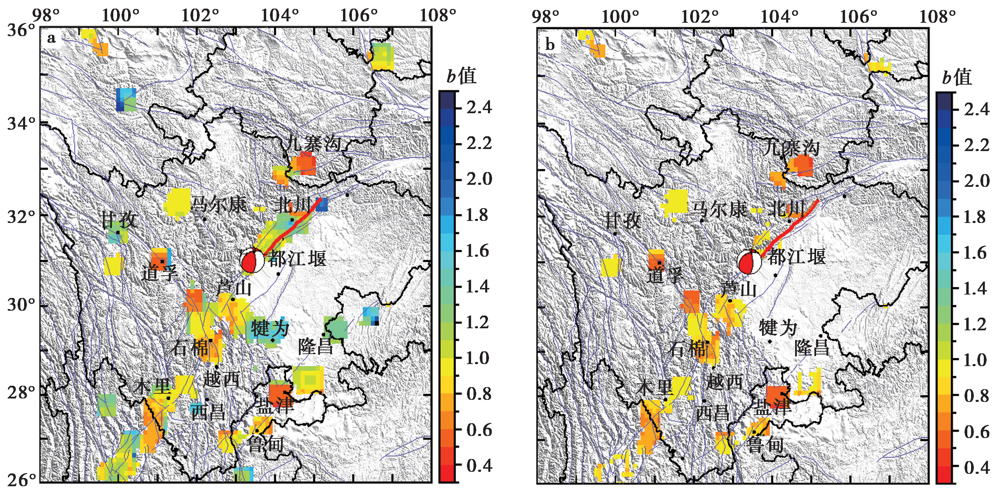
图7 2006年1月-2008年4月的b值空间扫描结果
Fig. 7 Spatial scanning distribution of b-value from Jan. 2006 to April 2008.
| [1] | 葛振龙. 2019. 高温后岩石声发射b值特征研究[D]. 南京: 中国矿业大学. |
| GE Zhen-long. 2019. Study on b-value of acoustic emission of rock after high temperature[D]. China University of Mining and Technology, Nanjing. (in Chinese) | |
| [2] | 李世杰, 吕悦军, 刘静伟. 2018. 古登堡-里希特定律中的b值统计样本量研究[J]. 震灾防御技术, 13(3): 636-645. |
| LI Shi-jie, LÜ Yue-jun, LIU Jing-wei. 2018. The study of sample size on b-value statistics in the Guterberg-Richter’s law[J]. Technology for Earthquake Disaster Prevention, 13(3): 636-645. (in Chinese) | |
| [3] | 刘雁冰, 裴顺平. 2017. 汶川地震前后b值的时空变化及构造意义[J]. 地球物理学报, 60(6): 2104-2112. |
| LIU Yan-bing, PEI Shun-ping. 2017. Temporal and spatial variation of b-value before and after Wenchuan earthquake and its tectonic implication[J]. Chinese Journal of Geophysics, 60(6): 2104-2112. (in Chinese) | |
| [4] | 刘艳辉, 赵根模, 吴中海, 等. 2015. 青藏高原东南缘及邻区近年来地震b值特征[J]. 地质通报, 34(1): 58-70. |
| LIU Yan-hui, ZHAO Gen-mo, WU Zhong-hai, et al. 2015. An analysis of b-value characteristics of earthquake on the southeastern margin of the Tibetan plateau and its neighboring areas[J]. Geological Bulletin of China, 34(1): 58-70. (in Chinese) | |
| [5] |
马瑾, 刘培洵, 刘远征. 2013. 地震活动时空演化中看到的龙门山断裂带地震孕育的几个现象[J]. 地震地质, 35(3): 461-471.doi: 10.3969/j.issn.0253-4967.2013.03.001.
DOI |
| MA Jin,LIU Pei-xun,LIU Yuan-zheng. 2013. Features of seismogenic process of the Longmenshan fault zone derived from analysis on the temporal-spatial evolution of earthquakes[J]. Seismology and Geology, 35(3): 461-471. (in Chinese) | |
| [6] | 史海霞, 孟令媛, 张雪梅, 等. 2018. 汶川地震前的b值变化[J]. 地球物理学报, 61(5): 1874-1882. |
| SHI Hai-xia, MENG Ling-yuan, ZHANG Xue-mei, et al. 2018. Decrease in b value prior to the Wenchuan earthquake(MS8.0)[J]. Chinese Journal of Geophysics, 61(5): 1874-1882. (in Chinese) | |
| [7] | 王春来, 石峰. 2018. 不同硬岩破裂失稳声发射及b值动态特征实验研究[J]. 中国矿业, 27(7): 130-134, 156. |
| WANG Chun-lai, SHI Feng. 2018. Experimental investigation on the acoustic emission and the b-value dynamic characteristics of different hard-rock failure[J]. China Mining Magazine, 27(7): 130134, 156(in Chines). | |
| [8] |
王辉, 曹建玲, 荆燕, 等. 2012. 川滇地区强震活动前b值的时空分布特征[J]. 地震地质, 34(3): 531-543. doi: 10.3969/j.issn0253-4967.2012.03.013.
DOI |
| WANG Hui, CAO Jian-ling, JING Yan, et al. 2012. Spatiotempral pattern of b-value before major earthquakes in the Sichuan-Yunnan region[J]. Seismology and Geology, 34(3): 531-543. (in Chinese) | |
| [9] | 吴开统, 焦远碧, 吕培苓. 1986. b值研究进展综述[J]. 地震, (5): 50-53. |
| WU Kai-tong, JIAO Yuan-bi, LÜ Pei-ling. 1986. Summary of the research progress of b value[J]. Earthquake, (5):50-53. (in Chinese) | |
| [10] | 解朝娣, 朱元清, 雷兴林, 等. 2010. 用地震活动多参数扫描法探测汶川地震孕育的临界信息[J]. 地震学报, 32(6): 659-669. |
| XIE Chao-di, ZHU Yuan-qing, LEI Xing-lin, et al. 2010. Variation of multiple seismicity parameters used to investigate critical behavior of the Wenchuan earthquake preparation[J]. Acta Seismologica Sinica, 32(6): 659-669. (in Chinese) | |
| [11] |
徐锡伟, 陈桂华, 于贵华, 等. 2010. 5·12汶川地震地表破裂基本参数的再论证及其构造内涵分析[J]. 地球物理学报, 53(10): 2321-2336.doi: 10.3969/j.issn.0001-5733.2010.10.006.
DOI |
| XU Xi-wei, CHEN Gui-hua, YU Gui-hua, et al. 2010. Reevalutaion of surface rupture parameters of the 5·12 Wenchuan earthquake and its tectonic implication for Tibetan uplift[J]. Chinese Journal of Geophysics, 53(10): 2321-2336. (in Chinese) | |
| [12] | 薛艳, 刘杰, 余怀忠, 等. 2012. 2011 年日本本州东海岸附近9.0级地震活动特征[J]. 科学通报, 57(8): 634-640. |
| XUE Yan, LIU Jie, YU Huai-zhong, et al. 2012. Seismicity characteristics of the 2011 M9.0 Tohoku earthquake near the east coast of Honshu in Japan[J]. Chinese Science Bulletin, 57(8): 634-640. (in Chinese) | |
| [13] | 易桂喜, 闻学泽, 王思维, 等. 2006. 由地震活动参数分析龙门山-岷山断裂带的现今活动习性与强震危险性[J]. 中国地震, 22(2): 117-125. |
| YI Gui-xi, WEN Xue-ze, WANG Si-wei, et al. 2006. Study on fault sliding behaviors and strong-earthquake risk of the Longmenshan-Minshan fault zones from current seismicity parameters[J]. Earthquake Research in China, 22(2): 117-125. (in Chinese) | |
| [14] | 易桂喜, 闻学泽, 辛华, 等. 2011. 2008年汶川 MS8.0 地震前龙门山-岷山构造带的地震活动性参数与地震视应力分布[J]. 地球物理学报, 54(6): 1490-1500. |
| YI Gui-xi, WEN Xue-ze, XIN Hua, et al. 2011. Distributions of seismicity parameters and seismic apparent stresses on the Longmenshan-Minshan tectonic zone before the 2008 MS8.0 Wenchuan earthquake[J]. Chinese Journal of Geophysics, 54(6): 1490-1500. (in Chinese) | |
| [15] | 易桂喜, 闻学泽, 辛华, 等. 2013. 龙门山断裂带南段应力状态与强震危险性研究[J]. 地球物理学报, 56(4): 1112-1120. |
| YI Gui-xi, WEN Xue-ze, XIN Hua, et al. 2013. Stress state and major-earthquake risk on the southern segment of the Longmen Shan fault zone[J]. Chinese Journal of Geophysics, 56(4): 1112-1120. (in Chinese) | |
| [16] | 曾正文, 马瑾, 刘力强, 等. 1995. 岩石破裂扩展过程中的声发射b值动态特征及意义[J]. 地震地质, 17(1): 7-12. |
| ZENG Zheng-wen, MA Jin, LIU Li-qiang, et al. 1995. AE b-value dynamic features during rockmass fracturing and their significances[J]. Seismology and Geology, 17(1): 7-12. (in Chinese) | |
| [17] | 张黎明, 马绍琼, 任明远, 等. 2015. 不同围压下岩石破坏过程的声发射频率及b值特征[J]. 岩石力学与工程学报, 34(10): 2057-2063. |
| ZHANG Li-ming, MA Shao-qiong, REN Ming-yuan, et al. 2015. Acoustic emission frequency and b value characteristics in rock failure process under various confining pressures[J]. Chinese Journal of Rock Mechanics and Engineering, 34(10): 2057-2063. (in Chinese) | |
| [18] | 张勇, 冯万鹏, 许力生, 等. 2008. 2008年汶川大地震的时空破裂过程[J]. 中国科学(D辑), 38(10): 1186-1194. |
| ZHANG Yong, FENG Wan-peng, XU Li-sheng, et al. 2008. The spatio-temporal rupture process of the 2008 Wenchuan earthquake[J]. Science in China(Ser D), 38(10): 1186-1194. (in Chinese) | |
| [19] | 赵翠萍, 陈章立, 周连庆, 等. 2009. 汶川 MW8.0 地震震源破裂过程研究: 分段特征[J]. 科学通报, 54(22): 3475-3482. |
| ZHAO Cui-ping, CHEN Zhang-li, ZHOU Lian-qing, et al. 2009. Rupture process of the MS8.0 Wenchuan earthquake of Sichuan, China: The segmentation feature[J]. Chinese Science Bulletin, 54(22): 3475-3482. (in Chinese) | |
| [20] | 赵建军, 樊奇, 李鹏飞, 等. 2019. 不同应力路径下英安岩声发射b值特征及破坏前兆[J]. 工程地质学报, 27(3): 487-496. |
| ZHAO Jian-jun, FAN Qi, LI Peng-fei, et al. 2019. Acoustic emission b value characteristics and failure precursor of the dacite under different stress paths[J]. Journal of Engineering Geology, 27(3): 487-496. (in Chinese) | |
| [21] | Aki K. 1965. Maximum likelihood estimate of b in the formula logN=a-bM and its confidence limits[J]. Bulletin of the Earthquake Research Institute, University of Tokyo, 43: 237-239. |
| [22] | Cao A, Gao S S. 2002. Temporal variation of seismic b-values beneath northeastern Japan island arc[J]. Geophysical Research Letters, 29(9): 48-1-48-3. |
| [23] |
Chen J, Zhu S B. 2020. Spatial and temporal b-value precursors preceding the 2008 Wenchuan, China, earthquake(MW=7.9): Implications for earthquake prediction[J]. Geomatics, Natural Hazards and Risk, 11(1): 1196-1211.
DOI URL |
| [24] | Goebel T H W, Becker T W, Schorlemmer D, et al. 2012. Identifying fault heterogeneity through mapping spatial anomalies in acoustic emission statistics[J]. Journal of Geophysical Research, 117(B3): B033310. |
| [25] |
Gutenberg B, Richter C F. 1944. Frequency of earthquakes in California[J]. Bulletin of the Seismological Society of America, 34(4): 185-188.
DOI URL |
| [26] |
Hainzl S, Zöller G, Kurths J. 1999. Similar power laws for foreshock and aftershock sequences in a spring-block model for earthquakes[J]. Journal of Geophysical Research, 104(B4): 7243-7253.
DOI URL |
| [27] |
Knopoff L, Landoni J A, Abinante M S. 1992. Dynamical model of an earthquake fault with localization[J]. Physical Review A: Atomic, Molecular, and Optical Physics, 46(12): 7445-7449.
DOI URL |
| [28] | Main I G, Meredith P G, Jones C. 1989. A reinterpretation of the precursory seismic b-value anomaly from fracture mechanics[J]. Geophysical Journal of the Royal Astronomical Society, 96(1): 131-138. |
| [29] | Mogi K. 1962. Study of elastic shocks caused by the fracture of heterogeneous materials and its relations to earthquakes phenomena[J]. Bulletin of the Earthquake Research Institute, University of Tokyo, 40: 125-173. |
| [30] | Nakaya S. 2006. Spatiotemporal variation in b value within the subducting slab prior to the 2003 Tokachi-Oki earthquake(M8.0), Japan[J]. Journal of Geophysical Research, 111: B03311. |
| [31] | Nanjo K Z, Hirata N, Obara K, et al. 2012. Decade-scale decrease in b value prior to the M9-class 2011 Tohoku and 2004 Sumatra quakes[J]. Geophysical Research Letters, 39(20): L20304. |
| [32] | Nuannin P. 2005. Spatial and temporal b value anomalies preceding the devastating off coast of NW Sumatra earthquake of December 26, 2004[J]. Geophysical Research Letters, 32: L11307. |
| [33] |
Scholz C H. 1968. The frequency-magnitude relation of microfracturing in rock and its relation to earthquakes[J]. Bulletin of the Seismological Society of America, 58(1): 399-415.
DOI URL |
| [34] |
Suyehiro S. 1966. Difference between aftershocks and foreshocks in the relationship of magnitude to frequency of occurrence for the great Chilean earthquake of 1960[J]. Bulletin of the Seismological Society of America, 56(1): 185-200.
DOI URL |
| [35] | Urbancic T I, Trifu C I, Long J M, et al. 1992. Space-time correlations of b values with stress release[J]. Pure and Applied Geophysics(PAGEOPH), 139(3-4): 449-462. |
| [36] |
Wyss M. 1973. Towards a physical understanding of the earthquake frequency distribution[J]. Geophysical Journal International, 31(4): 341-359.
DOI URL |
| [37] |
Zhang S, Zhou S. 2015. Spatial and temporal variation of b-values in southwest China[J]. Pure and Applied Geophysics, 173(1): 85-96.
DOI URL |
| [38] |
Zhao Y Z, Wu Z L. 2008. Mapping the b-values along the Longmenshan fault zone before and after the 12 May 2008, Wenchuan, China, MS8.0 earthquake[J]. Natural Hazards and Earth System Science, 8(6): 1375-1385.
DOI URL |
| [1] | 张继红, 赵国泽, 王晋生, 唐廷梅, 齐丽杰. 2008年汶川MS8.0地震与青岛台地电阻率异常变化的关系[J]. 地震地质, 2010, 32(3): 409-416. |
| [2] | 孙昌斌, 谢新生, 江娃利. 汶川MS8.0地震绵竹县汉旺镇周边地表破裂带展布方式及其震害意义[J]. 地震地质, 2010, 32(2): 200-212. |
| [3] | 刘进峰, 陈杰, 尹金辉, 陈立春, 卢演俦, 杨会丽. 龙门山映秀-北川断裂带擂鼓探槽剖面古地震事件测年[J]. 地震地质, 2010, 32(2): 191-199. |
| [4] | 屈春燕, 单新建, 宋小刚, 张桂芳, 张国宏, 郭利民, 刘云华, 韩宇飞. D-InSAR技术应用于汶川地震地表位移场的空间分析[J]. 地震地质, 2010, 32(2): 175-190. |
| [5] | 郁耀闯, 周旗, 王长燕. 普通民众认知与响应汶川MS8.0地震特征分析——以陕西勉县为例[J]. 地震地质, 2010, 32(2): 269-281. |
| [6] | 马文涛, 李海鸥, 徐锡伟, 杨清源, 陈献程, 徐长朋, 于贵华, 张兰凤. 利用水库诱发地震数据库快速为政府部门提供汶川Ms8.0地震灾害对策[J]. 地震地质, 2009, 31(4): 792-798. |
| [7] | 李陈侠, 安艳芬, 于贵华, 徐锡伟, 陈桂华, 王世元, 宫会玲, 杨虎, 郭婷婷, 张兰凤. 汶川MS8.0地震的地质科学考察数据库简介[J]. 地震地质, 2008, 30(3): 804-810. |
| [8] | 马文涛, 李海鸥, 杨主恩, 陈桂华, 陈献程, 杨清源, 邓志辉, 孙谦. 汶川MS8.0地震对四川省水电水利工程场地安全性评价结果的检验[J]. 地震地质, 2008, 30(3): 796-803. |
| [9] | 孙建宝, 梁芳, 沈正康, 徐锡伟. 汶川MS8.0地震InSAR形变观测及初步分析[J]. 地震地质, 2008, 30(3): 789-795. |
| [10] | 朱艾斓, 徐锡伟, 刁桂苓, 苏金蓉, 冯向东, 孙晴, 王亚丽. 汶川MS8.0地震部分余震重新定位及地震构造初步分析[J]. 地震地质, 2008, 30(3): 759-767. |
| [11] | 陈桂华, 徐锡伟, 郑荣章, 于贵华, 李峰, 李陈侠, 闻学泽, 何玉林, 叶友青, 陈献程, 王志才. 2008年汶川MS8.0地震地表破裂变形定量分析——北川-映秀断裂地表破裂带[J]. 地震地质, 2008, 30(3): 723-738. |
| [12] | 李传友, 叶建青, 谢富仁, 郑文俊, 韩用兵, 刘玉法, 王伟涛, 魏占玉, 赵冬, 马保起, 任俊杰. 汶川MS8.0地震地表破裂带北川以北段的基本特征[J]. 地震地质, 2008, 30(3): 683-696. |
| [13] | 陈桂华, 李峰, 郑荣章, 徐锡伟, 于贵华, 闻学泽, 安艳芬, 李陈侠. 逆冲型断裂同震地表变形定量分析的几个问题——以汶川MS8.0地震为例[J]. 地震地质, 2008, 30(3): 674-682. |
| [14] | 何宏林, 孙昭民, 魏占玉, 董绍鹏, 高翔, 王世元, 王纪强. 汶川MS8.0地震地表破裂带白沙河段破裂及其位移特征[J]. 地震地质, 2008, 30(3): 658-673. |
| [15] | 冉勇康, 陈立春, 陈桂华, 尹金辉, 陈杰, 宫会玲, 史翔, 李陈侠. 汶川MS8.0地震发震断裂大地震原地重复现象初析[J]. 地震地质, 2008, 30(3): 630-643. |
| 阅读次数 | ||||||
|
全文 |
|
|||||
|
摘要 |
|
|||||
