
SEISMOLOGY AND GEOLOGY ›› 2026, Vol. 48 ›› Issue (3): 597-650.DOI: 10.3969/j.issn.0253-4967.20240168
• Review • Previous Articles Next Articles
APPLICATION OF APPARENT RESISTIVITY OBSERVATION IN EARTHQUAKE PREDICTION
XIE Tao1)( ), LI Xin-yan2), HAN Ying1), YU Chen1), LI Xiao-fan1)
- 1)
China Earthquake Networks Center ,CEA
2)Earthquake Agency of Ningxia Hui Autonomous Region
-
Received:2025-02-26Revised:2025-03-21Online:2026-06-20Published:2026-07-09
地电阻率观测在地震预测中的应用
解滔1)(), 李新艳2), 韩盈1), 于晨1), 李晓帆1)
- 1)
中国地震台网中心
2)宁夏回族自治区地震局
-
作者简介:解滔, 男, 1986年生, 2017年于中国石油勘探开发研究院获得地球探测与信息技术专业工学博士学位, 研究员, 目前主要从事地震电磁监测预报、地球物理观测与地震孕育过程方面的研究, E-mail: xtaolake@163.com。
-
基金资助:国家自然科学基金项目(42474116); 国家自然科学基金项目(42104075)

Cite this article
XIE Tao, LI Xin-yan, HAN Ying, YU Chen, LI Xiao-fan. APPLICATION OF APPARENT RESISTIVITY OBSERVATION IN EARTHQUAKE PREDICTION[J]. SEISMOLOGY AND GEOLOGY, 2026, 48(3): 597-650.
解滔, 李新艳, 韩盈, 于晨, 李晓帆. 地电阻率观测在地震预测中的应用[J]. 地震地质, 2026, 48(3): 597-650.
share this article
Add to citation manager EndNote|Ris|BibTeX
URL: https://www.dzdz.ac.cn/EN/10.3969/j.issn.0253-4967.20240168
| 序号 | 岩石、土层 | 孔隙度/% | 序号 | 岩石、土层 | 孔隙度/% | 序号 | 岩石、土层 | 孔隙度/% |
|---|---|---|---|---|---|---|---|---|
| 1 | 变质页岩 | 0.02~0.60 | 8 | 石英岩 | 0.00~8.70 | 15 | 古近-新近纪砂岩 | 2.20~42.00 |
| 2 | 花岗岩 | 0.05~2.80 | 9 | 黏土质砂岩 | 0.40~10.00 | 16 | 白垩纪砂岩 | 7.20~37.70 |
| 3 | 大理岩 | 0.10~6.00 | 10 | 砂质页岩 | 1.50~44.80 | 17 | 三叠纪砂岩 | 0.60~27.70 |
| 4 | 硅质页岩 | 0.80~1.50 | 11 | 砂岩 | 8.10~9.50 | 18 | 砾岩 | 20.20~37.70 |
| 5 | 黑色页岩 | 0.70~1.40 | 12 | 中生代石灰岩 | 1.20~26.50 | 19 | 黏土 | 10.10~62.90 |
| 6 | 片麻岩 | 0.30~2.40 | 13 | 板岩状页岩 | 1.10~20.00 | 20 | 土壤 | 20.00~69.40 |
| 7 | 硬石膏 | 0.03~6.26 | 14 | 侏罗纪砂岩 | 4.20~24.60 |
Table1 The porosity of some rock and soil
| 序号 | 岩石、土层 | 孔隙度/% | 序号 | 岩石、土层 | 孔隙度/% | 序号 | 岩石、土层 | 孔隙度/% |
|---|---|---|---|---|---|---|---|---|
| 1 | 变质页岩 | 0.02~0.60 | 8 | 石英岩 | 0.00~8.70 | 15 | 古近-新近纪砂岩 | 2.20~42.00 |
| 2 | 花岗岩 | 0.05~2.80 | 9 | 黏土质砂岩 | 0.40~10.00 | 16 | 白垩纪砂岩 | 7.20~37.70 |
| 3 | 大理岩 | 0.10~6.00 | 10 | 砂质页岩 | 1.50~44.80 | 17 | 三叠纪砂岩 | 0.60~27.70 |
| 4 | 硅质页岩 | 0.80~1.50 | 11 | 砂岩 | 8.10~9.50 | 18 | 砾岩 | 20.20~37.70 |
| 5 | 黑色页岩 | 0.70~1.40 | 12 | 中生代石灰岩 | 1.20~26.50 | 19 | 黏土 | 10.10~62.90 |
| 6 | 片麻岩 | 0.30~2.40 | 13 | 板岩状页岩 | 1.10~20.00 | 20 | 土壤 | 20.00~69.40 |
| 7 | 硬石膏 | 0.03~6.26 | 14 | 侏罗纪砂岩 | 4.20~24.60 |
| 序号 | 岩石、土层 | 电阻率//Ω·m | 序号 | 岩石、土层 | 电阻率/Ω·m | 序号 | 岩石、土层 | 电阻率/Ω·m |
|---|---|---|---|---|---|---|---|---|
| 1 | 硬石膏 | 104~106 | 11 | 石英岩 | 106~108 | 21 | 石膏 | 105~107 |
| 2 | 石灰岩 | 104~108 | 12 | 片岩 | 103~108 | 22 | 裂隙石灰岩 | 104~106 |
| 3 | 砾岩 | 101~108 | 13 | 页岩 | 103~105 | 23 | 结晶石灰岩 | 104~106 |
| 4 | 砂岩 | 10-1~108 | 14 | 泥质板岩 | 103~105 | 24 | 砂质石灰岩 | 108 |
| 5 | 花岗岩 | 106~107 | 15 | 黏土质页岩 | 103~105 | 25 | 黄土层 | 0~200 |
| 6 | 辉长岩 | 105~106 | 16 | 粉砂岩 | 104~106 | 26 | 干砂卵石层 | >600 |
| 7 | 石英斑岩 | 104~106 | 17 | 多孔砂岩 | 105~106 | 27 | 含水砂卵石层 | 50~500 |
| 8 | 橄榄岩 | 104~107 | 18 | 致密砂岩 | 105~106 | 28 | 隔水黏土层 | 5~30 |
| 9 | 千枚岩 | 104~105 | 19 | 泥灰岩 | 104~105 | 29 | 白垩纪黏土 | 5~10 |
| 10 | 大理岩 | 105~107 | 20 | 白云岩 | 105~106 | 30 | 黏土 | 1~200 |
Table2 The resistivity of common rock and soil
| 序号 | 岩石、土层 | 电阻率//Ω·m | 序号 | 岩石、土层 | 电阻率/Ω·m | 序号 | 岩石、土层 | 电阻率/Ω·m |
|---|---|---|---|---|---|---|---|---|
| 1 | 硬石膏 | 104~106 | 11 | 石英岩 | 106~108 | 21 | 石膏 | 105~107 |
| 2 | 石灰岩 | 104~108 | 12 | 片岩 | 103~108 | 22 | 裂隙石灰岩 | 104~106 |
| 3 | 砾岩 | 101~108 | 13 | 页岩 | 103~105 | 23 | 结晶石灰岩 | 104~106 |
| 4 | 砂岩 | 10-1~108 | 14 | 泥质板岩 | 103~105 | 24 | 砂质石灰岩 | 108 |
| 5 | 花岗岩 | 106~107 | 15 | 黏土质页岩 | 103~105 | 25 | 黄土层 | 0~200 |
| 6 | 辉长岩 | 105~106 | 16 | 粉砂岩 | 104~106 | 26 | 干砂卵石层 | >600 |
| 7 | 石英斑岩 | 104~106 | 17 | 多孔砂岩 | 105~106 | 27 | 含水砂卵石层 | 50~500 |
| 8 | 橄榄岩 | 104~107 | 18 | 致密砂岩 | 105~106 | 28 | 隔水黏土层 | 5~30 |
| 9 | 千枚岩 | 104~105 | 19 | 泥灰岩 | 104~105 | 29 | 白垩纪黏土 | 5~10 |
| 10 | 大理岩 | 105~107 | 20 | 白云岩 | 105~106 | 30 | 黏土 | 1~200 |
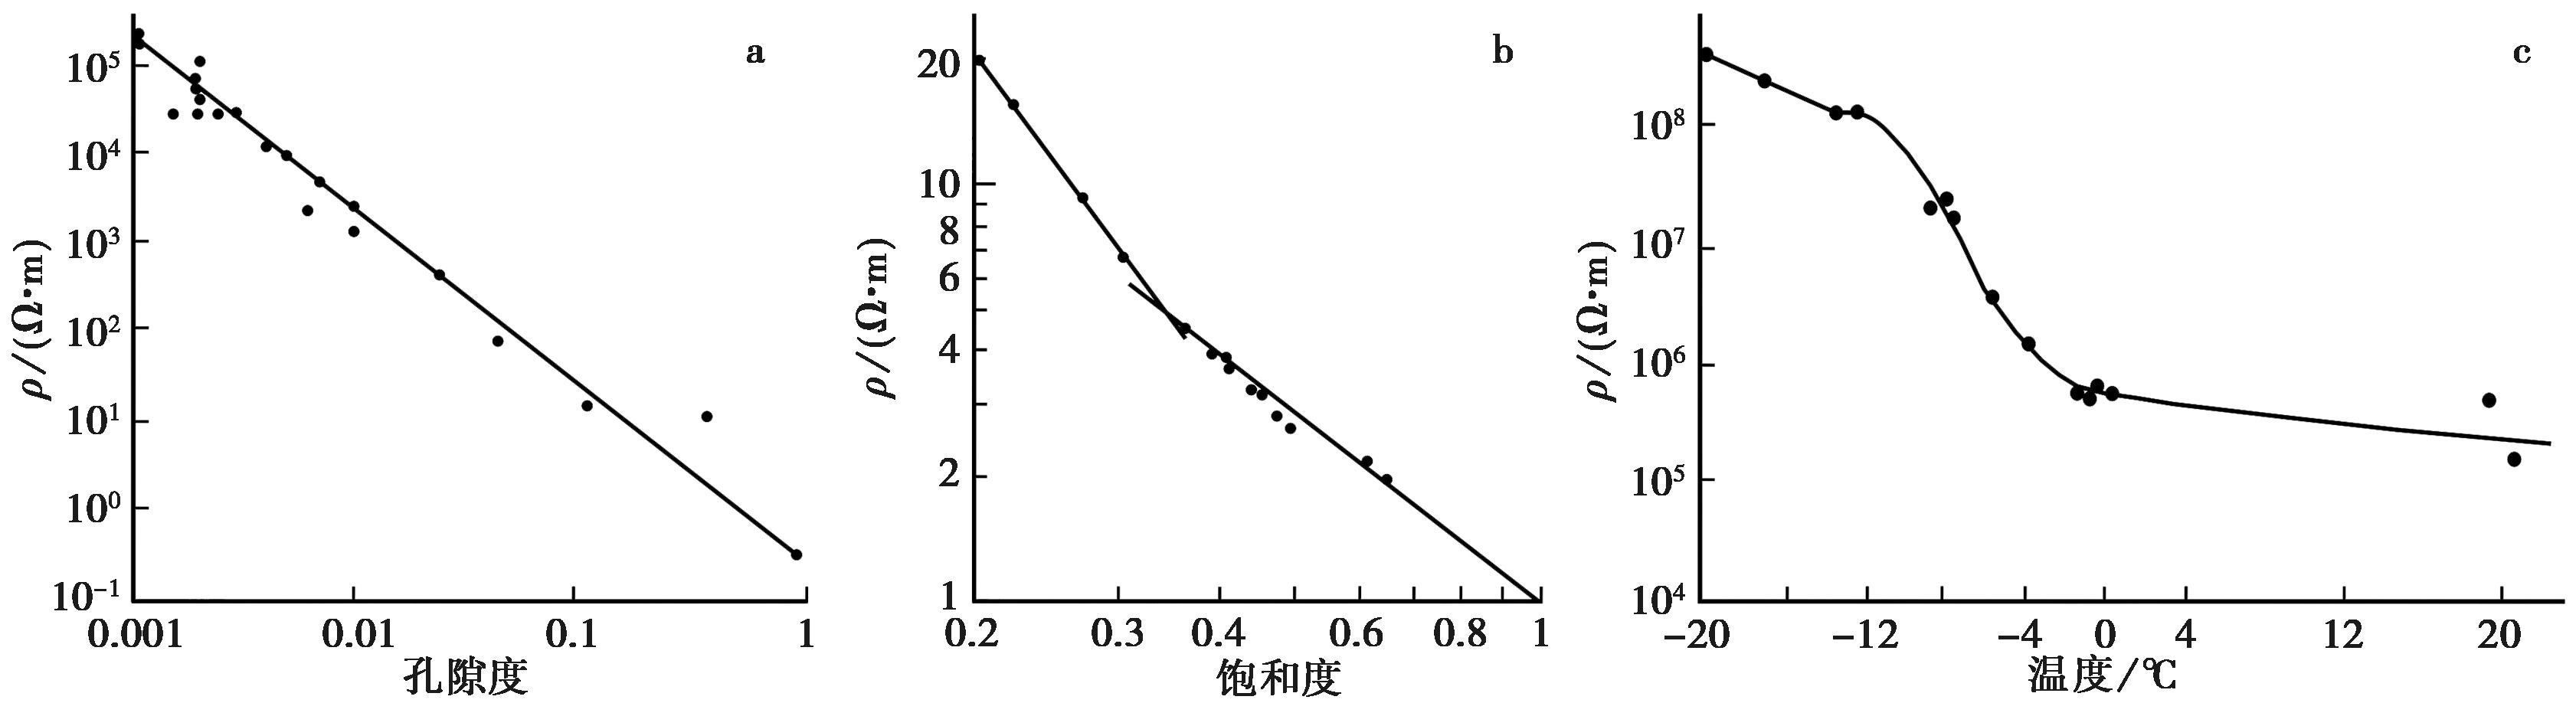
Fig. 1 Factors affecting resistivity of rock and soil medium.
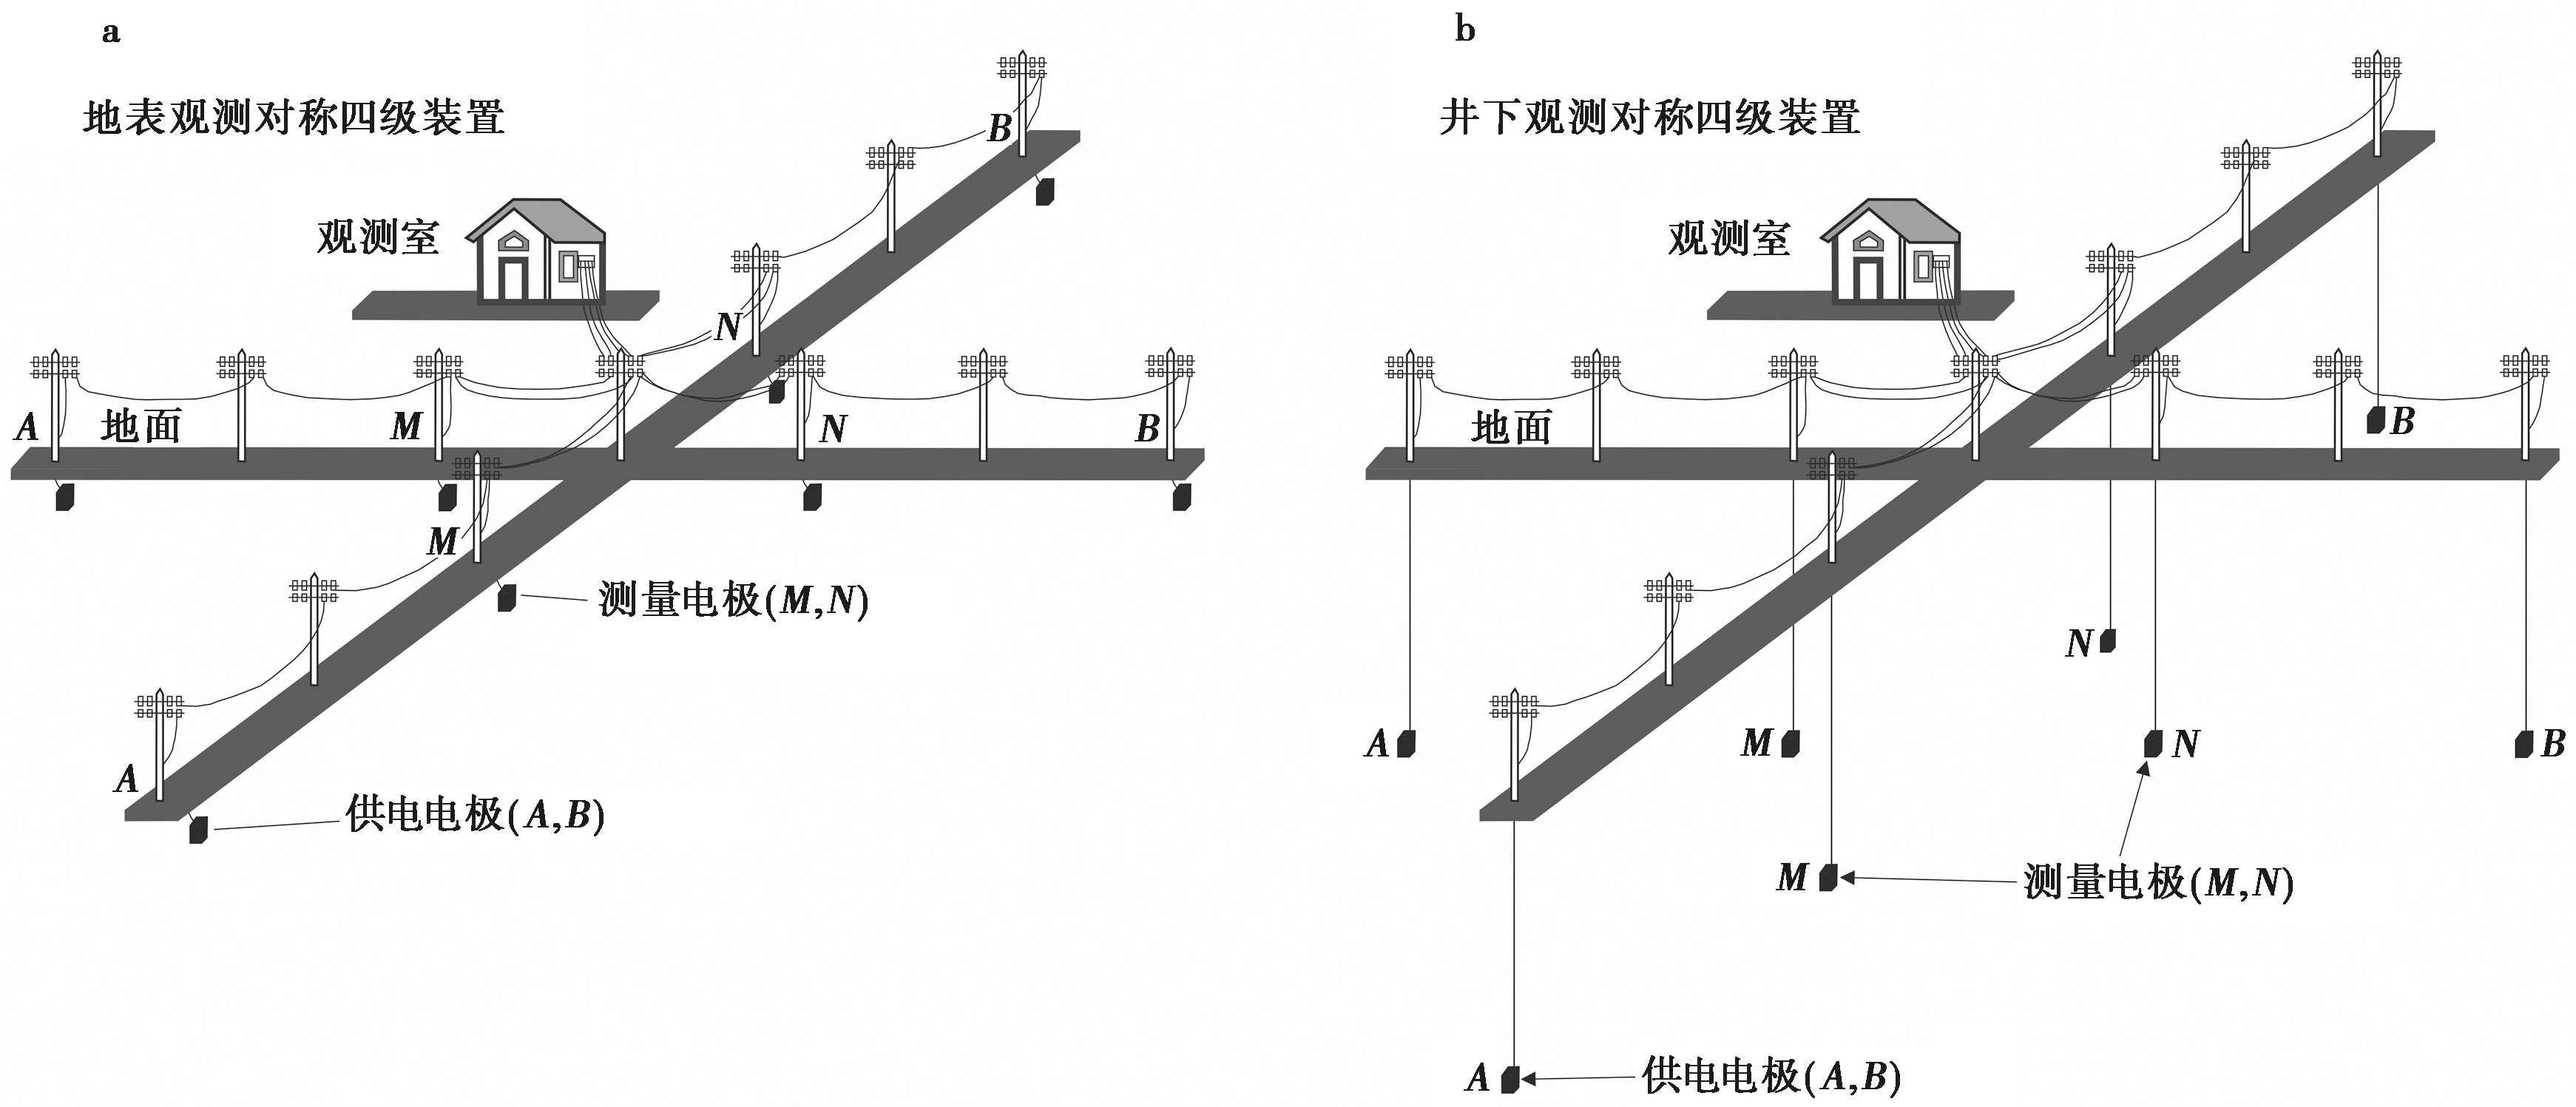
Fig. 2 The Schlumberger array used in apparent resistivity monitoring.
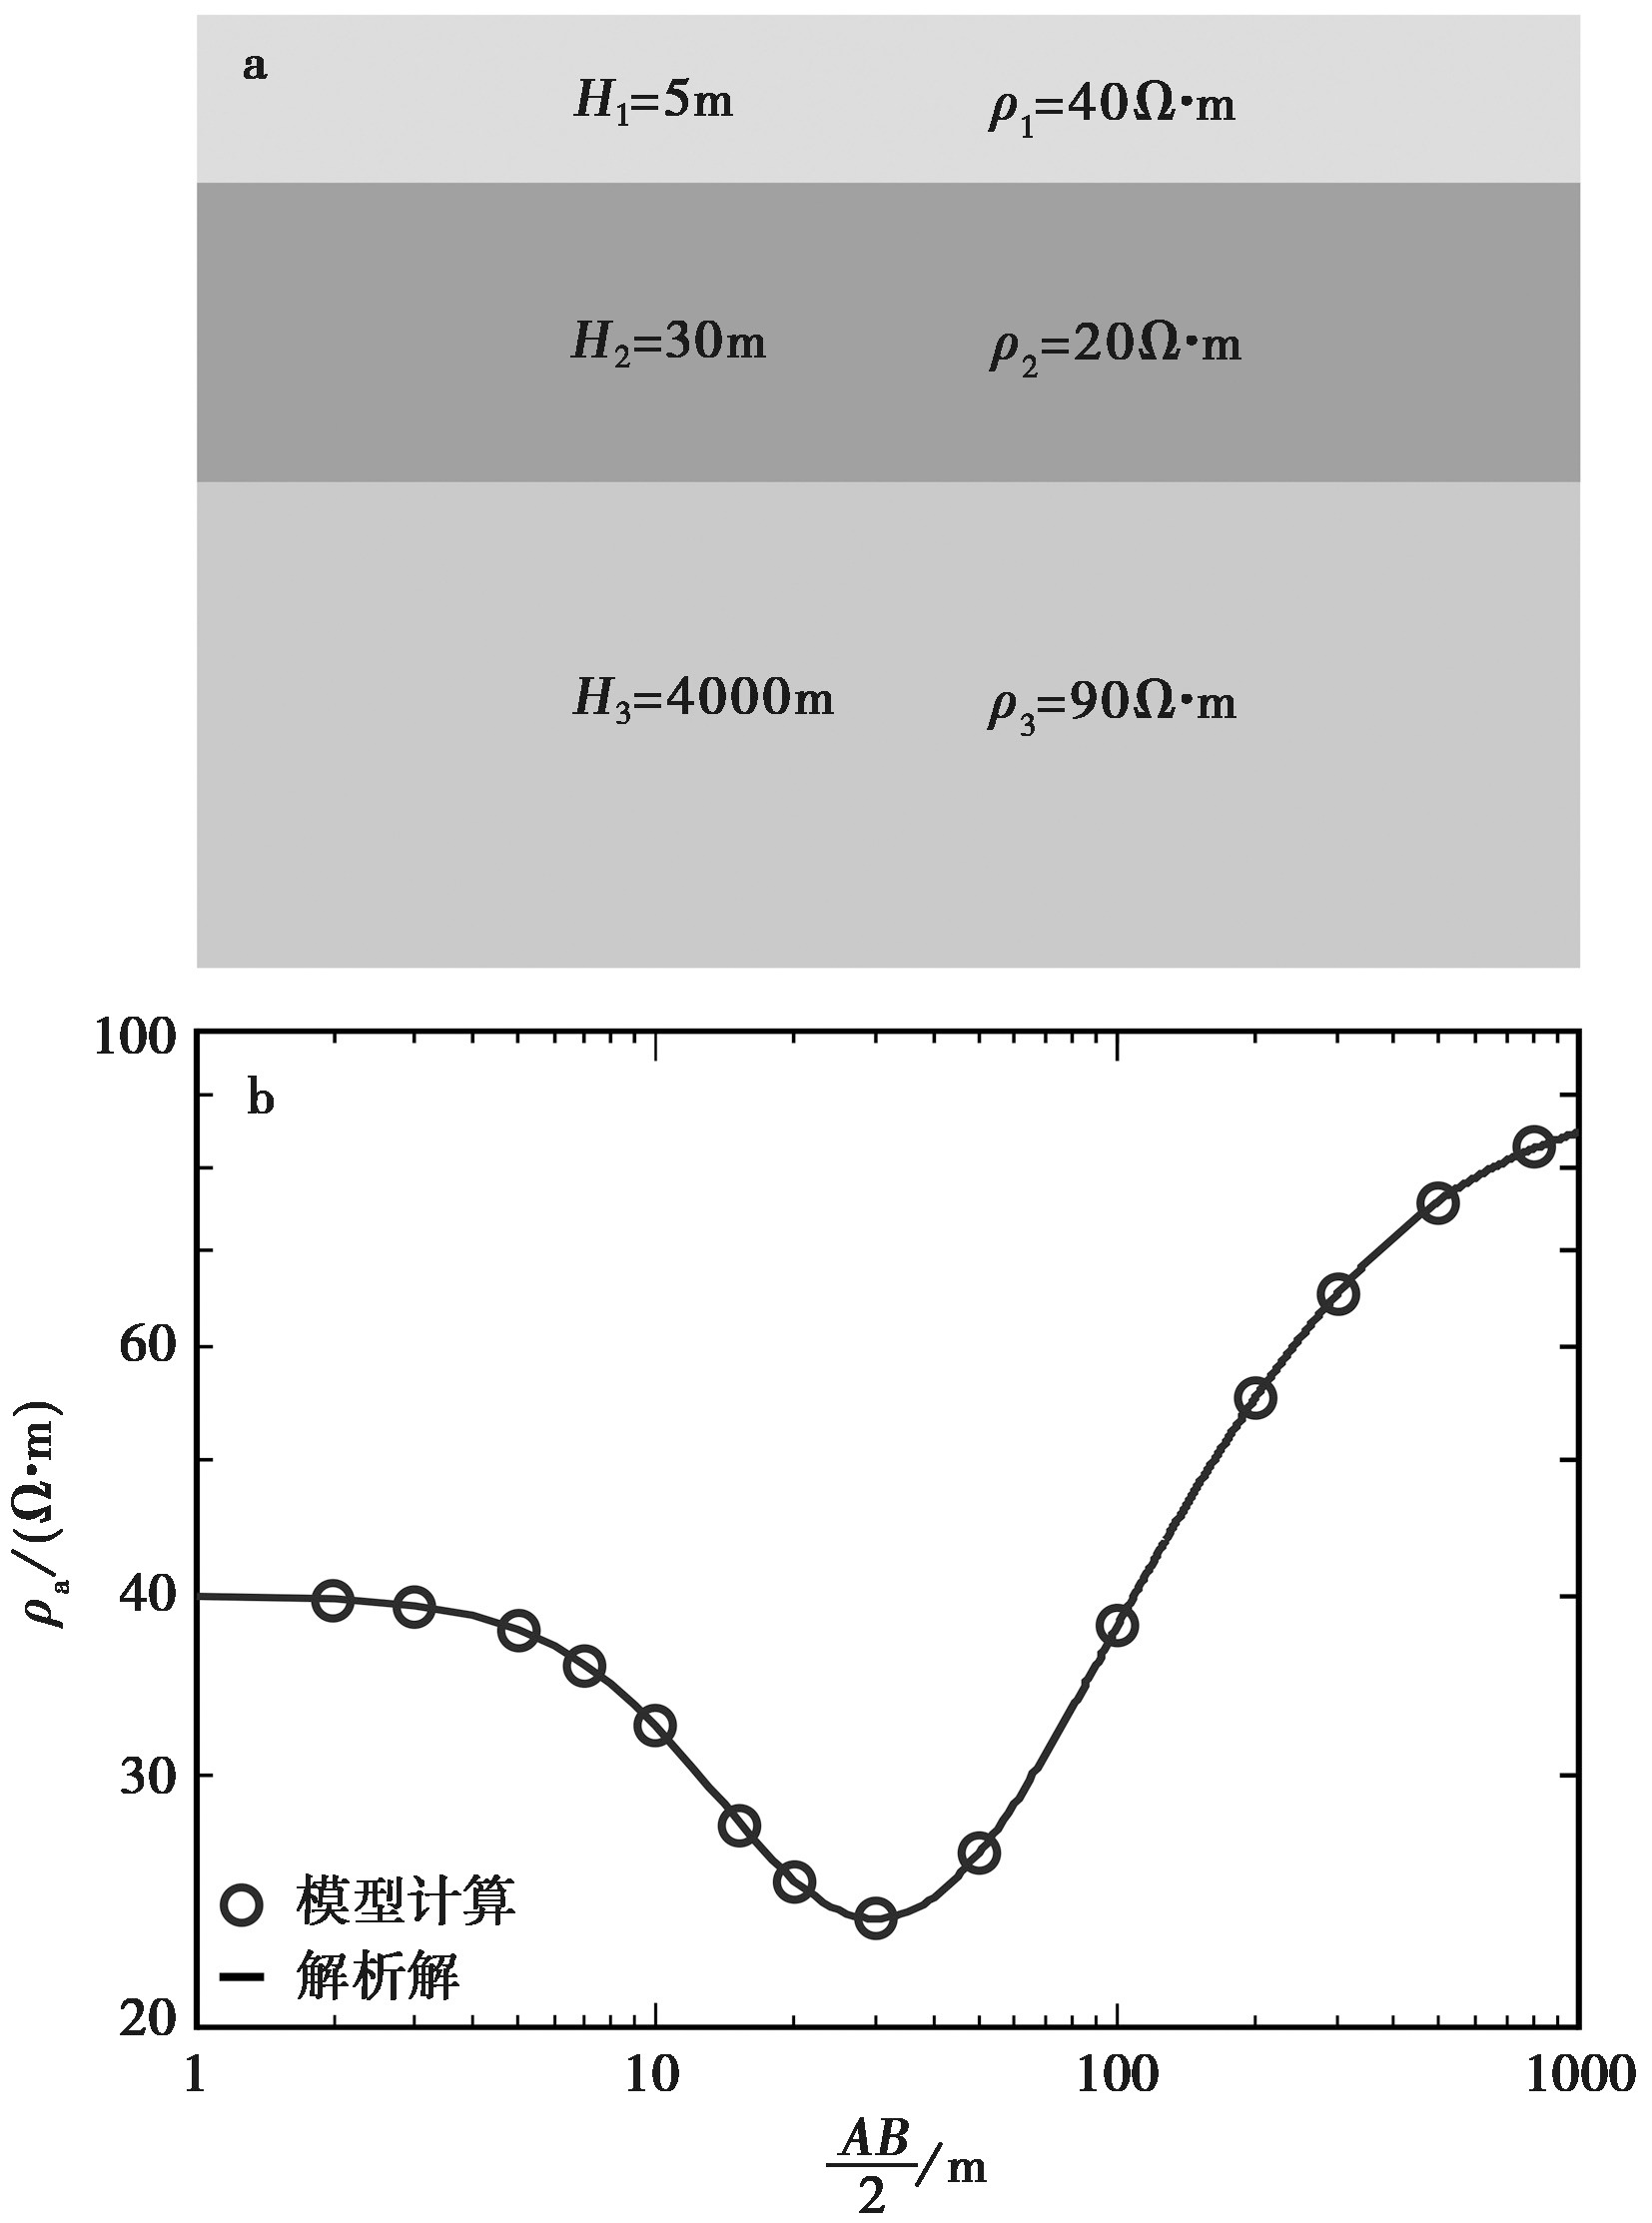
Fig. 3 Comparison of the apparent resistivity compulated from analytical and finite element method.
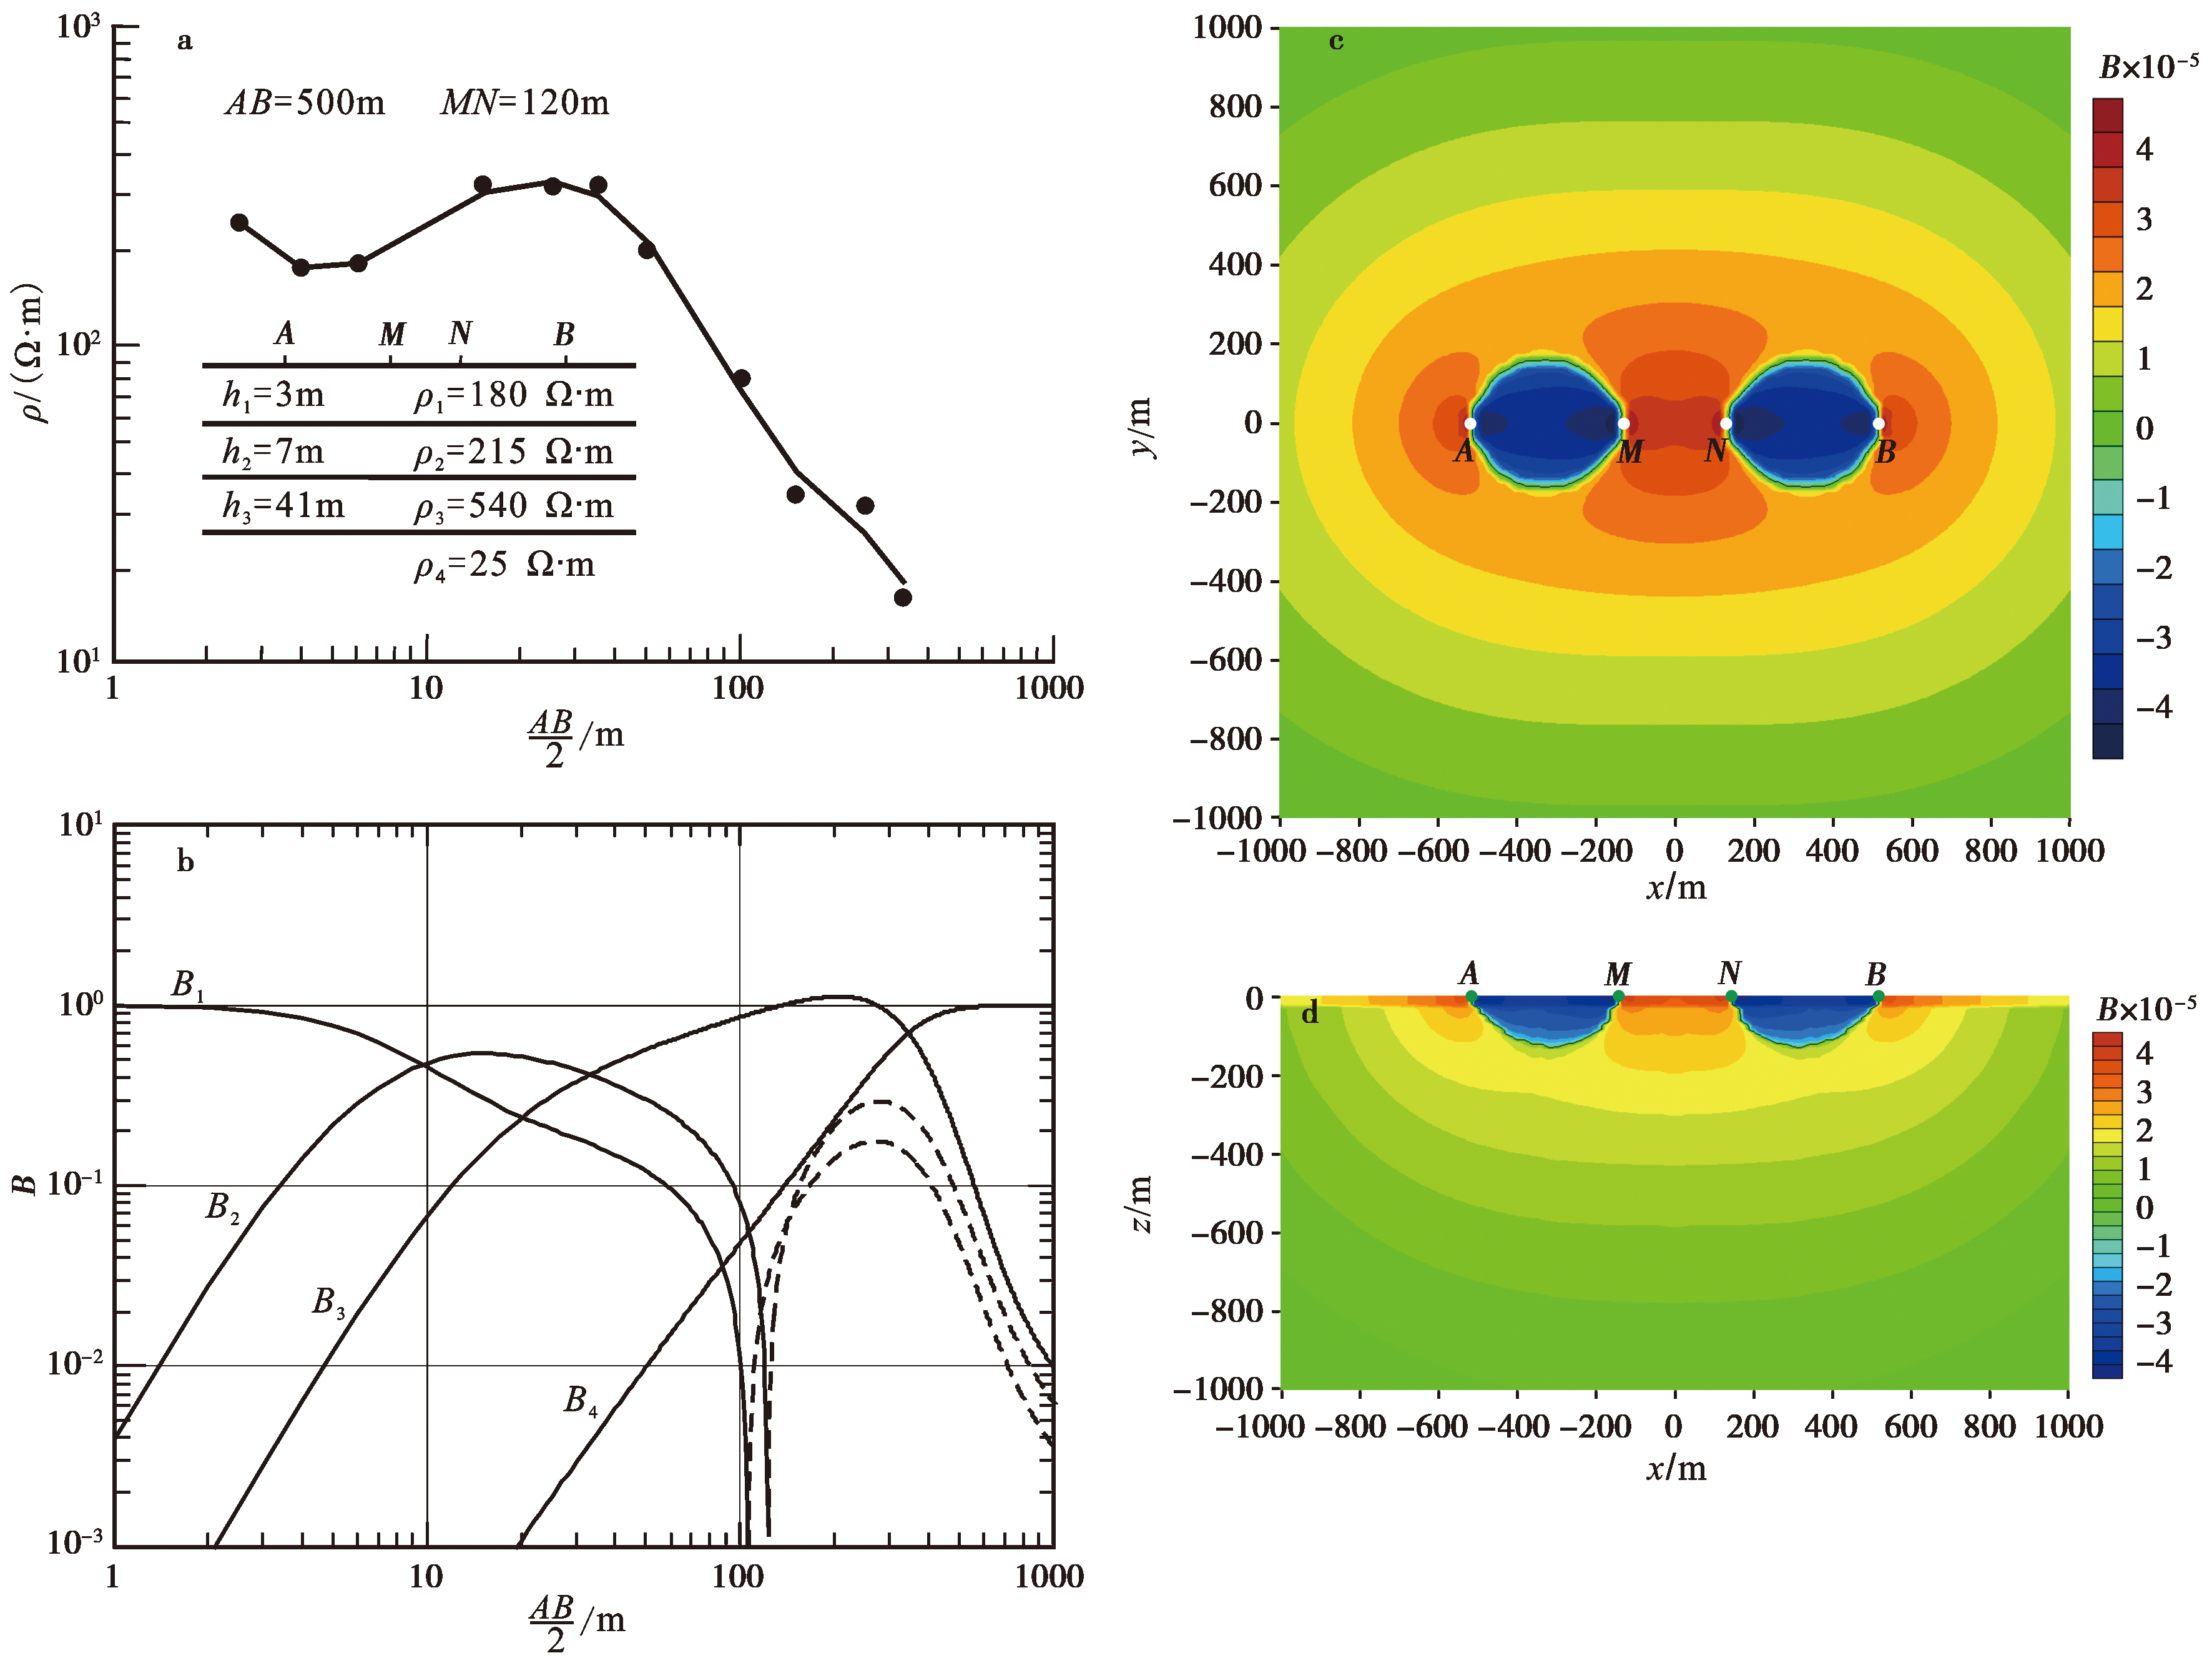
Fig. 4 The sensitivity coefficients of apparent resistivity.
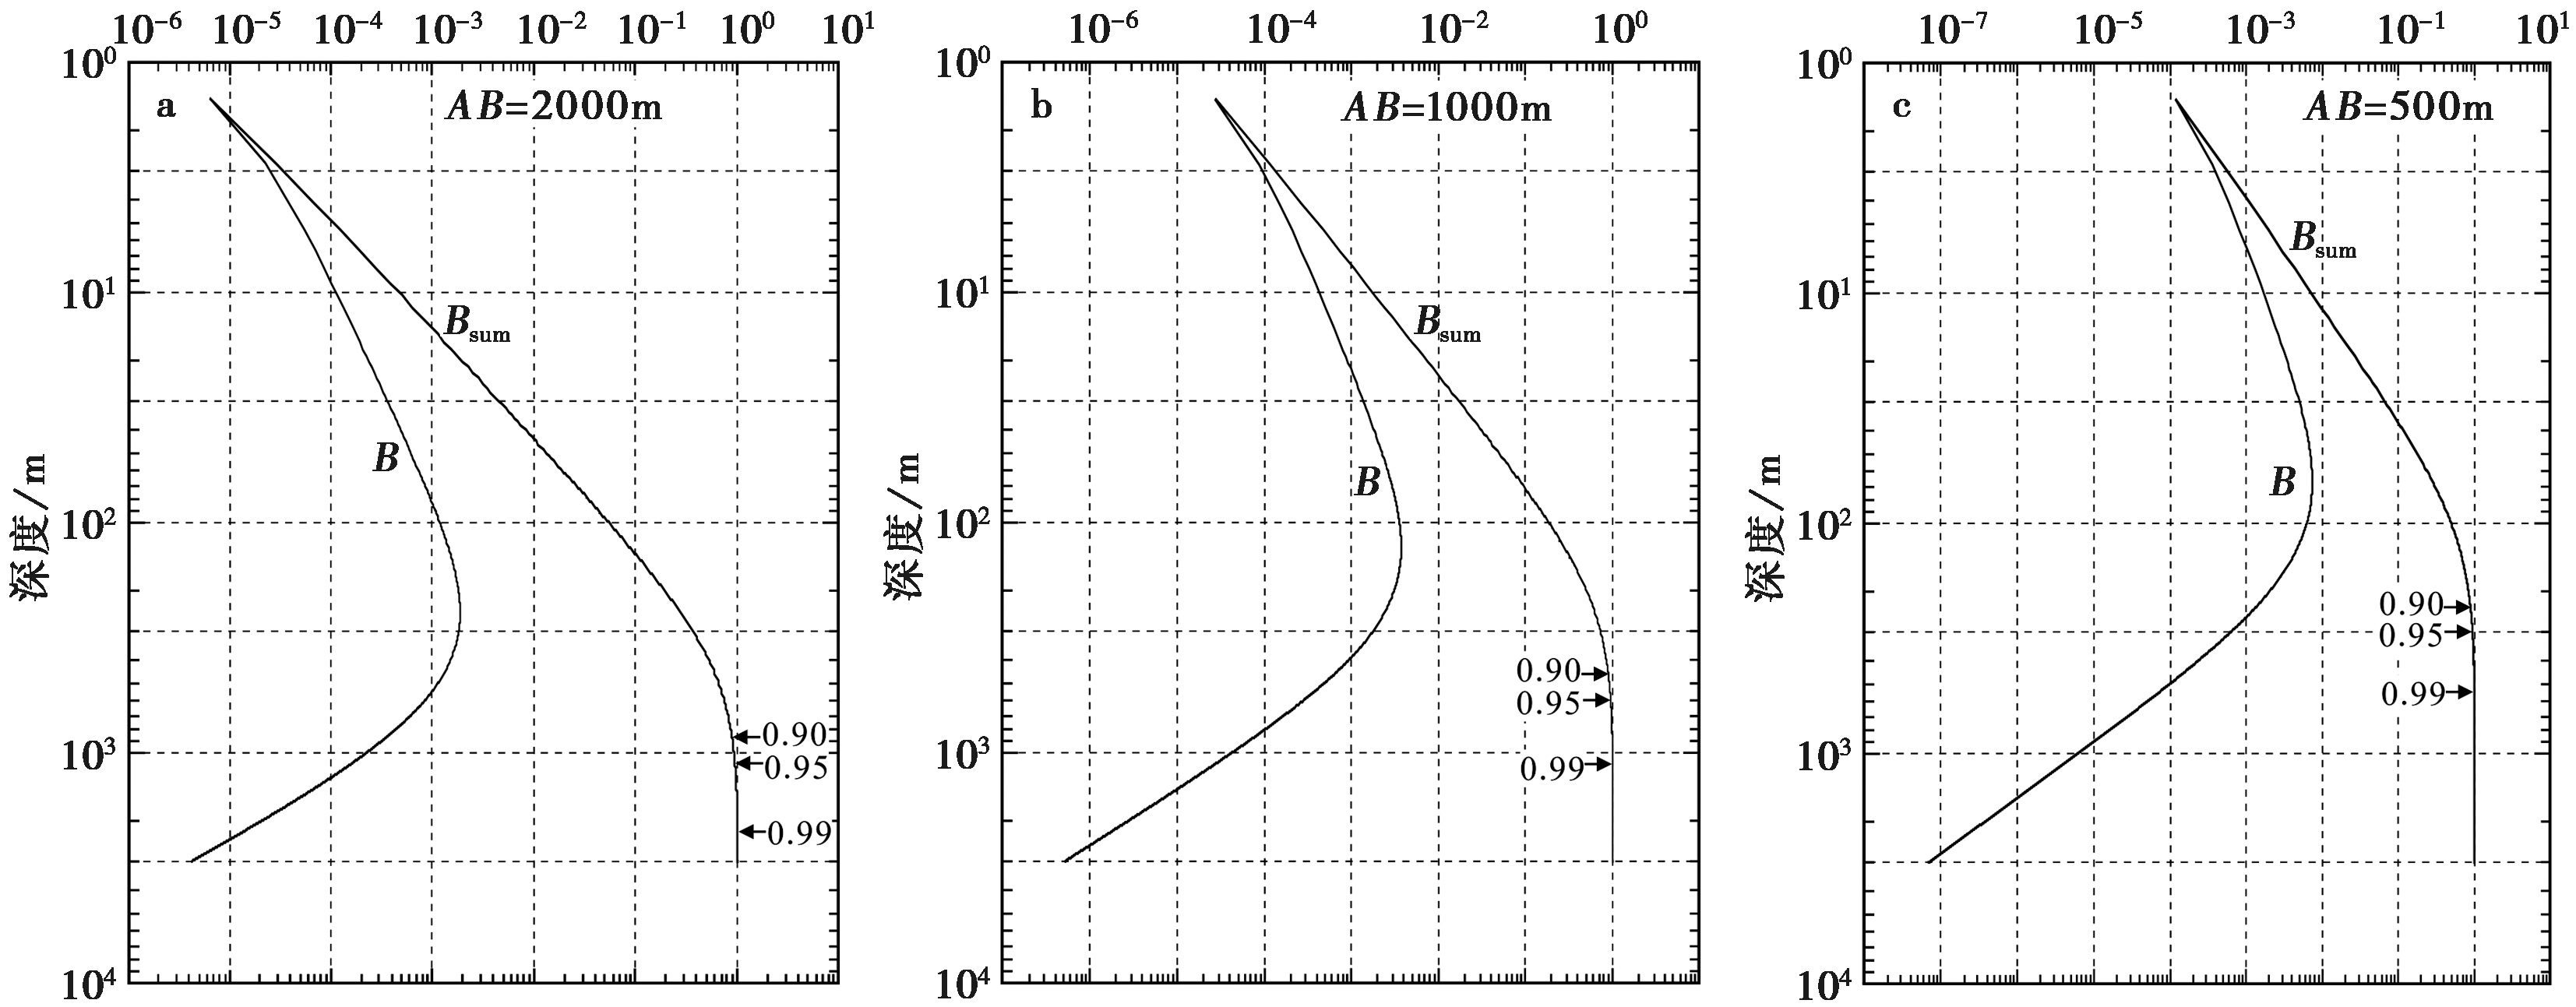
Fig. 5 The sensitivity changes of apparent resistivity with depth.
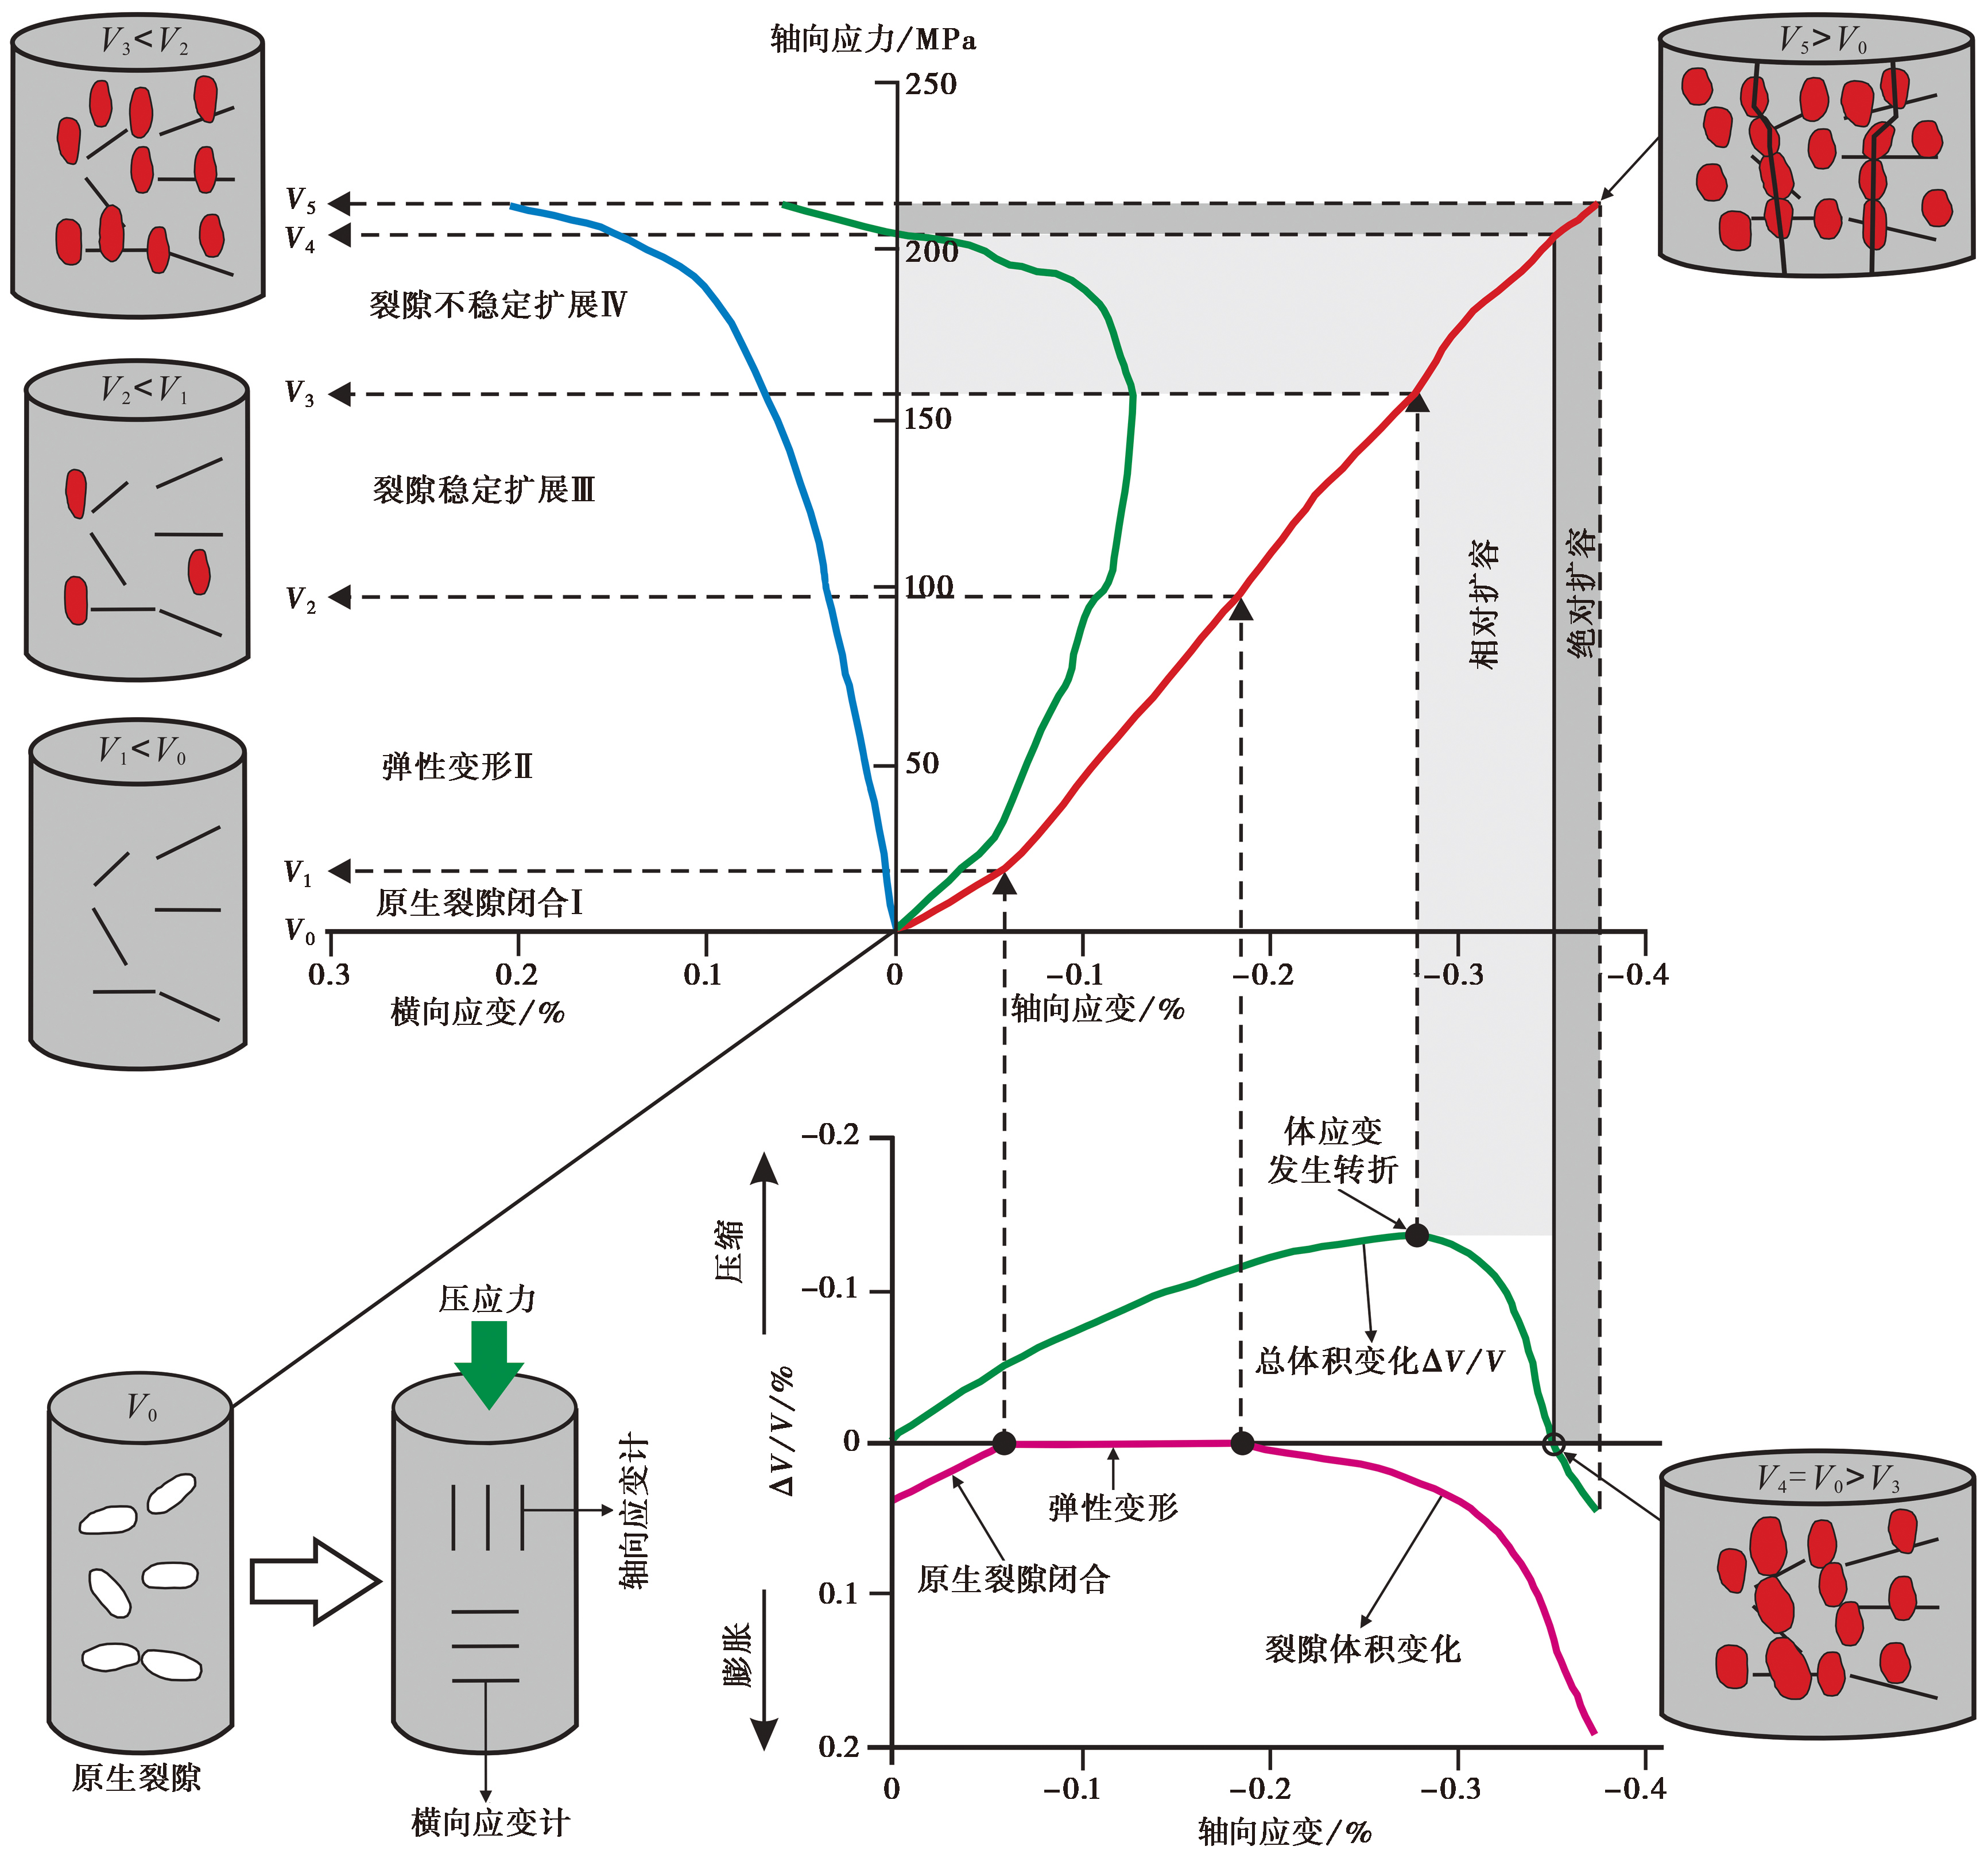
Fig. 6 Stress-strain diagram showing different stages of crack development during the uniaxial compression test(modified from Xue et al., 2014).
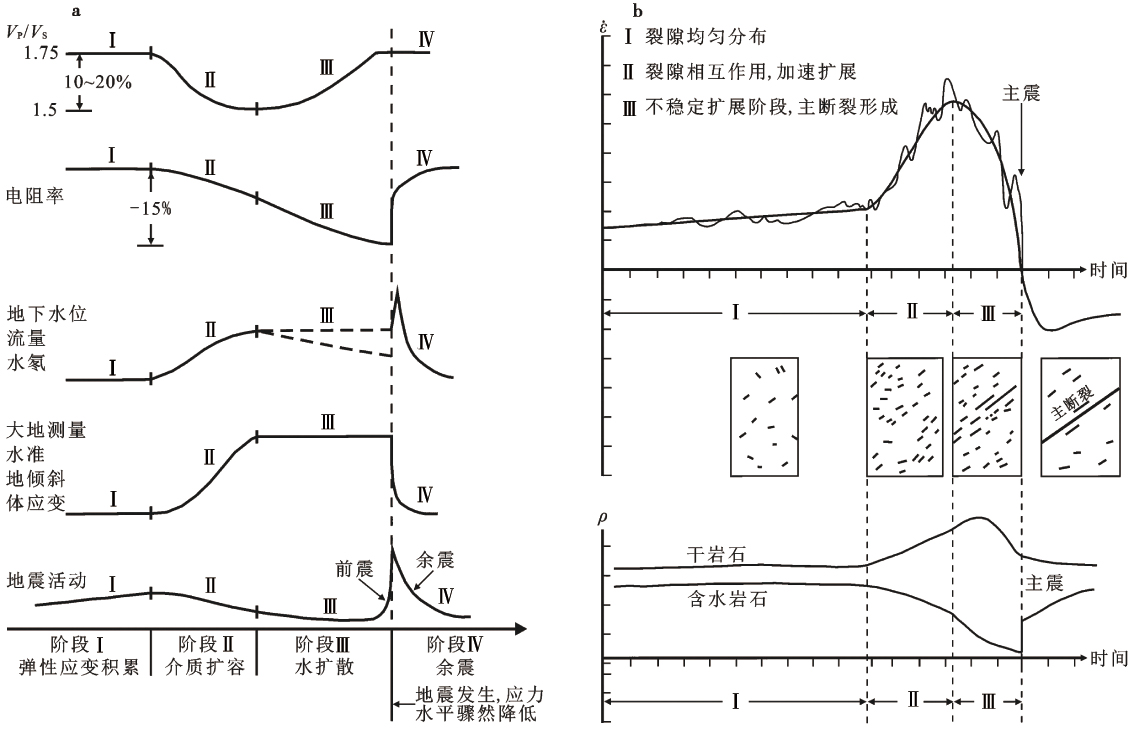
Fig. 7 Two physical models of earthquake precursor anomaly mechanism.
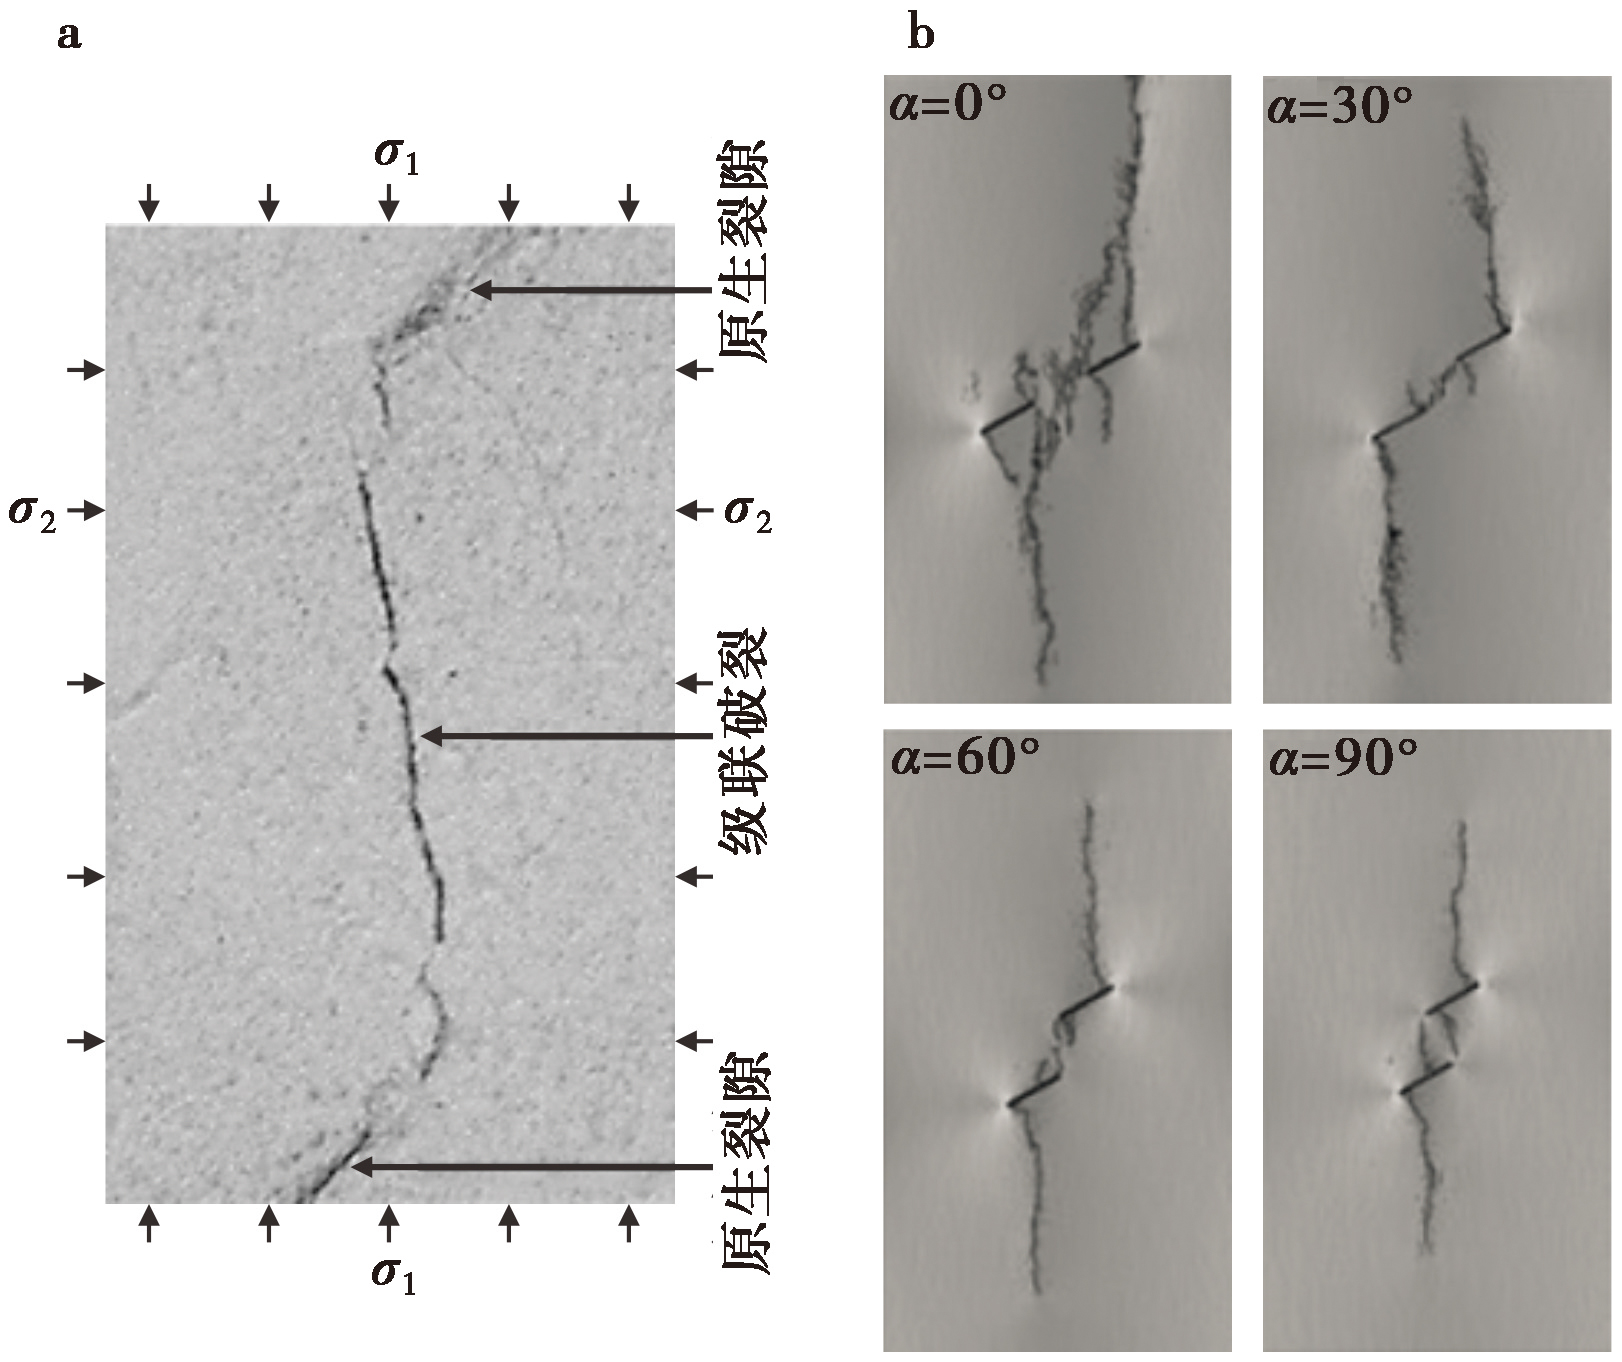
Fig. 8 Growth of new cracks in medium containing preexisting cracks under compressive stress loading with low confining pressure.
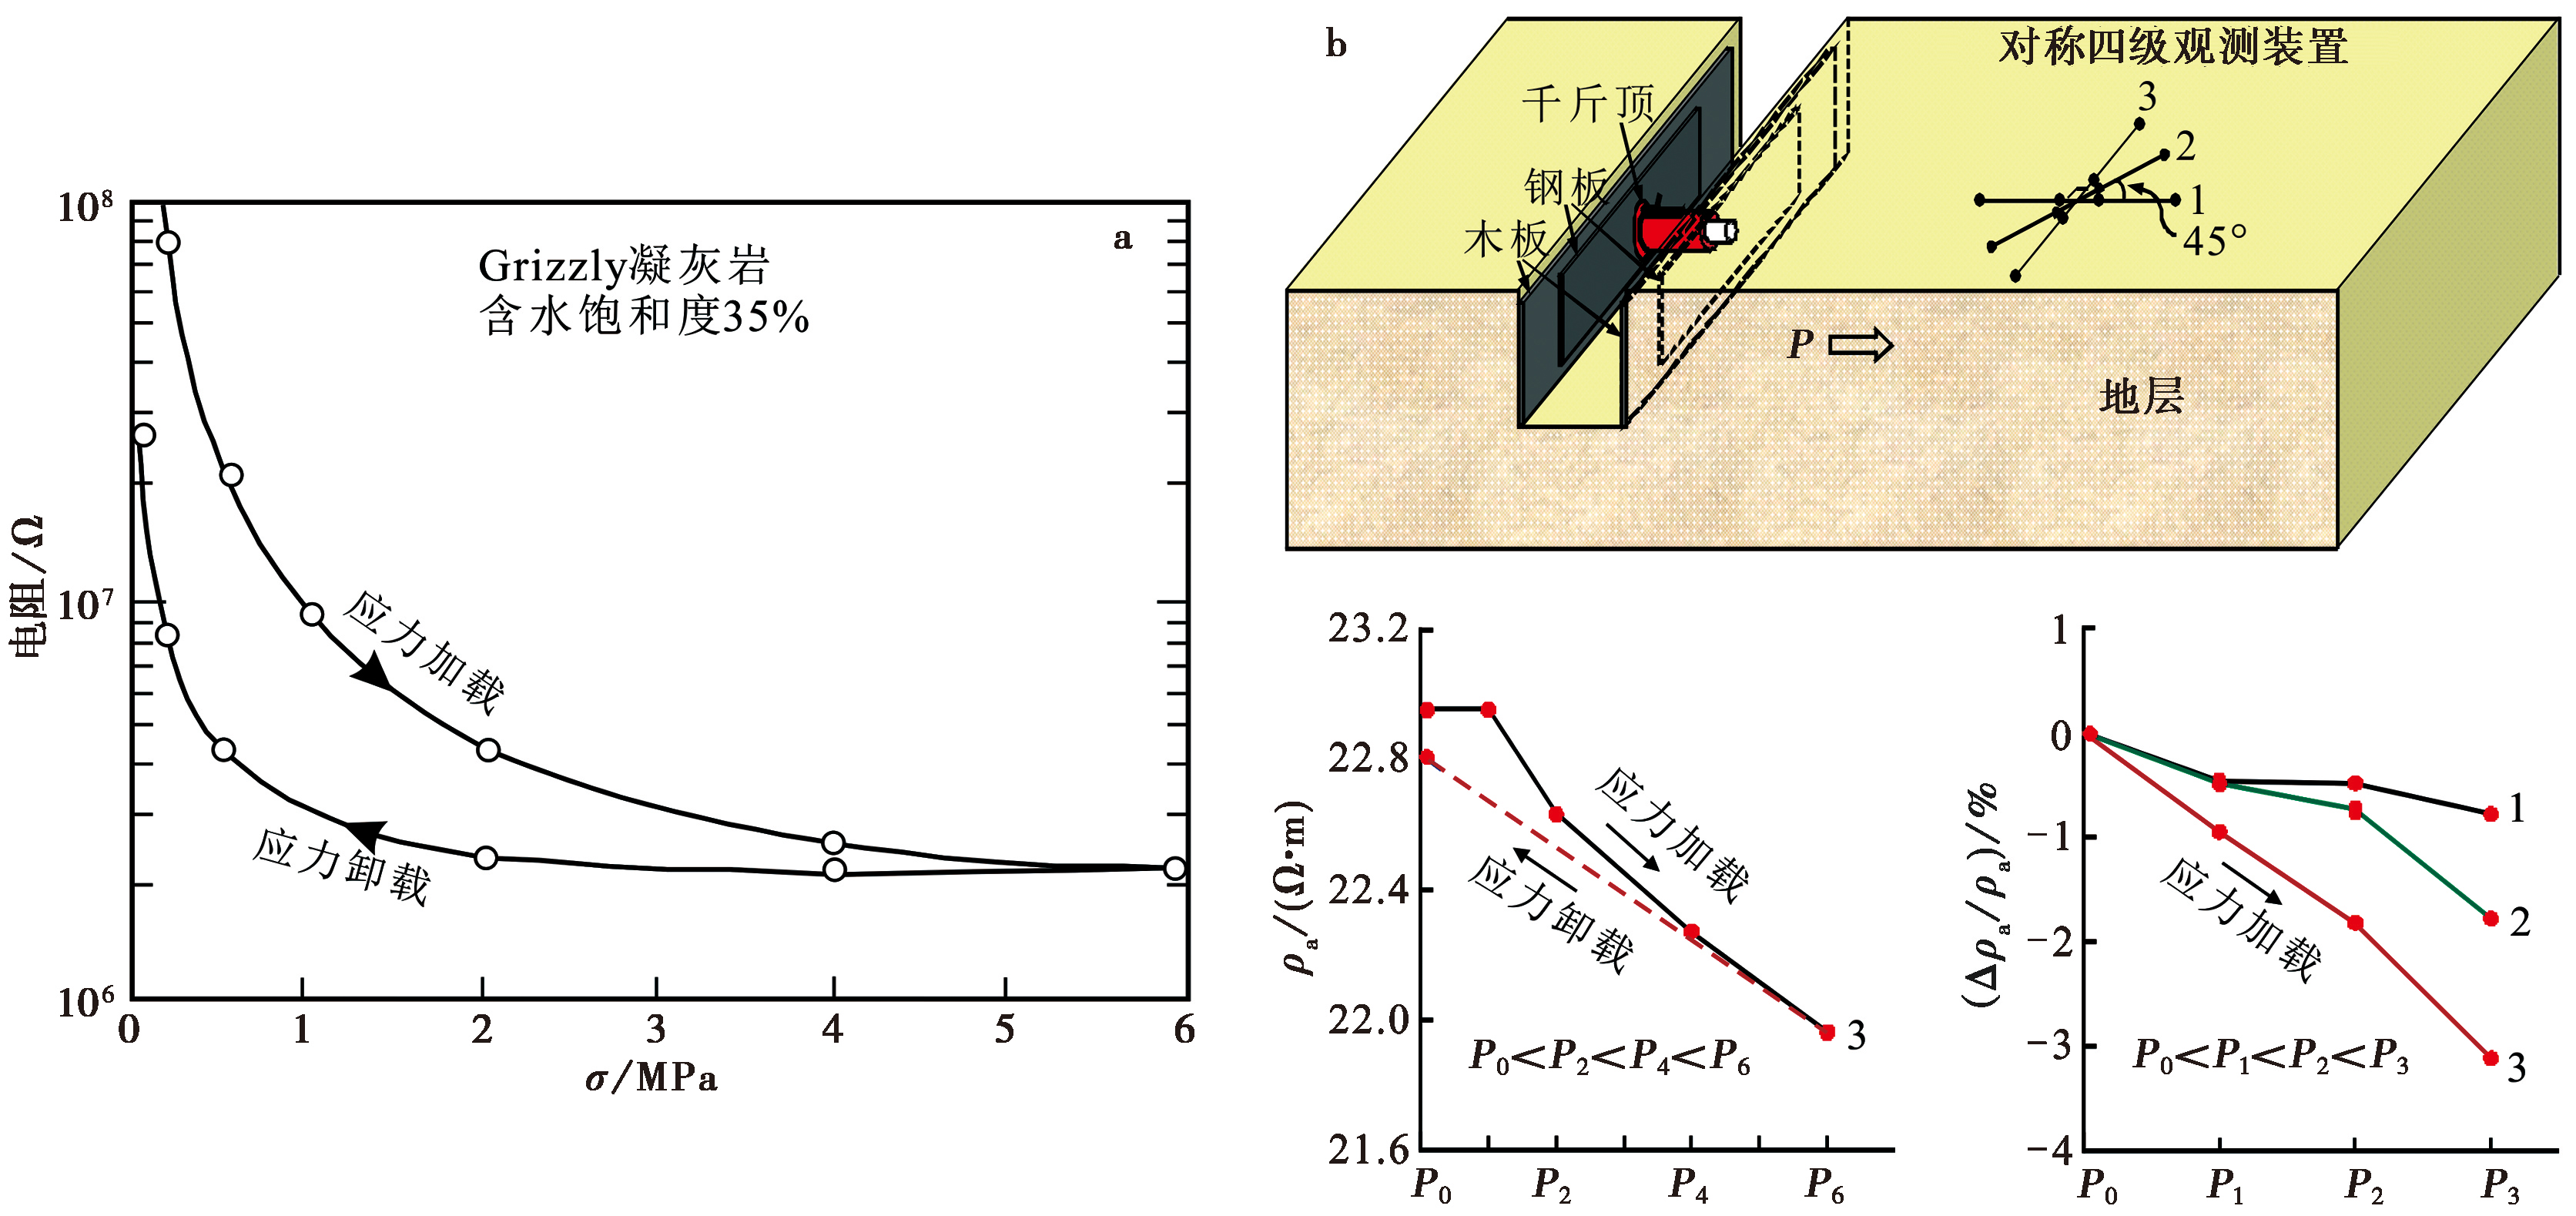
Fig. 9 Electrical resistivity changes under compressive stress.
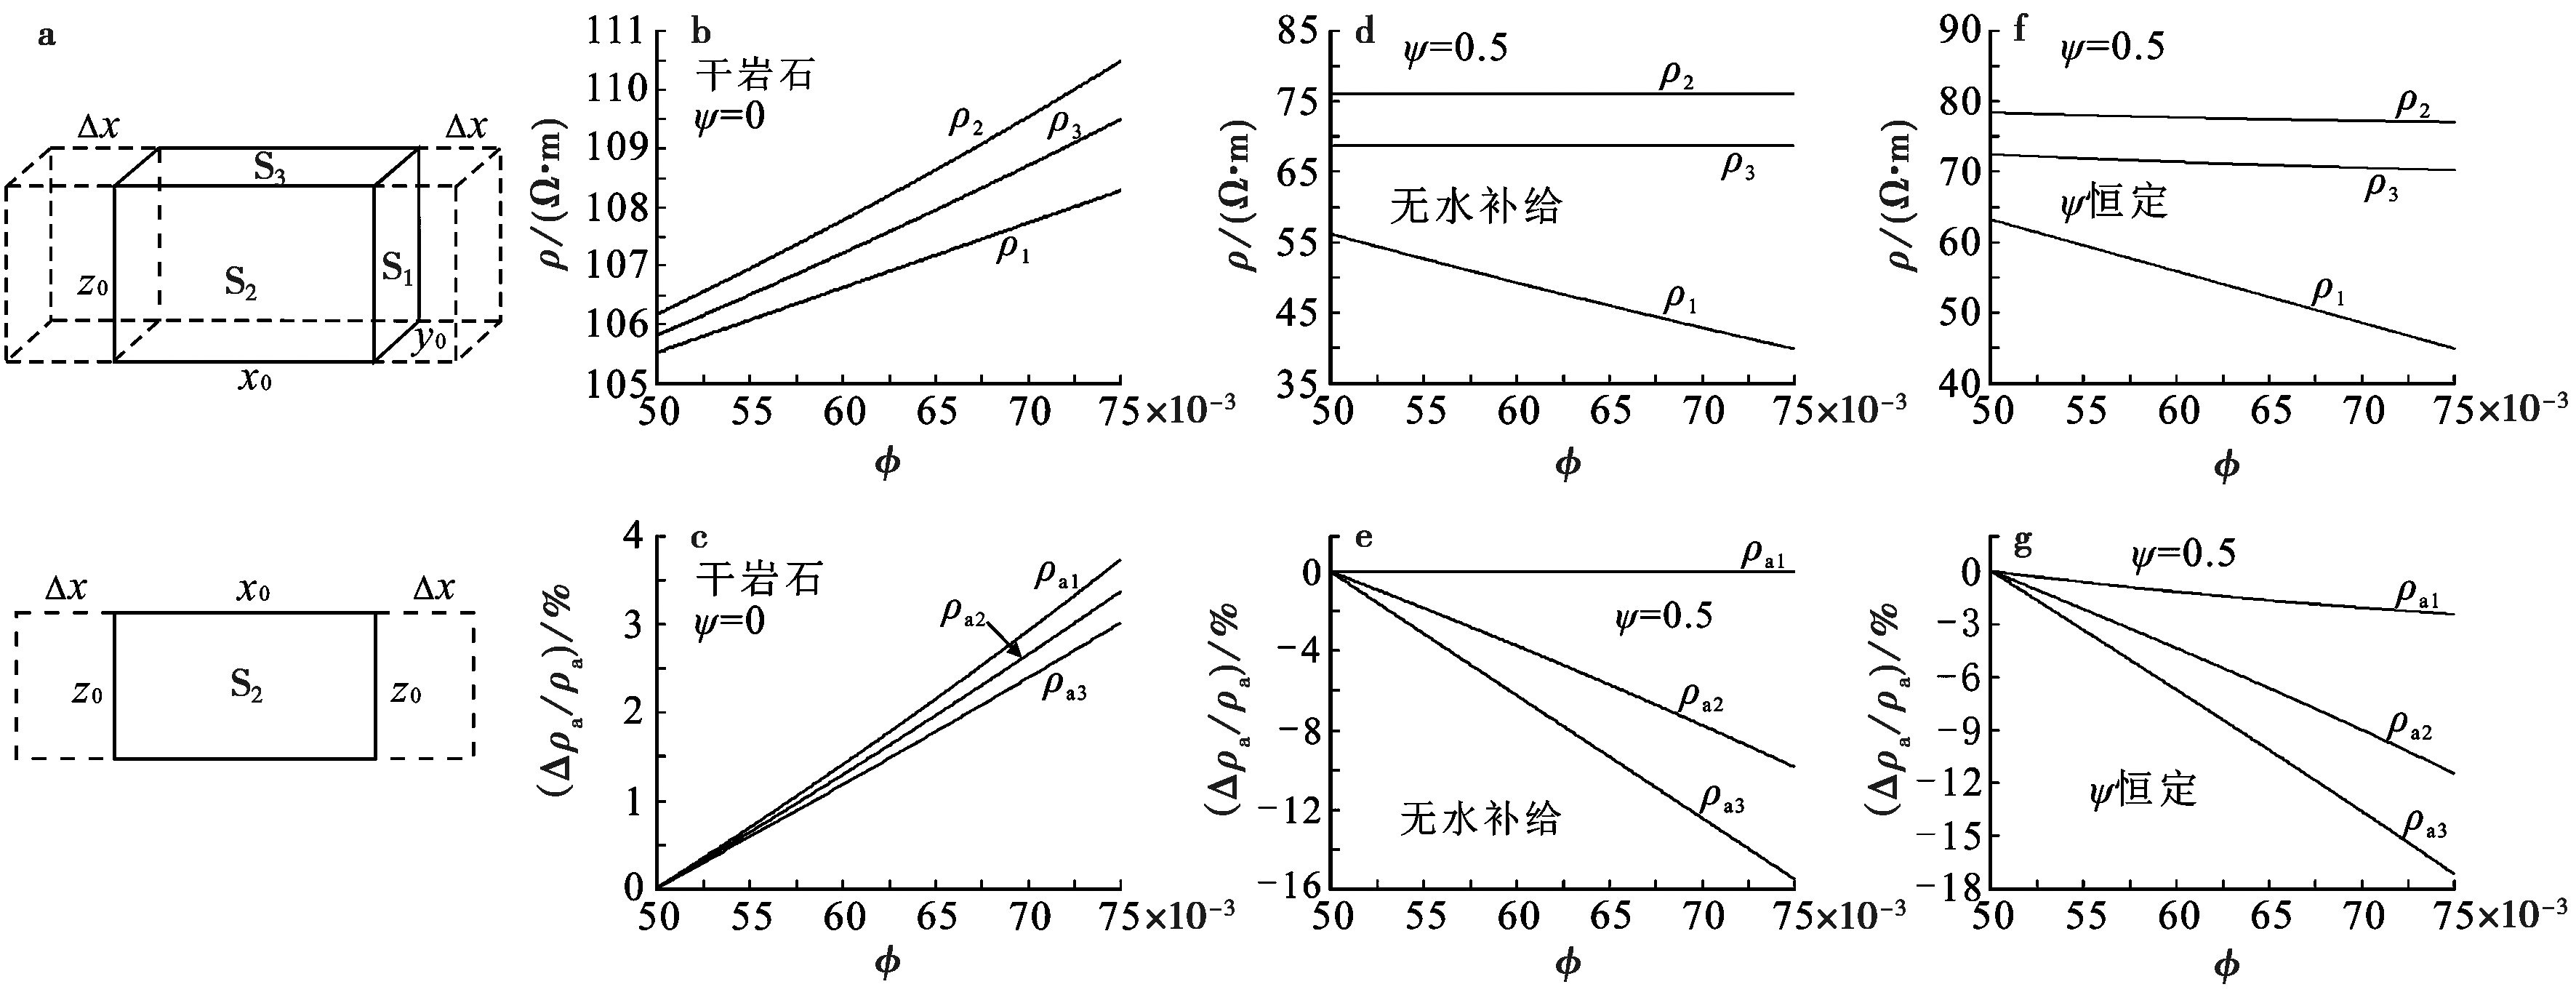
Fig. 10 Variations in medium and ground resistivity during fracture growth along the dominant orientation.
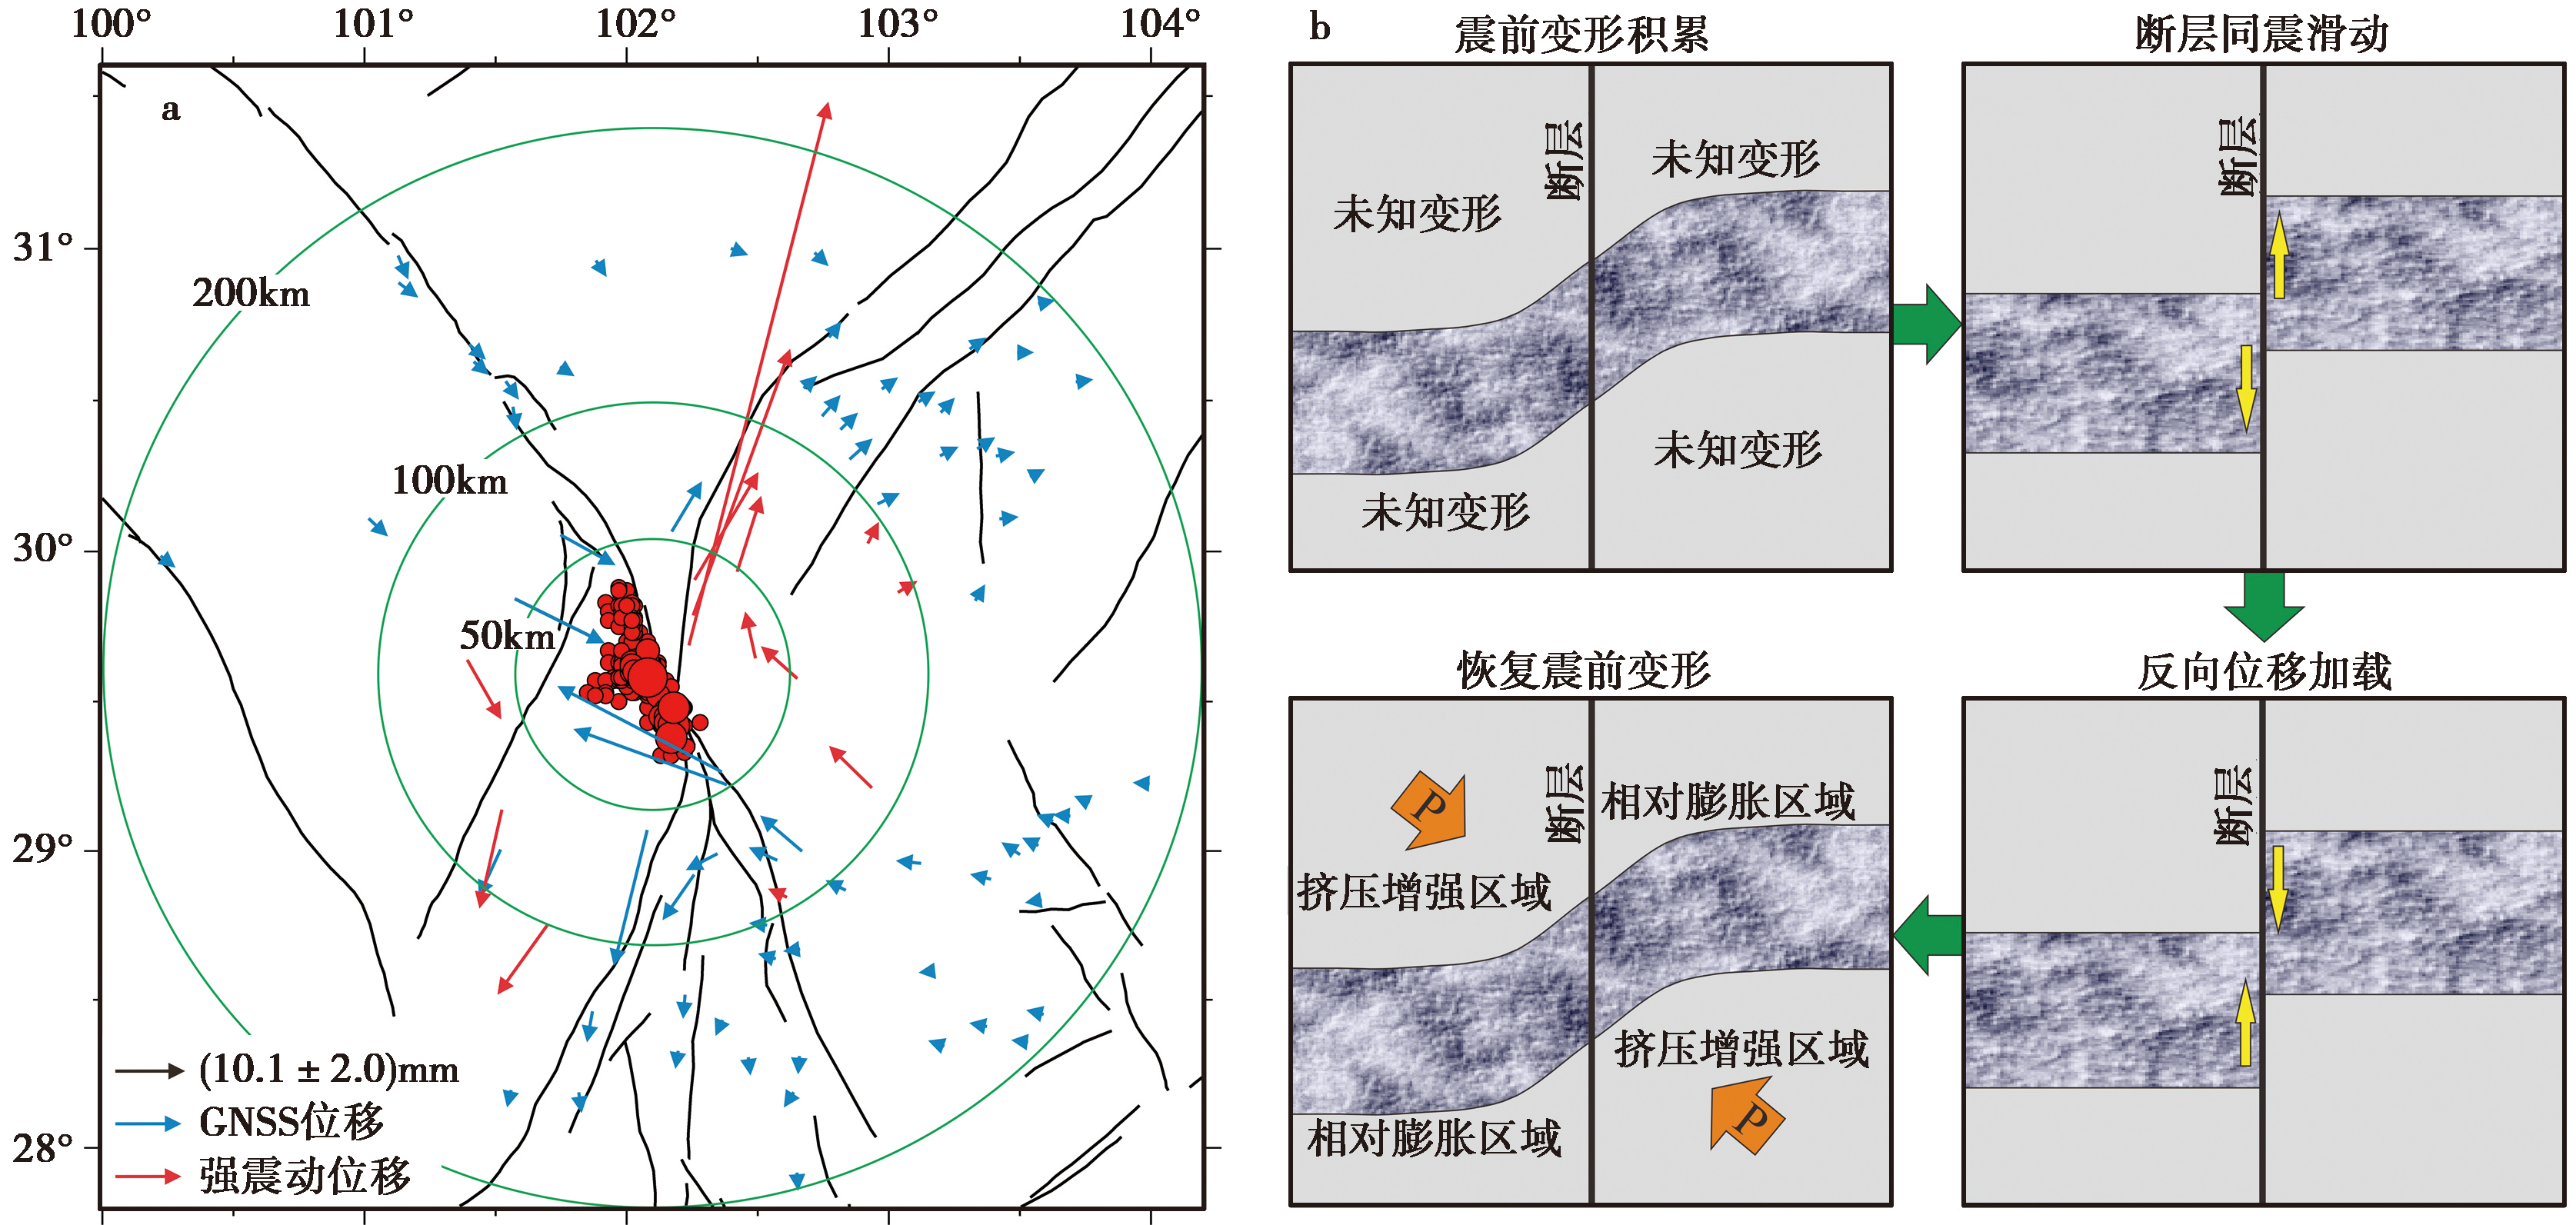
Fig. 11 Schematic diagram of virtual dislocation model of fault.
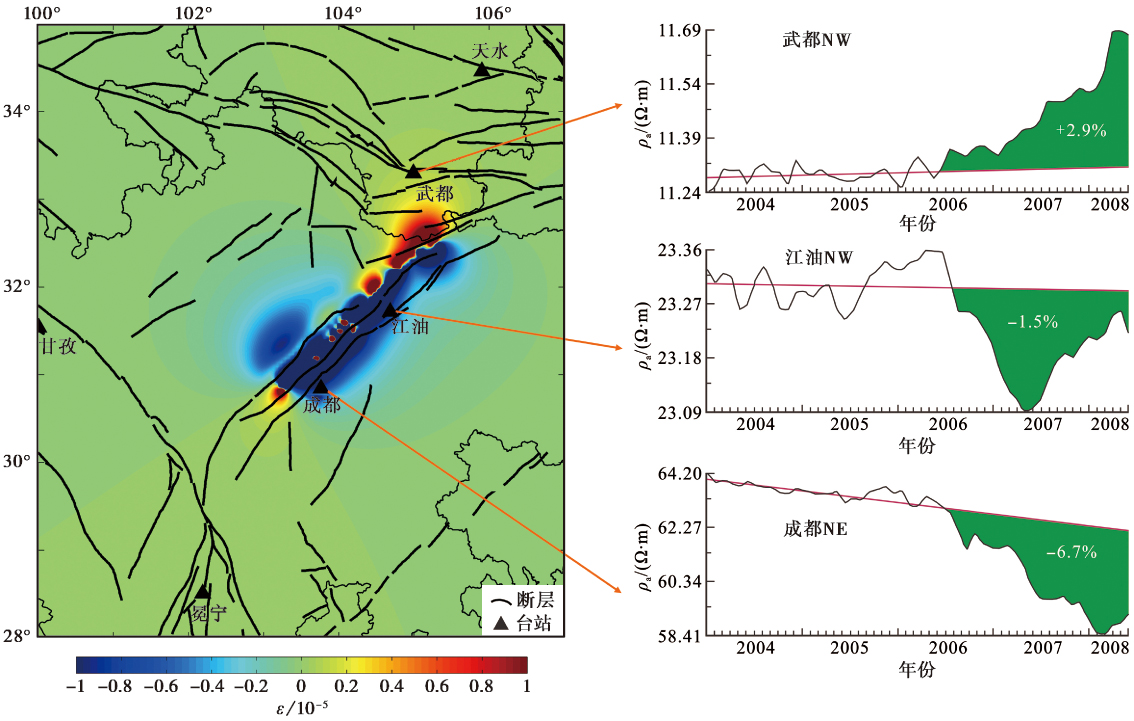
Fig. 12 Apparent resistivity anomalies before the 2008 Wenchuan MS8.0 earthquake (negative value refers compression).

Fig. 13 The 17 earthquakes with MS≥7.0 occurred within or near the apparent resistivity monitoring network China.
| 序号 | 日期 | 地点 | MS | 观测站 | D/km | 测道 | RC/% | T/月 | θ/(°) | 参考文献 |
|---|---|---|---|---|---|---|---|---|---|---|
| 1 | 1969-07-18 | 渤海 | 7.4 | 隆尧 | 418 | NS | -3.2 | 10 | 66 | 汪志亮等, |
| EW | -2.0 | 10 | 24 | |||||||
| 牛家桥 | 405 | NS | -1.5 | 8 | 66 | |||||
| EW | 24 | |||||||||
| 大曹庄 | 400 | NS | -1.5 | 6 | 66 | |||||
| EW | 24 | |||||||||
| 2 | 1973-02-06 | 炉霍 | 7.6 | 甘孜 | 45 | N30°E | -7.0 | 3 | 50 | 钱复业等, |
| N60°W | -4.5 | 3 | 40 | |||||||
| 雅安 | 300 | N30°E | -4.5 | 4 | 50 | |||||
| EW | 10 | |||||||||
| 松潘 | 320 | NS | -2.0 | 7 | 80 | |||||
| EW | 10 | |||||||||
| 康定 | 220 | NS | +2.0 | 6 | 80 | |||||
| EW | 10 | |||||||||
| 3 | 1974-05-11 | 大关 | 7.1 | 西昌 | 180 | NS | -5.2 | 11 | 88 | 汪志亮等, |
| EW | -1.3 | 11 | 2 | |||||||
| 米易 | 245 | NS | -3.5 | 11 | 88 | |||||
| EW | -1.3 | 11 | 2 | |||||||
| 会理 | 240 | NS | +1.5 | 15 | 88 | |||||
| EW | +2.9 | 15 | 2 | |||||||
| 4 | 1975-02-04 | 海城 | 7.3 | 台安 | 90 | N51°W | +9.0 | 10 | 73 | 汪志亮等, |
| N39°E | 27 | |||||||||
| 昌黎 | 310 | NS | -2.0 | 9 | 66 | |||||
| EW | -2.0 | 9 | 24 | |||||||
| 5 | 1976-05-29 | 龙陵 | 7.4 7.3 | 腾冲 | 54 | N73°E | -10.5 | 25 | 68 | 钱家栋等, |
| N17°W | -3.7 | 25 | 34 | |||||||
| 楚雄 | 292 | N75°E | +7.5 | 12 | 54 | 汪志亮等, | ||||
| N60°W | 21 | |||||||||
| 6 | 1976-07-28 | 唐山 滦县 | 7.8 7.1 | 唐山 | 5 | NS | -5.5 | 18 | 78 | 国家地震局预测预防司, |
| EW | -3.0 | 18 | 12 | |||||||
| 昌黎 | 35 | NS | -6.4 | 13 | 75 | |||||
| EW | -6.0 | 13 | 15 | |||||||
| 宝坻 | 80 | NS | -3.0 | 16 | 78 | |||||
| EW | -2.2 | 16 | 12 | |||||||
| 青光 | 110 | NS | -3.1 | 12 | 78 | |||||
| EW | -2.7 | 12 | 12 | |||||||
| 忠兴庄 | 150 | N40°E | -4.5 | 19 | 38 | |||||
| N48°W | -5.0 | 19 | 54 | |||||||
| 马家沟 | 10 | N25°W | -17.6 | 2 | 77 | |||||
| N69°E | -15.0 | 2 | 9 | |||||||
| 八里桥 | 140 | NS | -4.7 | 17 | 78 | |||||
| EW | 12 | |||||||||
| 西集 | 120 | NS | -3.3 | 17 | 78 | |||||
| EW | 12 | |||||||||
| 徐庄子 | 140 | NS | +2.6 | 9 | 78 | |||||
| EW | +1.9 | 9 | 12 | |||||||
| 青县 | 160 | NS | -2.0 | 2d | 78 | |||||
| EW | 12 | |||||||||
| 小汤山 | 170 | N50°W | -5.0 | 9 | 52 | |||||
| N40°E | 38 | |||||||||
| 7 | 1976-08-16 1976-08-23 | 松潘 平武 | 7.2 7.2 | 武都 | 100 | N85°E | -2.0 | 19 | 22 | 钱复业等, |
| N45°W | -4.0 | 19 | 72 | |||||||
| N72°W | -3.4 | 19 | 45 | |||||||
| 松潘 | 70 | NS | -2.0 | 14 | 85 | |||||
| EW | 5 | |||||||||
| 8 | 1988-11-06 | 澜沧 耿马 | 7.6 7.2 | 腾冲 | 215 | EW | -5.0 | 20 | 80 | 汪志亮等, |
| NS | 10 | |||||||||
| 9 | 1990-04-26 | 共和 | 7.0 | 武威 | 282 | EW | +7.1 | 8 | 36 | 张肇诚等, |
| NS | 54 | |||||||||
| 10 | 1996-02-03 | 丽江 | 7.0 | 冕宁 | 237 | N5°E | -2.3 | 11 | 2 | |
| N45°W | -4.4 | 6 | 48 | |||||||
| N85°W | 88 | |||||||||
| 11 | 2008-05-12 | 汶川 | 8.0 | 成都 | 35 | N58°E | -6.7 | 22 | 61 | 杜学彬, |
| N49°W | 12 | |||||||||
| 江油 | 30 | N70°W | -1.5 | 22 | 65 | |||||
| N10°E | 15 | |||||||||
| 甘孜 | 330 | N30°E | -5.3 | 22 | 83 | |||||
| N60°W | -4.9 | 22 | 7 | |||||||
| 武都 | 110 | N54°W | +2.9 | 22 | 41 | |||||
| N73°W | 22 | |||||||||
| N85°E | 0 | |||||||||
| 12 | 2013-04-20 | 芦山 | 7.0 | 成都 | 99 | N58°E | -6.2 | 9 | 58 | 杜学彬等, |
| N49°W | 15 | |||||||||
| 13 | 2017-08-08 | 九寨沟 | 7.0 | 天水 | 240 | N56°E | 0.4 | 5 | 49 | 高曙德, |
| N24°W | 0.4 | 5 | 51 | |||||||
| N75°W | 0.3 | 5 | 0 | |||||||
| 玛曲 | 195 | N34°E | -2.3 | 6 | 71 | |||||
| N68°W | -1.5 | 6 | 7 | |||||||
| 武都 | 110 | 垂直Ⅰ | +1.5 | 9 | ||||||
| 垂直Ⅱ | +1.5 | 9 | ||||||||
| 14 | 2024-01-23 | 乌什 | 7.1 | 柯坪 | 90 | NS | 0.5 | 10 | 40 | 解滔等, |
| EW | 0.6 | 10 | 50 | 李新艳等, |
Table3 The relationship between apparent resistivity anomalies and P-axis before the 14 earthquakes with MS≥7.0 in China
| 序号 | 日期 | 地点 | MS | 观测站 | D/km | 测道 | RC/% | T/月 | θ/(°) | 参考文献 |
|---|---|---|---|---|---|---|---|---|---|---|
| 1 | 1969-07-18 | 渤海 | 7.4 | 隆尧 | 418 | NS | -3.2 | 10 | 66 | 汪志亮等, |
| EW | -2.0 | 10 | 24 | |||||||
| 牛家桥 | 405 | NS | -1.5 | 8 | 66 | |||||
| EW | 24 | |||||||||
| 大曹庄 | 400 | NS | -1.5 | 6 | 66 | |||||
| EW | 24 | |||||||||
| 2 | 1973-02-06 | 炉霍 | 7.6 | 甘孜 | 45 | N30°E | -7.0 | 3 | 50 | 钱复业等, |
| N60°W | -4.5 | 3 | 40 | |||||||
| 雅安 | 300 | N30°E | -4.5 | 4 | 50 | |||||
| EW | 10 | |||||||||
| 松潘 | 320 | NS | -2.0 | 7 | 80 | |||||
| EW | 10 | |||||||||
| 康定 | 220 | NS | +2.0 | 6 | 80 | |||||
| EW | 10 | |||||||||
| 3 | 1974-05-11 | 大关 | 7.1 | 西昌 | 180 | NS | -5.2 | 11 | 88 | 汪志亮等, |
| EW | -1.3 | 11 | 2 | |||||||
| 米易 | 245 | NS | -3.5 | 11 | 88 | |||||
| EW | -1.3 | 11 | 2 | |||||||
| 会理 | 240 | NS | +1.5 | 15 | 88 | |||||
| EW | +2.9 | 15 | 2 | |||||||
| 4 | 1975-02-04 | 海城 | 7.3 | 台安 | 90 | N51°W | +9.0 | 10 | 73 | 汪志亮等, |
| N39°E | 27 | |||||||||
| 昌黎 | 310 | NS | -2.0 | 9 | 66 | |||||
| EW | -2.0 | 9 | 24 | |||||||
| 5 | 1976-05-29 | 龙陵 | 7.4 7.3 | 腾冲 | 54 | N73°E | -10.5 | 25 | 68 | 钱家栋等, |
| N17°W | -3.7 | 25 | 34 | |||||||
| 楚雄 | 292 | N75°E | +7.5 | 12 | 54 | 汪志亮等, | ||||
| N60°W | 21 | |||||||||
| 6 | 1976-07-28 | 唐山 滦县 | 7.8 7.1 | 唐山 | 5 | NS | -5.5 | 18 | 78 | 国家地震局预测预防司, |
| EW | -3.0 | 18 | 12 | |||||||
| 昌黎 | 35 | NS | -6.4 | 13 | 75 | |||||
| EW | -6.0 | 13 | 15 | |||||||
| 宝坻 | 80 | NS | -3.0 | 16 | 78 | |||||
| EW | -2.2 | 16 | 12 | |||||||
| 青光 | 110 | NS | -3.1 | 12 | 78 | |||||
| EW | -2.7 | 12 | 12 | |||||||
| 忠兴庄 | 150 | N40°E | -4.5 | 19 | 38 | |||||
| N48°W | -5.0 | 19 | 54 | |||||||
| 马家沟 | 10 | N25°W | -17.6 | 2 | 77 | |||||
| N69°E | -15.0 | 2 | 9 | |||||||
| 八里桥 | 140 | NS | -4.7 | 17 | 78 | |||||
| EW | 12 | |||||||||
| 西集 | 120 | NS | -3.3 | 17 | 78 | |||||
| EW | 12 | |||||||||
| 徐庄子 | 140 | NS | +2.6 | 9 | 78 | |||||
| EW | +1.9 | 9 | 12 | |||||||
| 青县 | 160 | NS | -2.0 | 2d | 78 | |||||
| EW | 12 | |||||||||
| 小汤山 | 170 | N50°W | -5.0 | 9 | 52 | |||||
| N40°E | 38 | |||||||||
| 7 | 1976-08-16 1976-08-23 | 松潘 平武 | 7.2 7.2 | 武都 | 100 | N85°E | -2.0 | 19 | 22 | 钱复业等, |
| N45°W | -4.0 | 19 | 72 | |||||||
| N72°W | -3.4 | 19 | 45 | |||||||
| 松潘 | 70 | NS | -2.0 | 14 | 85 | |||||
| EW | 5 | |||||||||
| 8 | 1988-11-06 | 澜沧 耿马 | 7.6 7.2 | 腾冲 | 215 | EW | -5.0 | 20 | 80 | 汪志亮等, |
| NS | 10 | |||||||||
| 9 | 1990-04-26 | 共和 | 7.0 | 武威 | 282 | EW | +7.1 | 8 | 36 | 张肇诚等, |
| NS | 54 | |||||||||
| 10 | 1996-02-03 | 丽江 | 7.0 | 冕宁 | 237 | N5°E | -2.3 | 11 | 2 | |
| N45°W | -4.4 | 6 | 48 | |||||||
| N85°W | 88 | |||||||||
| 11 | 2008-05-12 | 汶川 | 8.0 | 成都 | 35 | N58°E | -6.7 | 22 | 61 | 杜学彬, |
| N49°W | 12 | |||||||||
| 江油 | 30 | N70°W | -1.5 | 22 | 65 | |||||
| N10°E | 15 | |||||||||
| 甘孜 | 330 | N30°E | -5.3 | 22 | 83 | |||||
| N60°W | -4.9 | 22 | 7 | |||||||
| 武都 | 110 | N54°W | +2.9 | 22 | 41 | |||||
| N73°W | 22 | |||||||||
| N85°E | 0 | |||||||||
| 12 | 2013-04-20 | 芦山 | 7.0 | 成都 | 99 | N58°E | -6.2 | 9 | 58 | 杜学彬等, |
| N49°W | 15 | |||||||||
| 13 | 2017-08-08 | 九寨沟 | 7.0 | 天水 | 240 | N56°E | 0.4 | 5 | 49 | 高曙德, |
| N24°W | 0.4 | 5 | 51 | |||||||
| N75°W | 0.3 | 5 | 0 | |||||||
| 玛曲 | 195 | N34°E | -2.3 | 6 | 71 | |||||
| N68°W | -1.5 | 6 | 7 | |||||||
| 武都 | 110 | 垂直Ⅰ | +1.5 | 9 | ||||||
| 垂直Ⅱ | +1.5 | 9 | ||||||||
| 14 | 2024-01-23 | 乌什 | 7.1 | 柯坪 | 90 | NS | 0.5 | 10 | 40 | 解滔等, |
| EW | 0.6 | 10 | 50 | 李新艳等, |
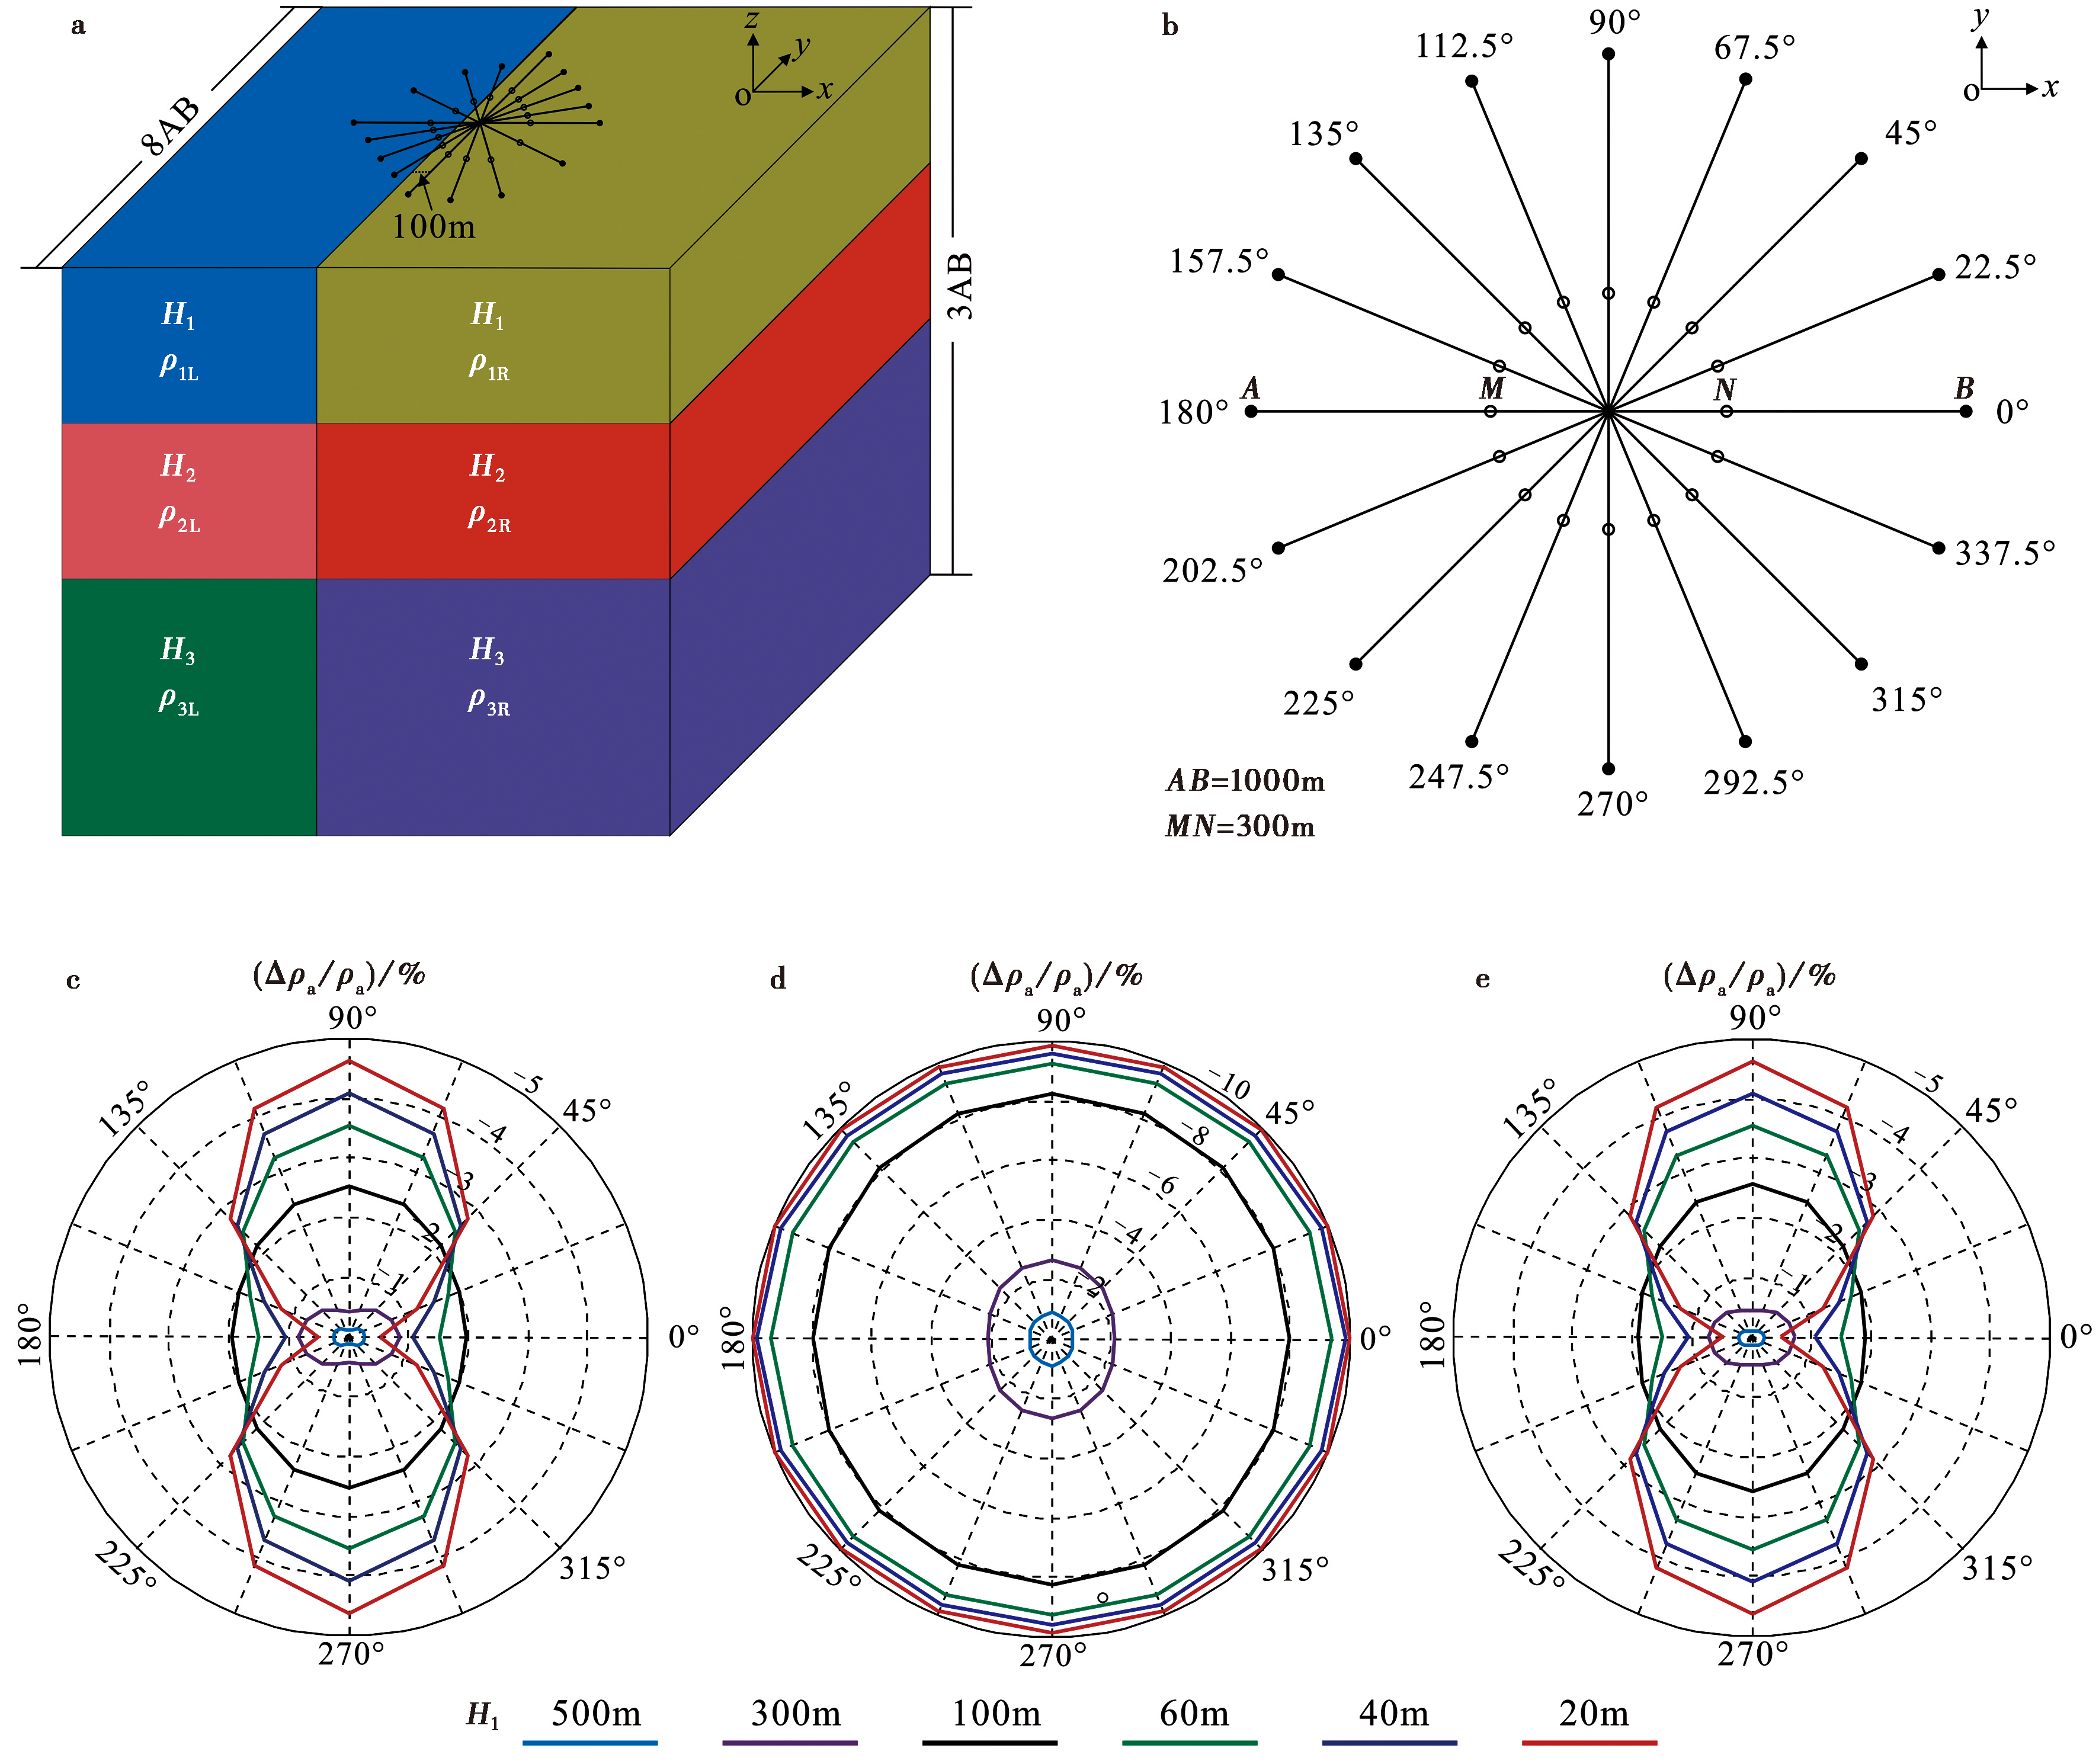
Fig. 14 Anisotropic changes in apparent resistivity of the lateral inhomogeneity model.
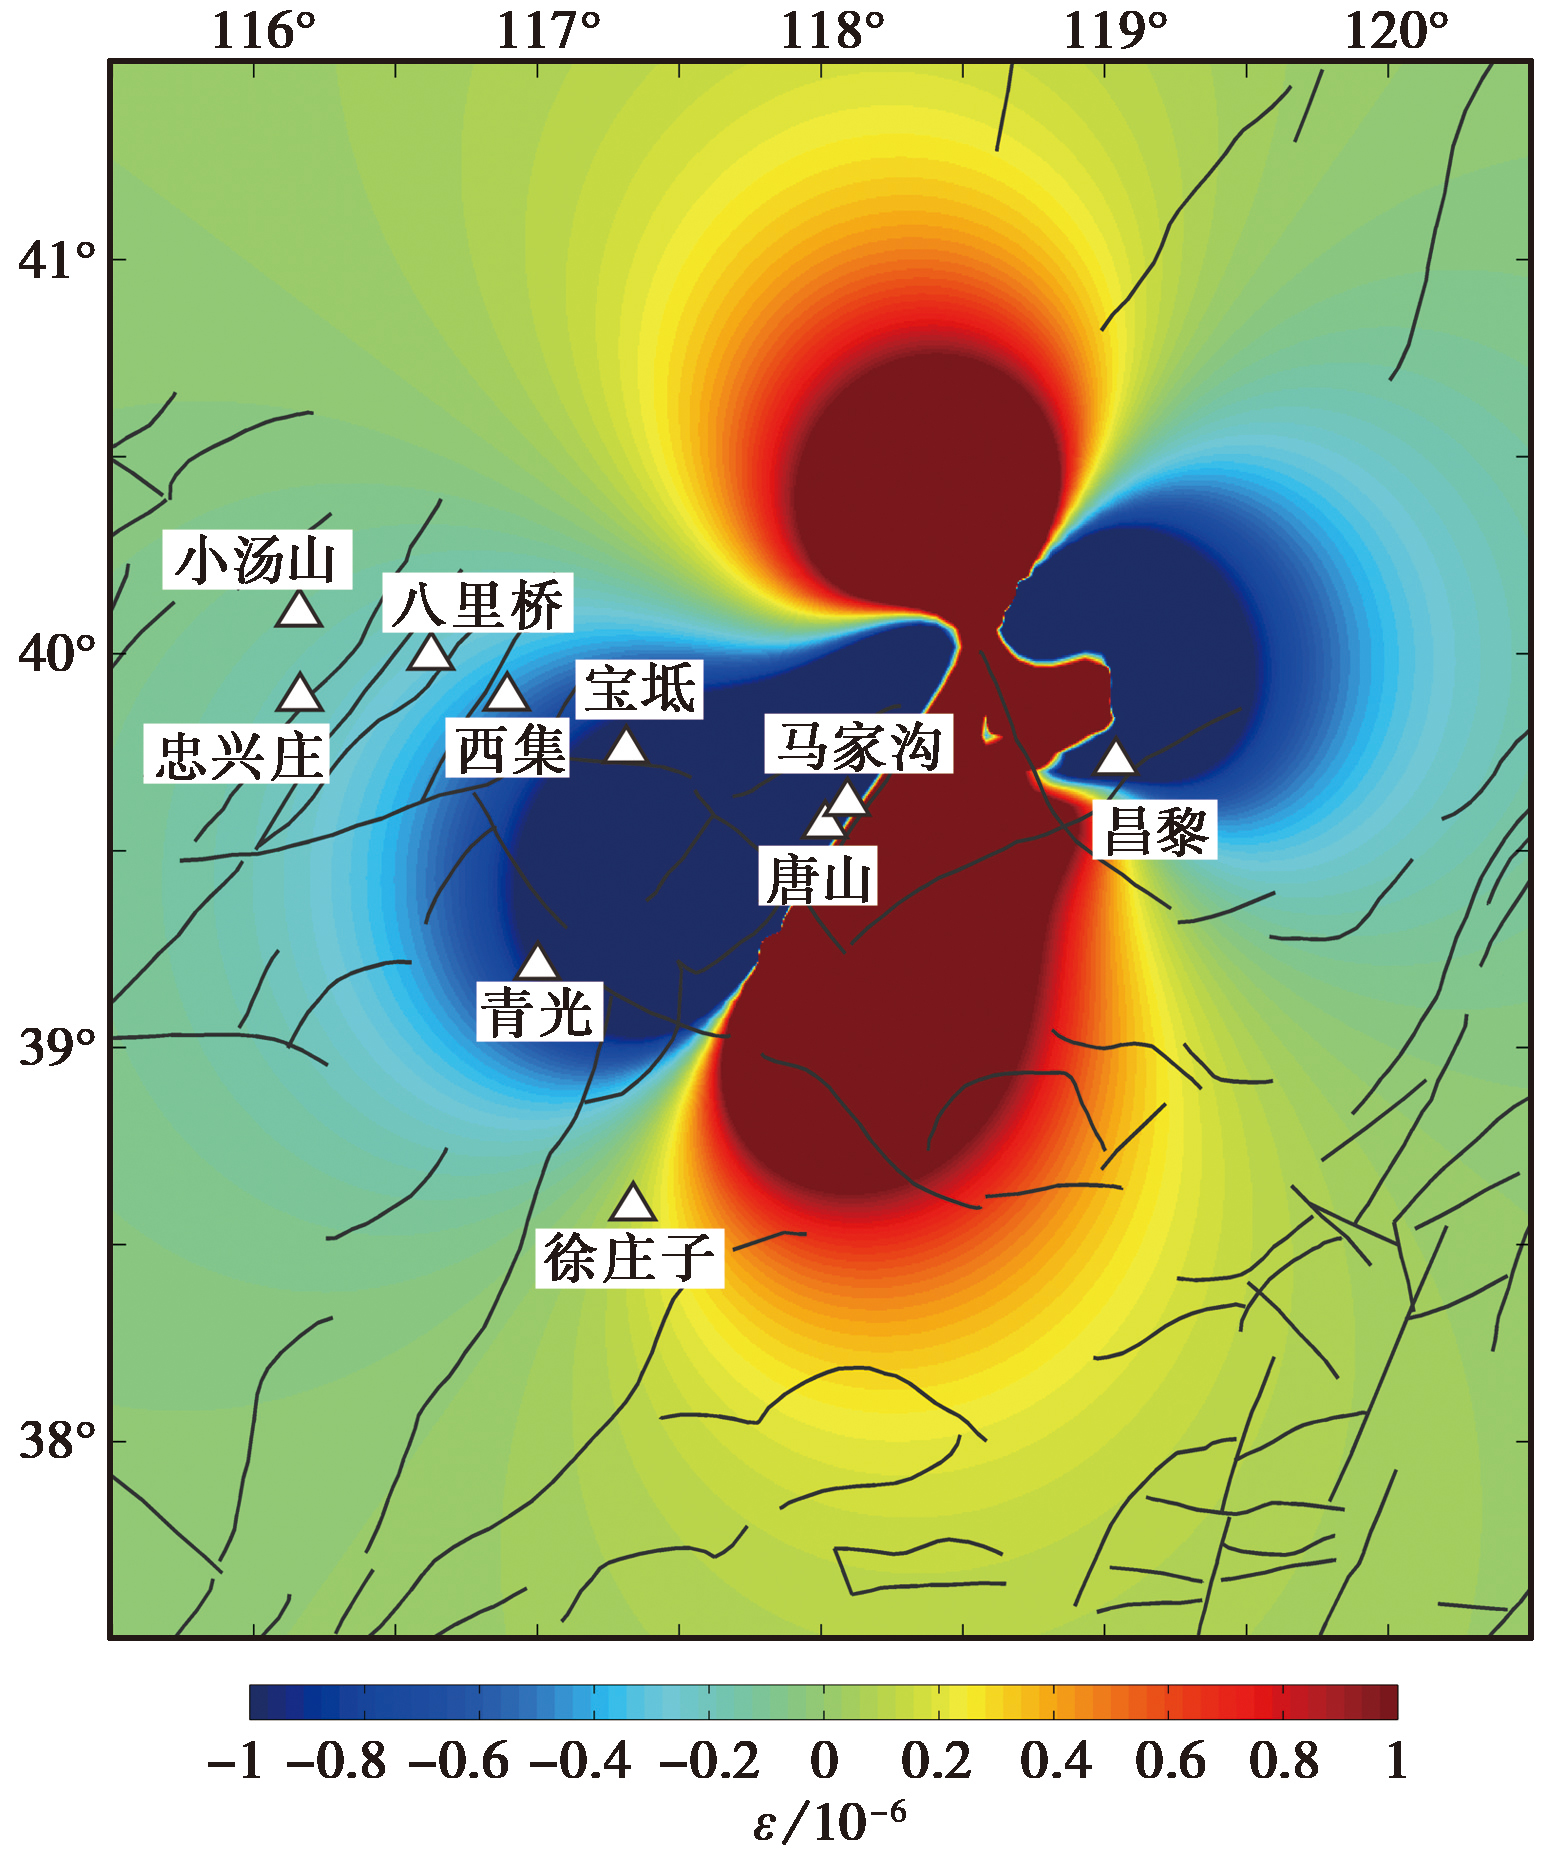
Fig. 15 Deformation based on fault virtual dislocation model before the Tangshan MS7.8 earthquake.
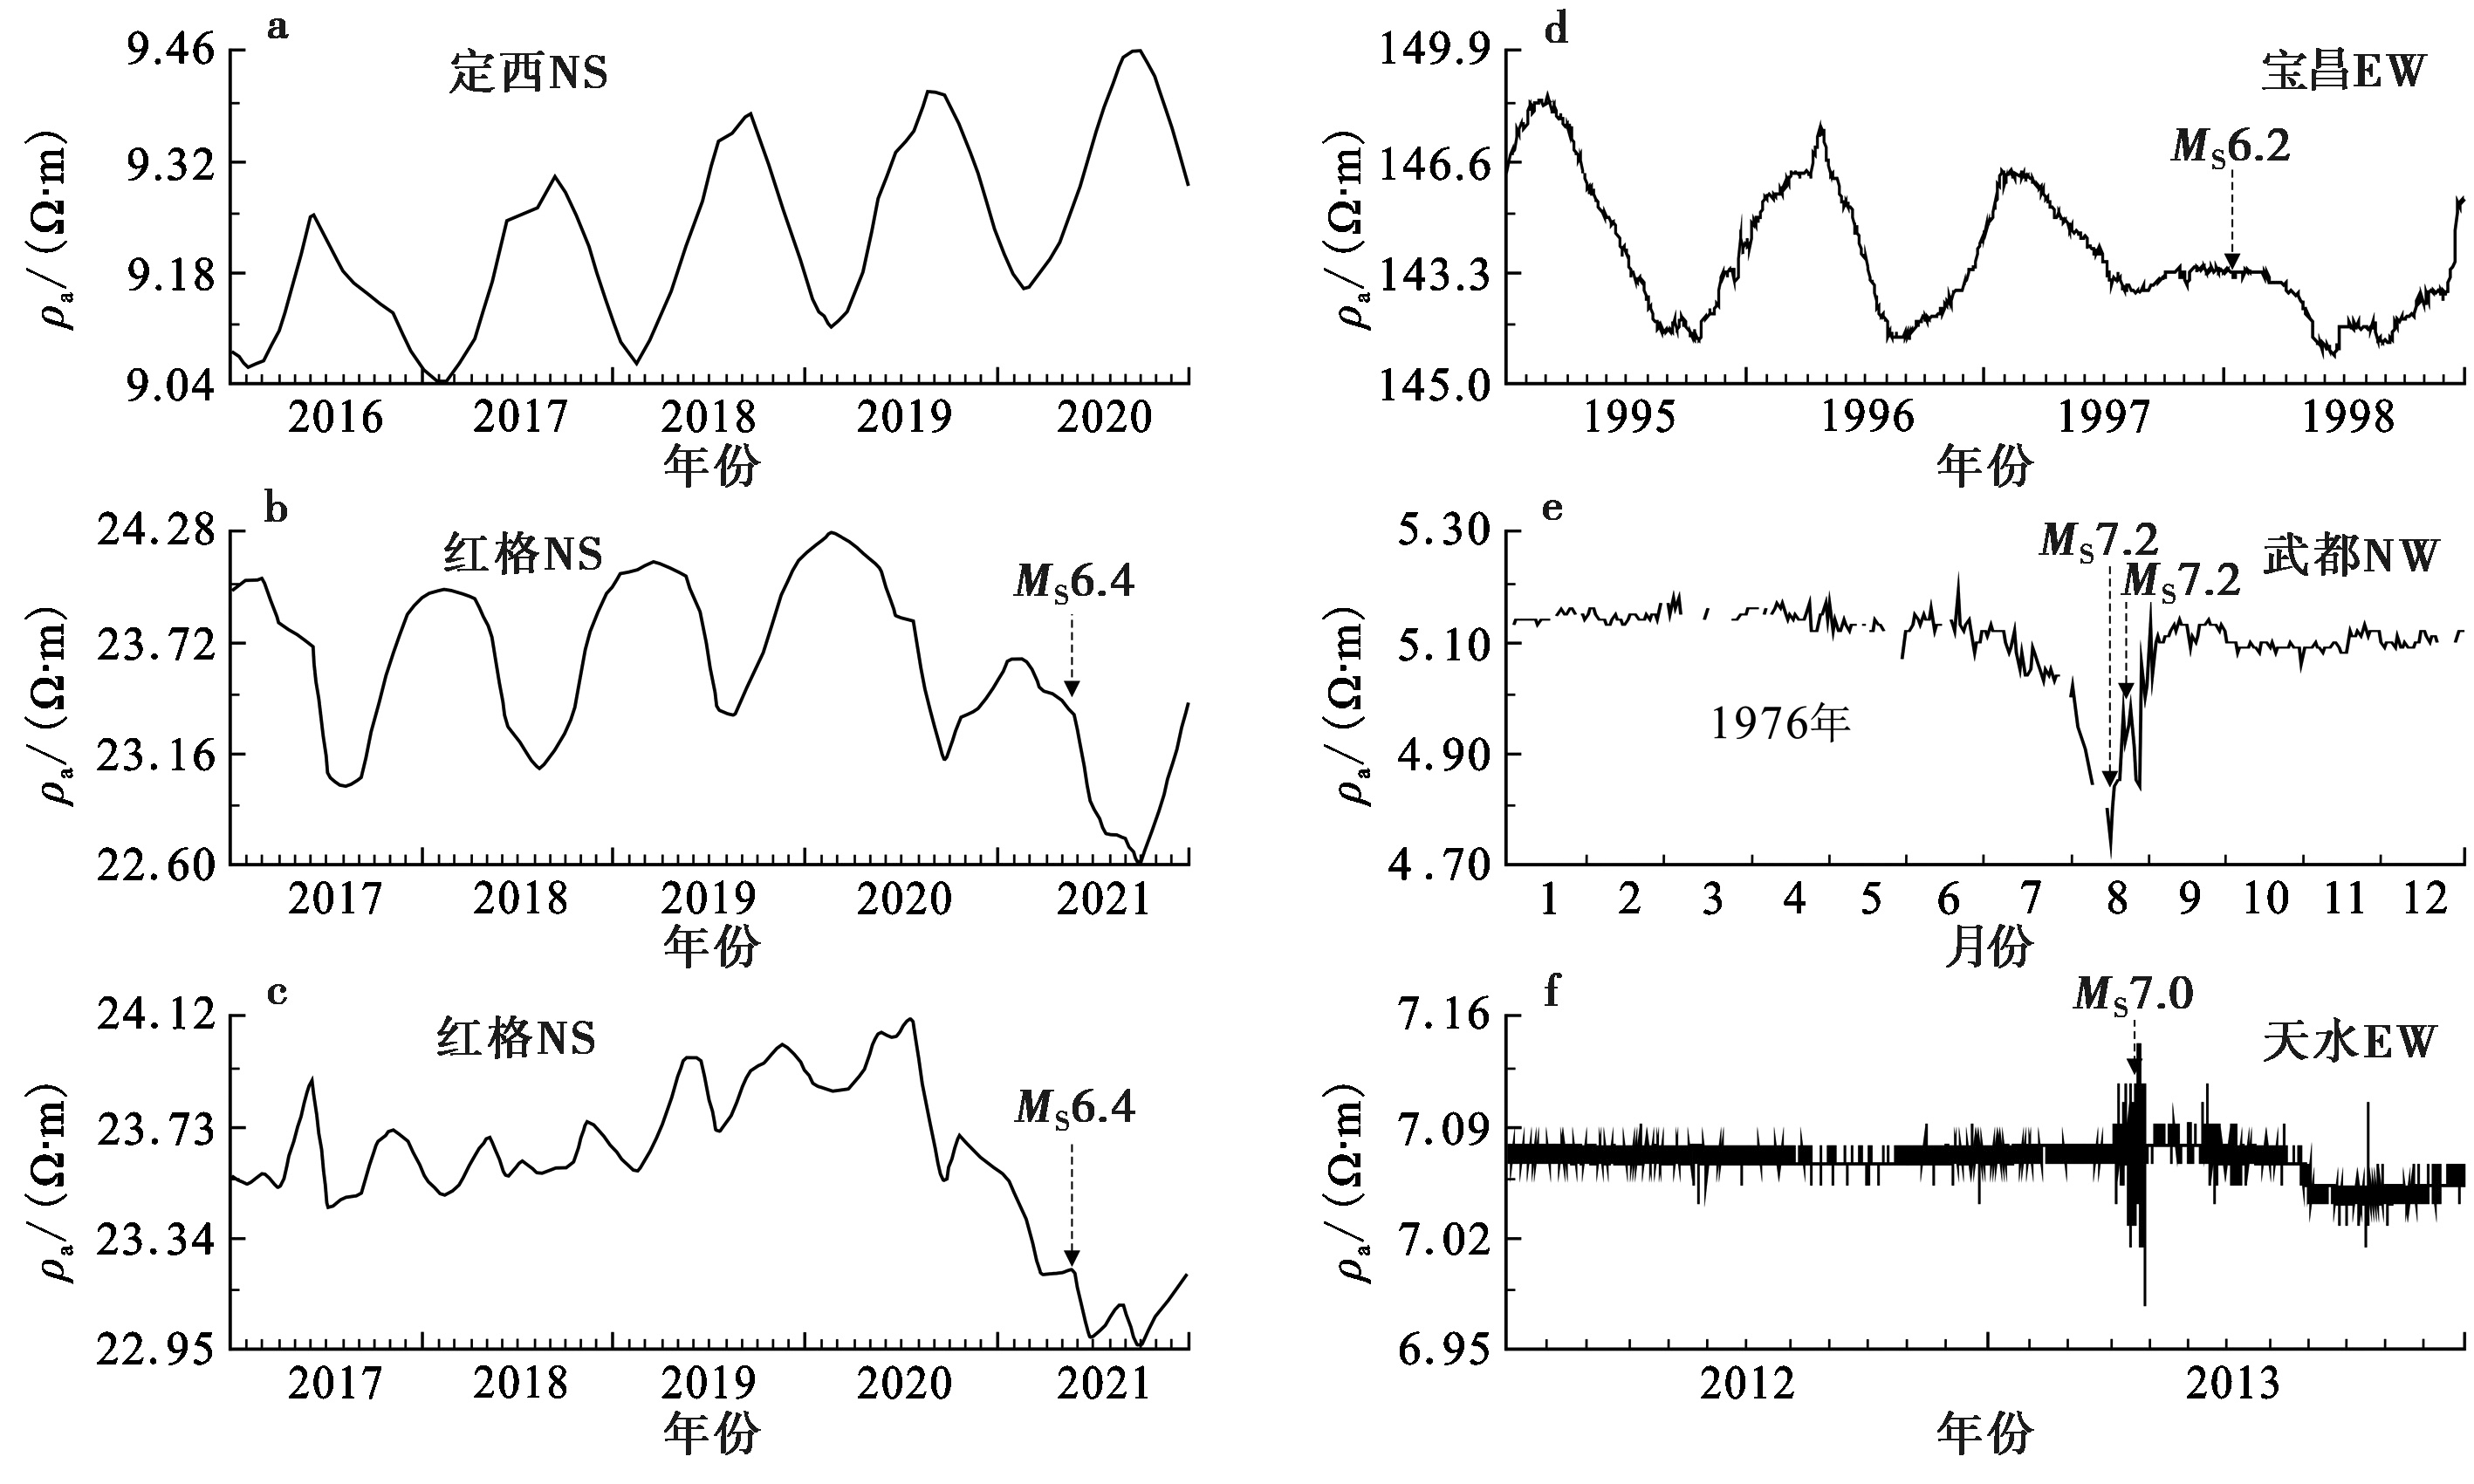
Fig. 16 Normal and anomalous changes of apparent resistivity.
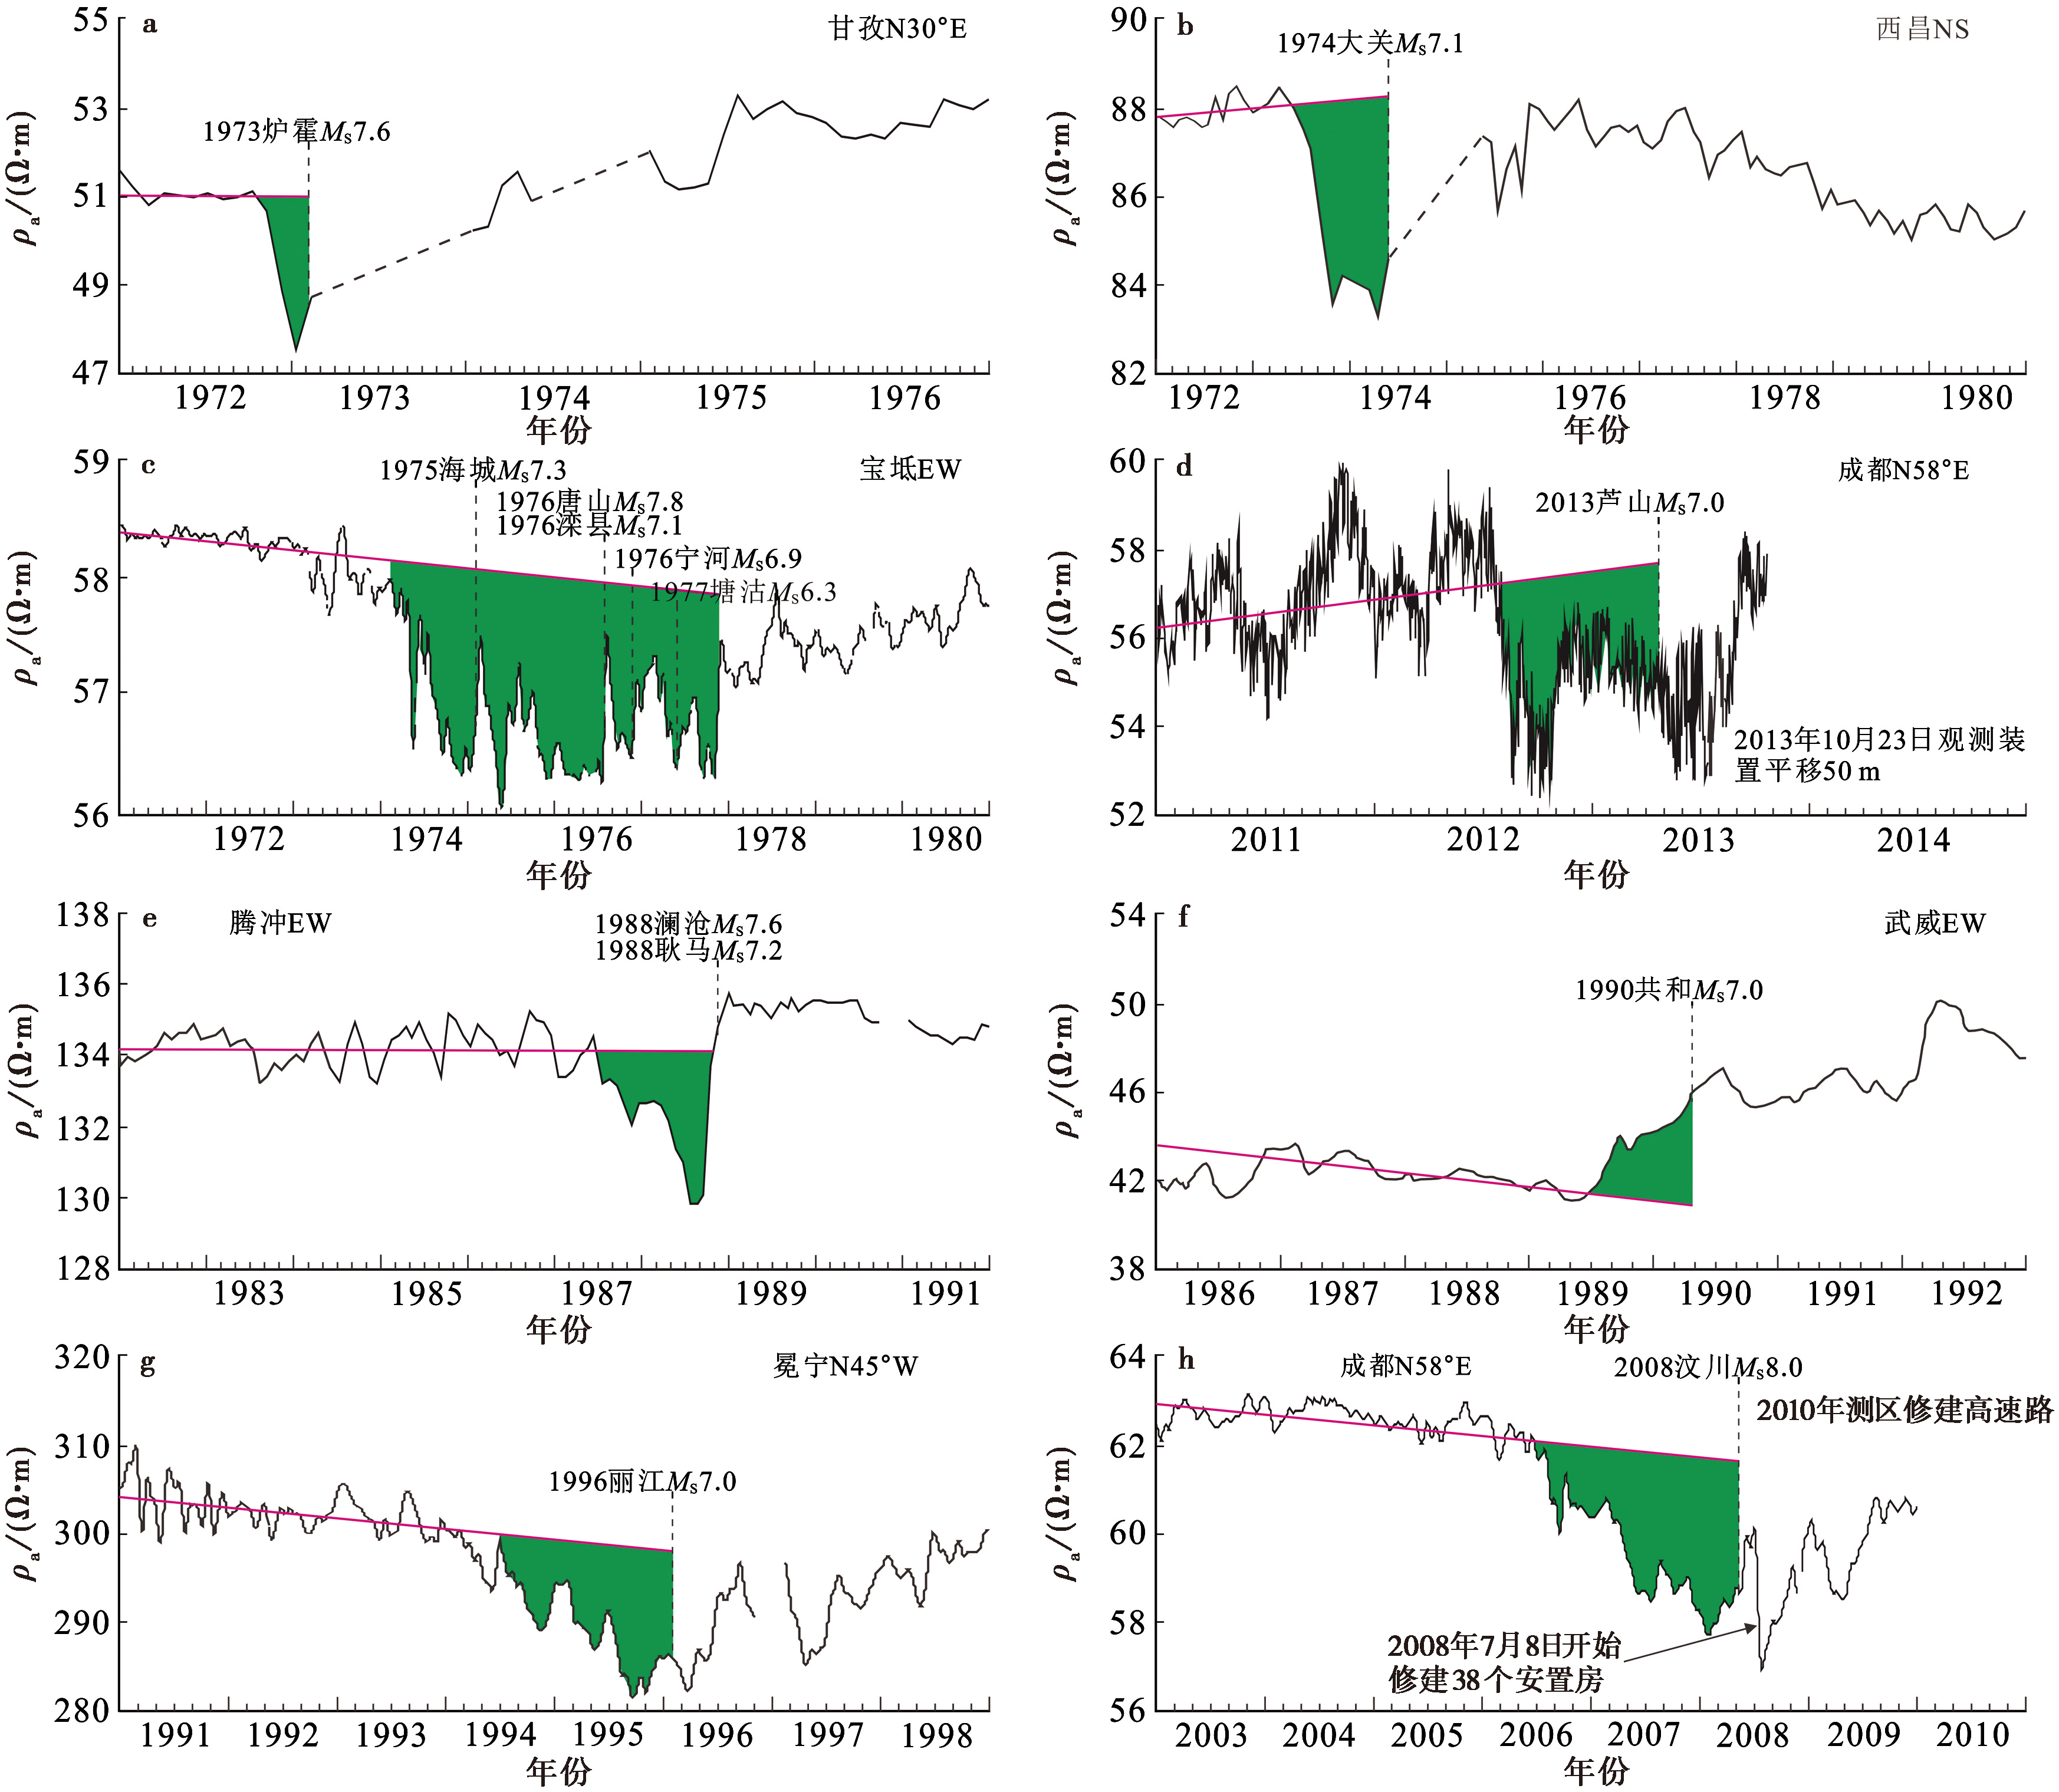
Fig. 17 Some examples of apparent resistivity anomalies before MS≥7.0 earthquakes.
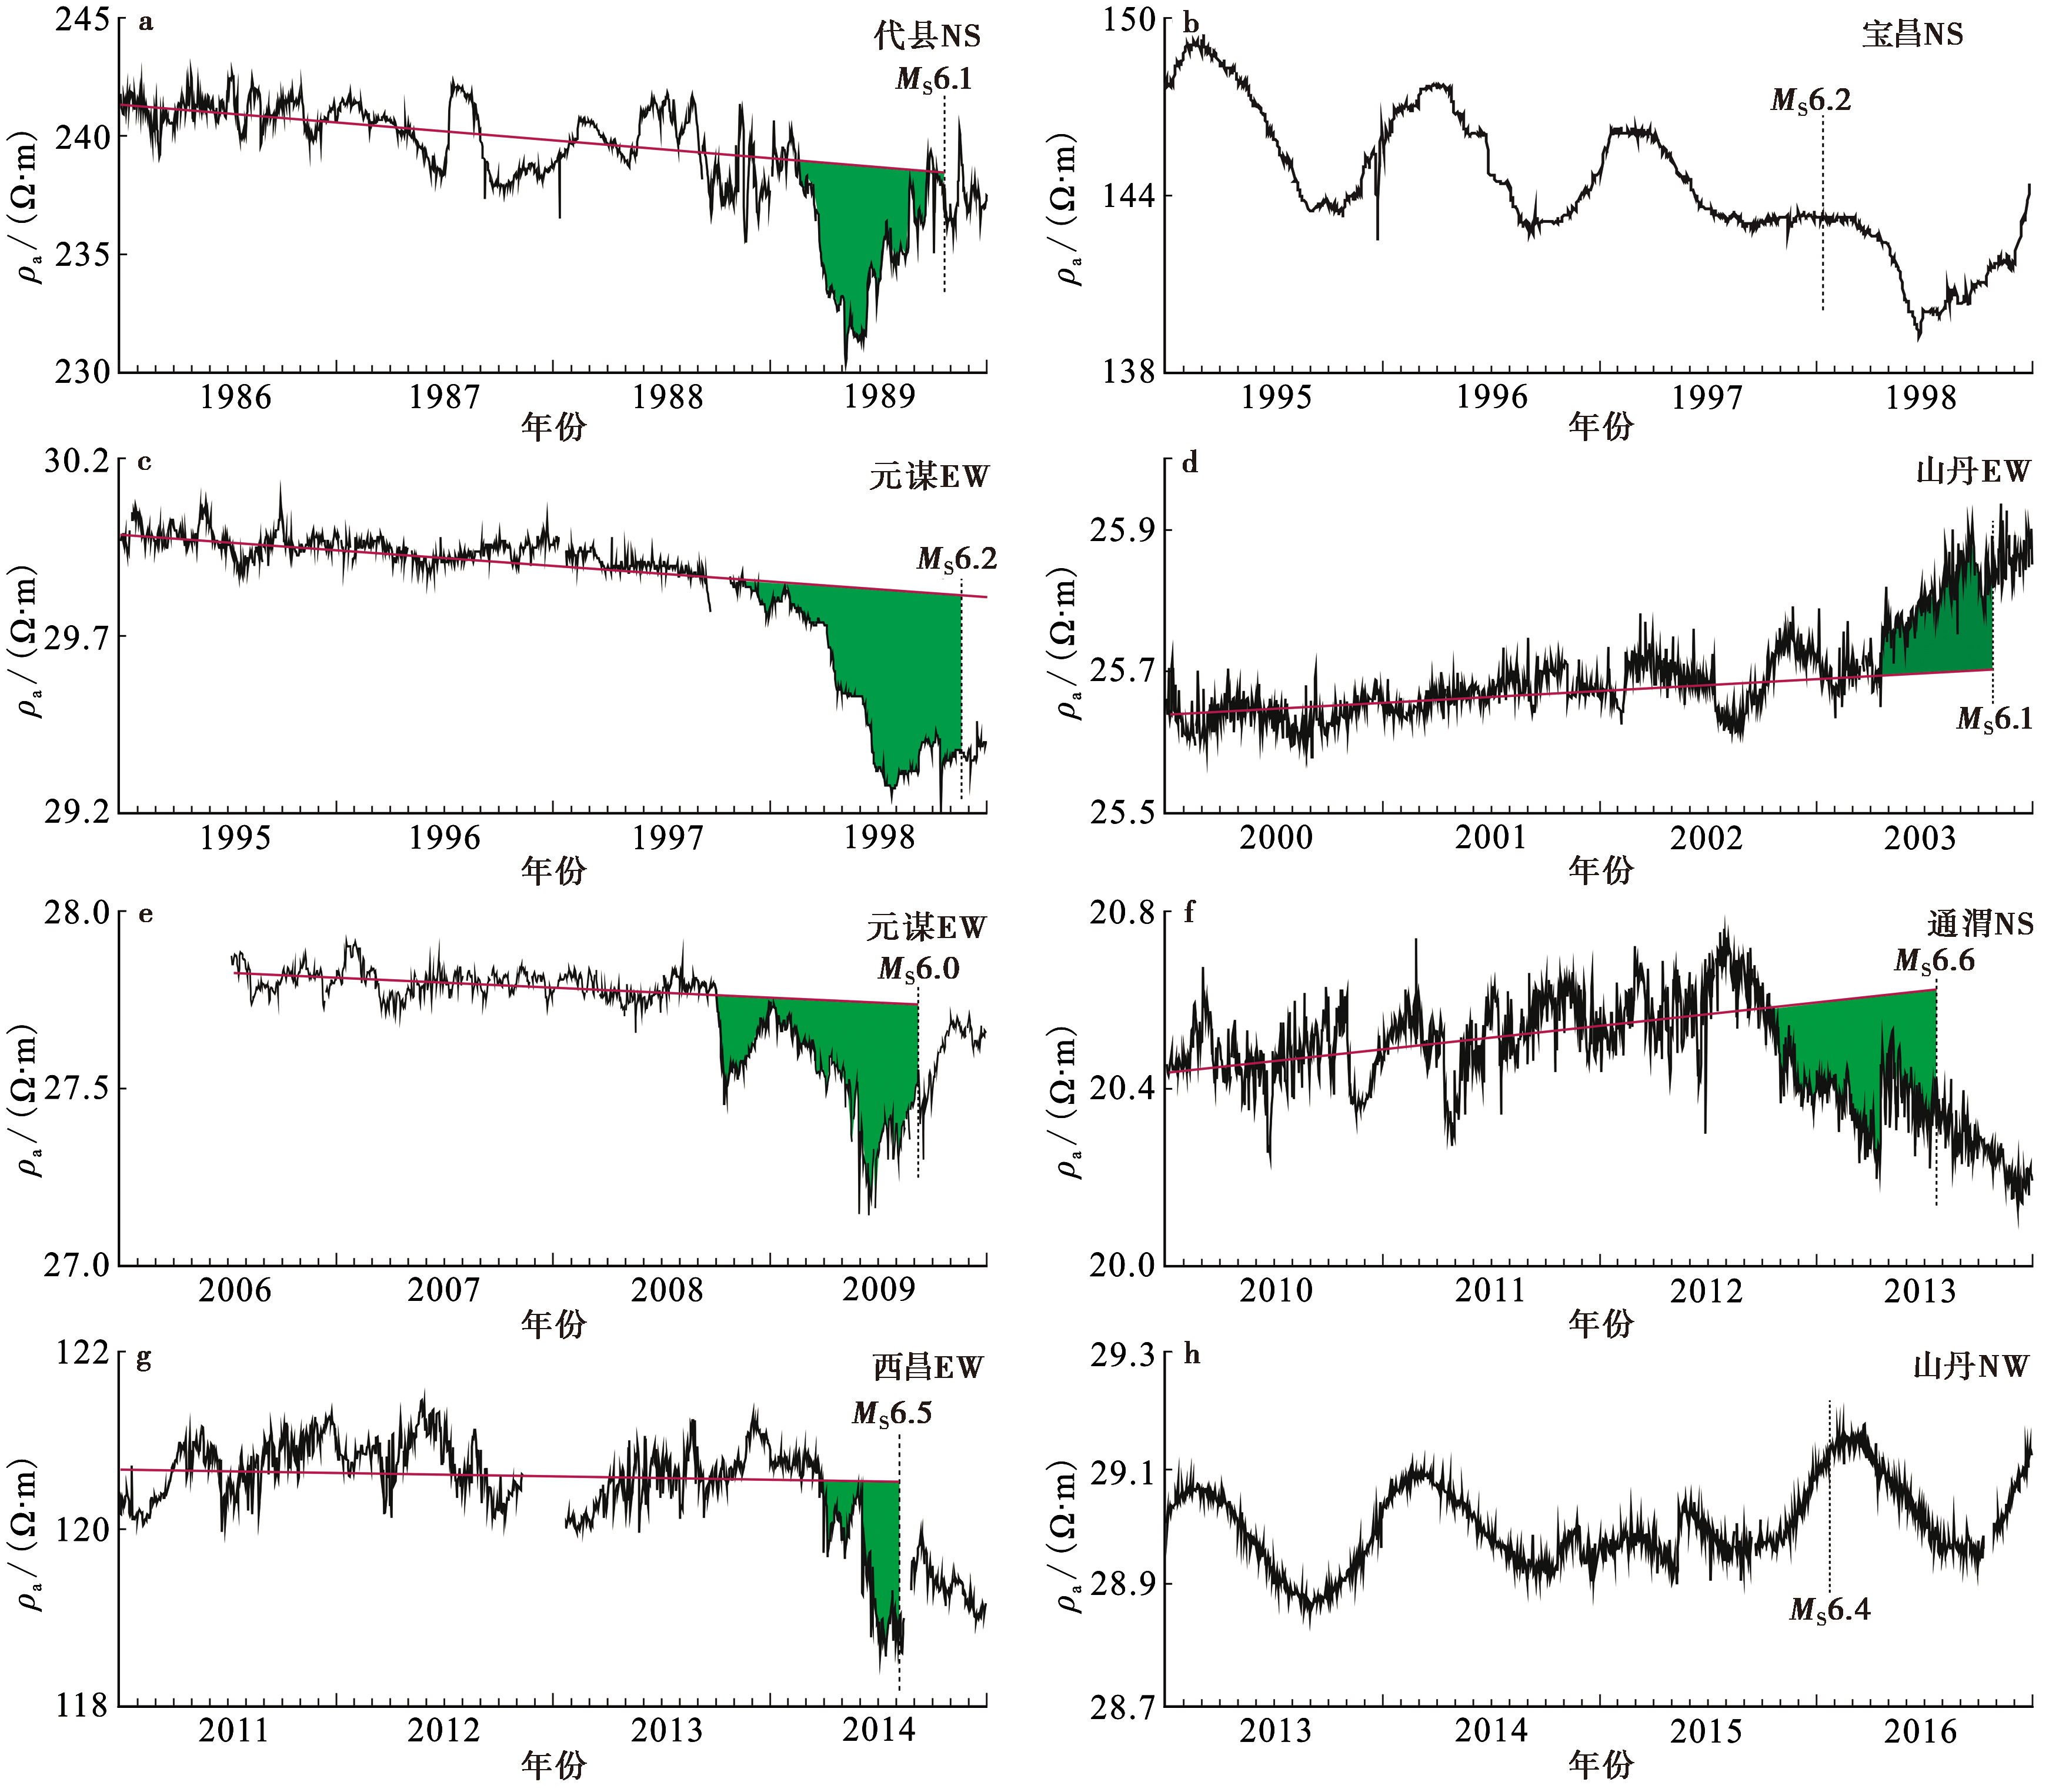
Fig. 18 Some examples of apparent resistivity anomalies before earthquakes with 6.0≤MS≤6.9.
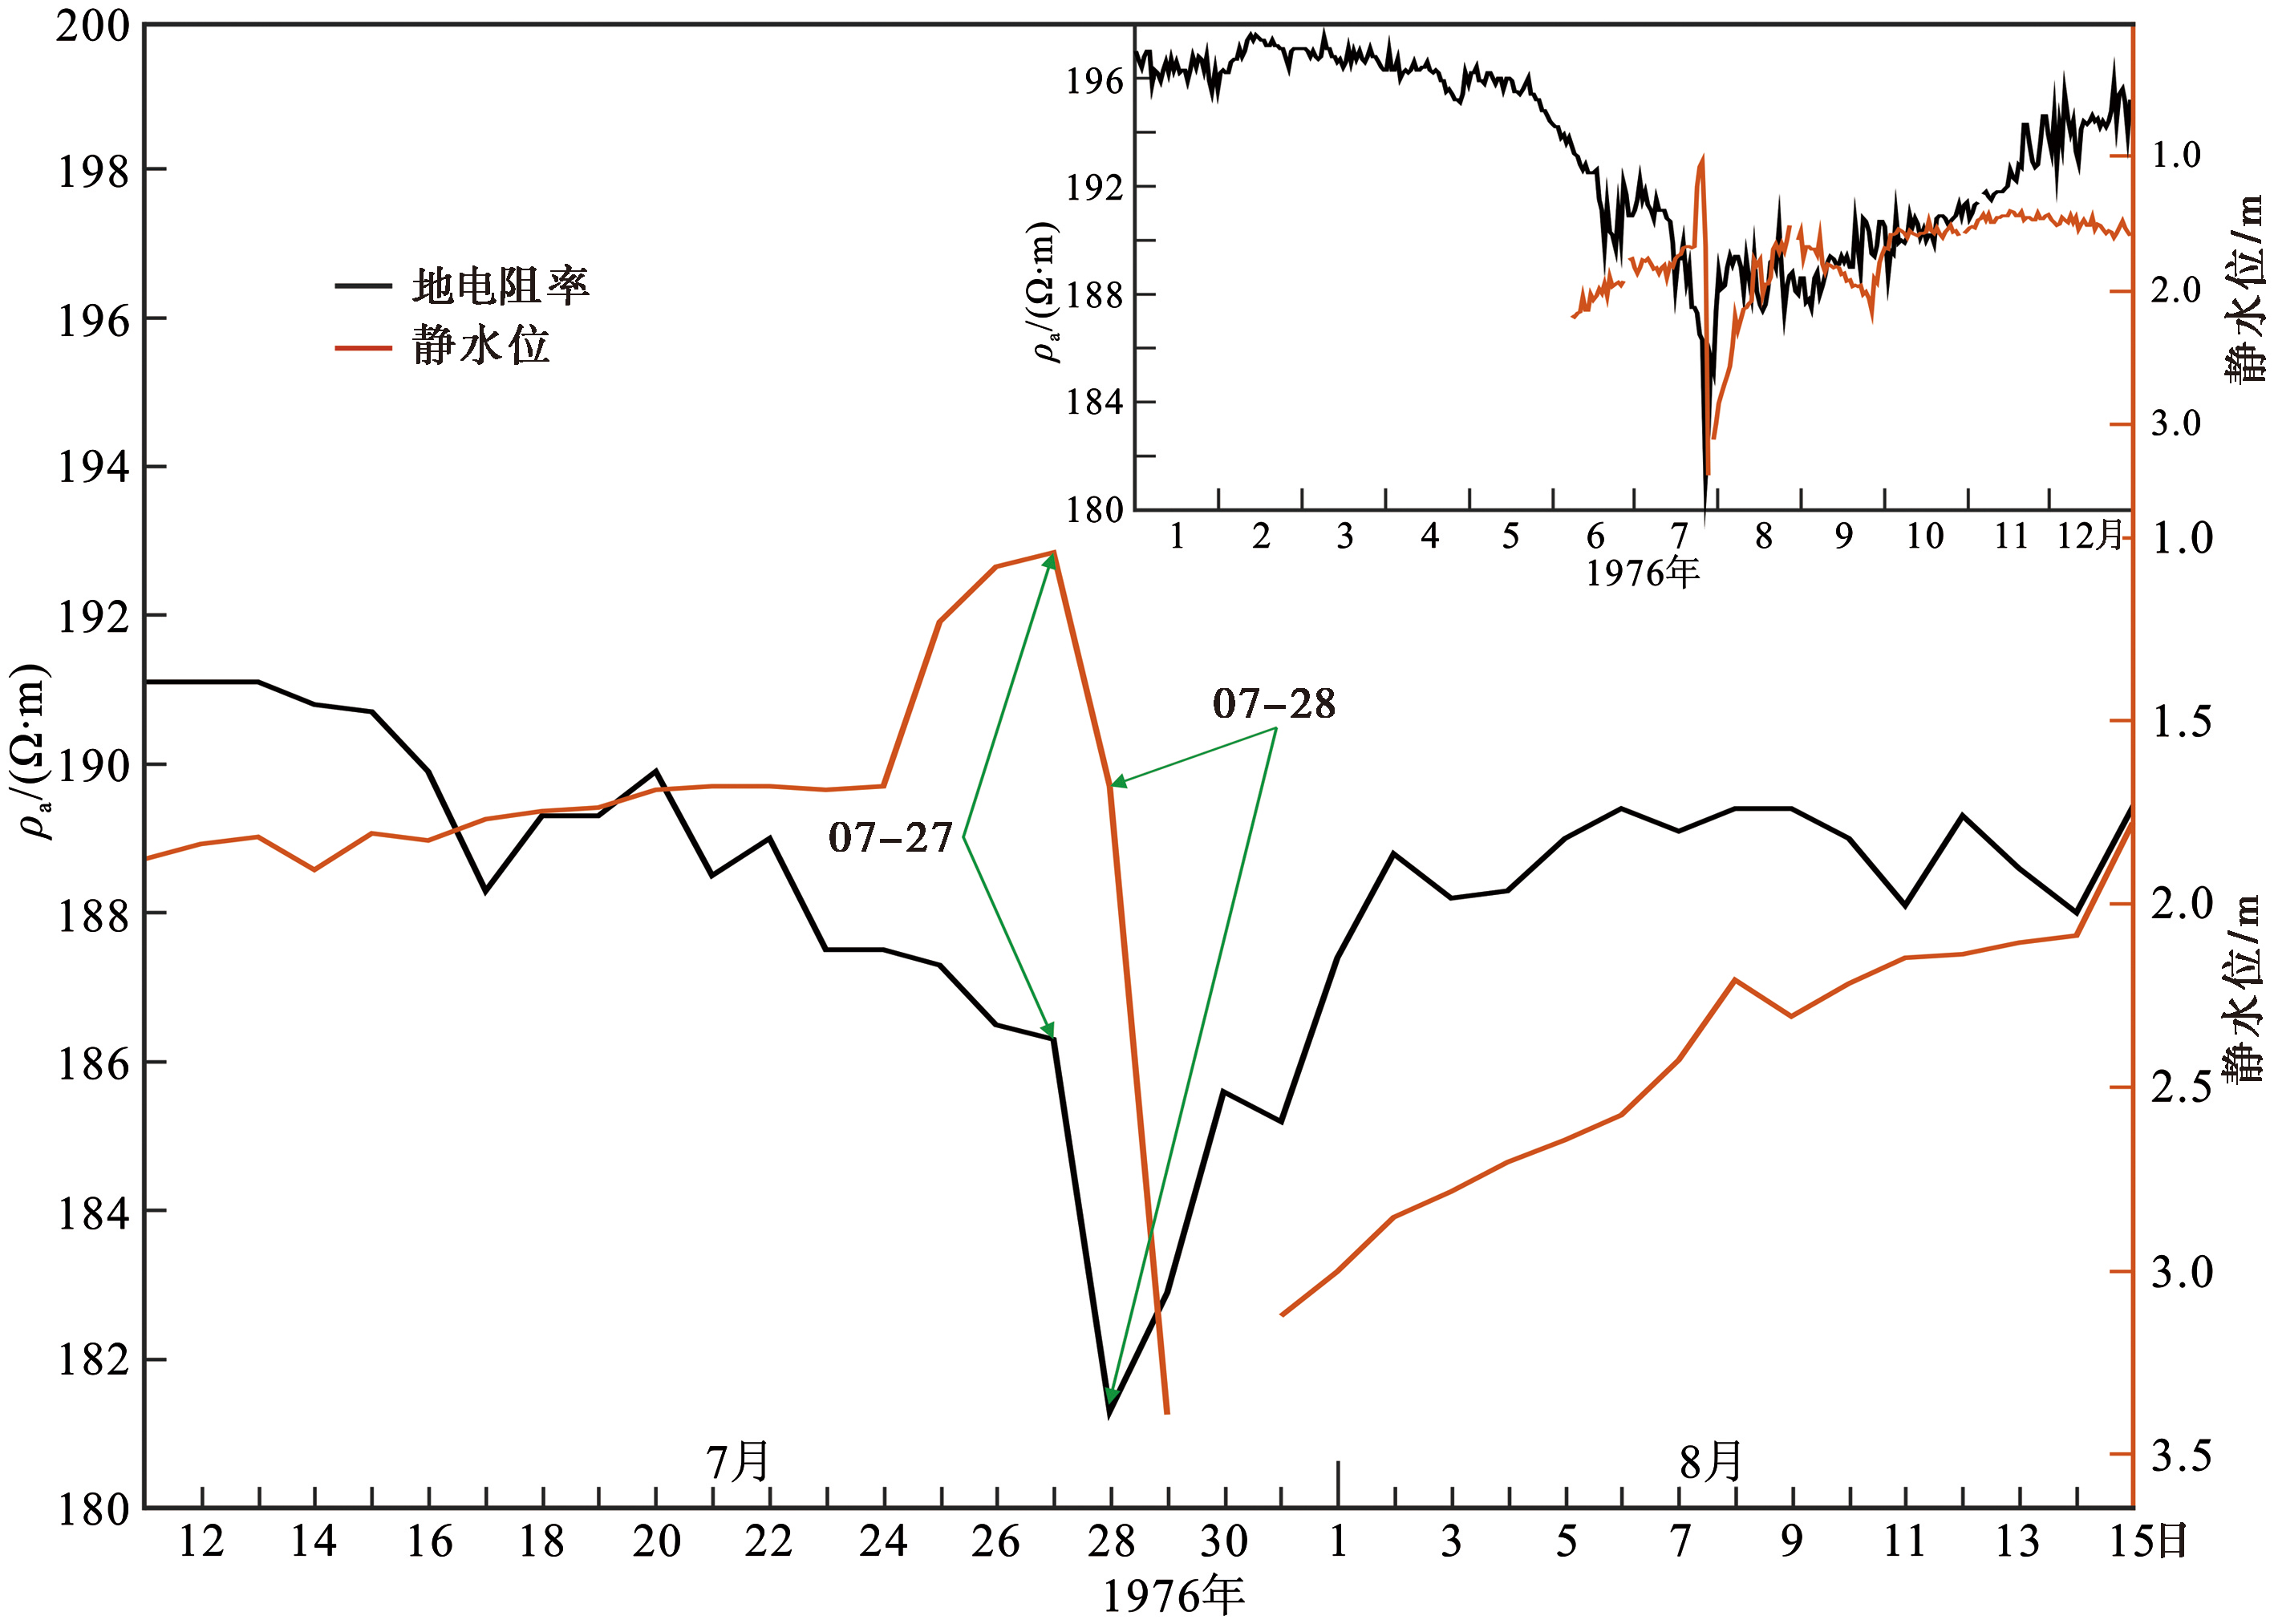
Fig. 19 The apparent resistivity and water level data of Changli station before and after the 1976 Tangshan MS7.8 earthquake.
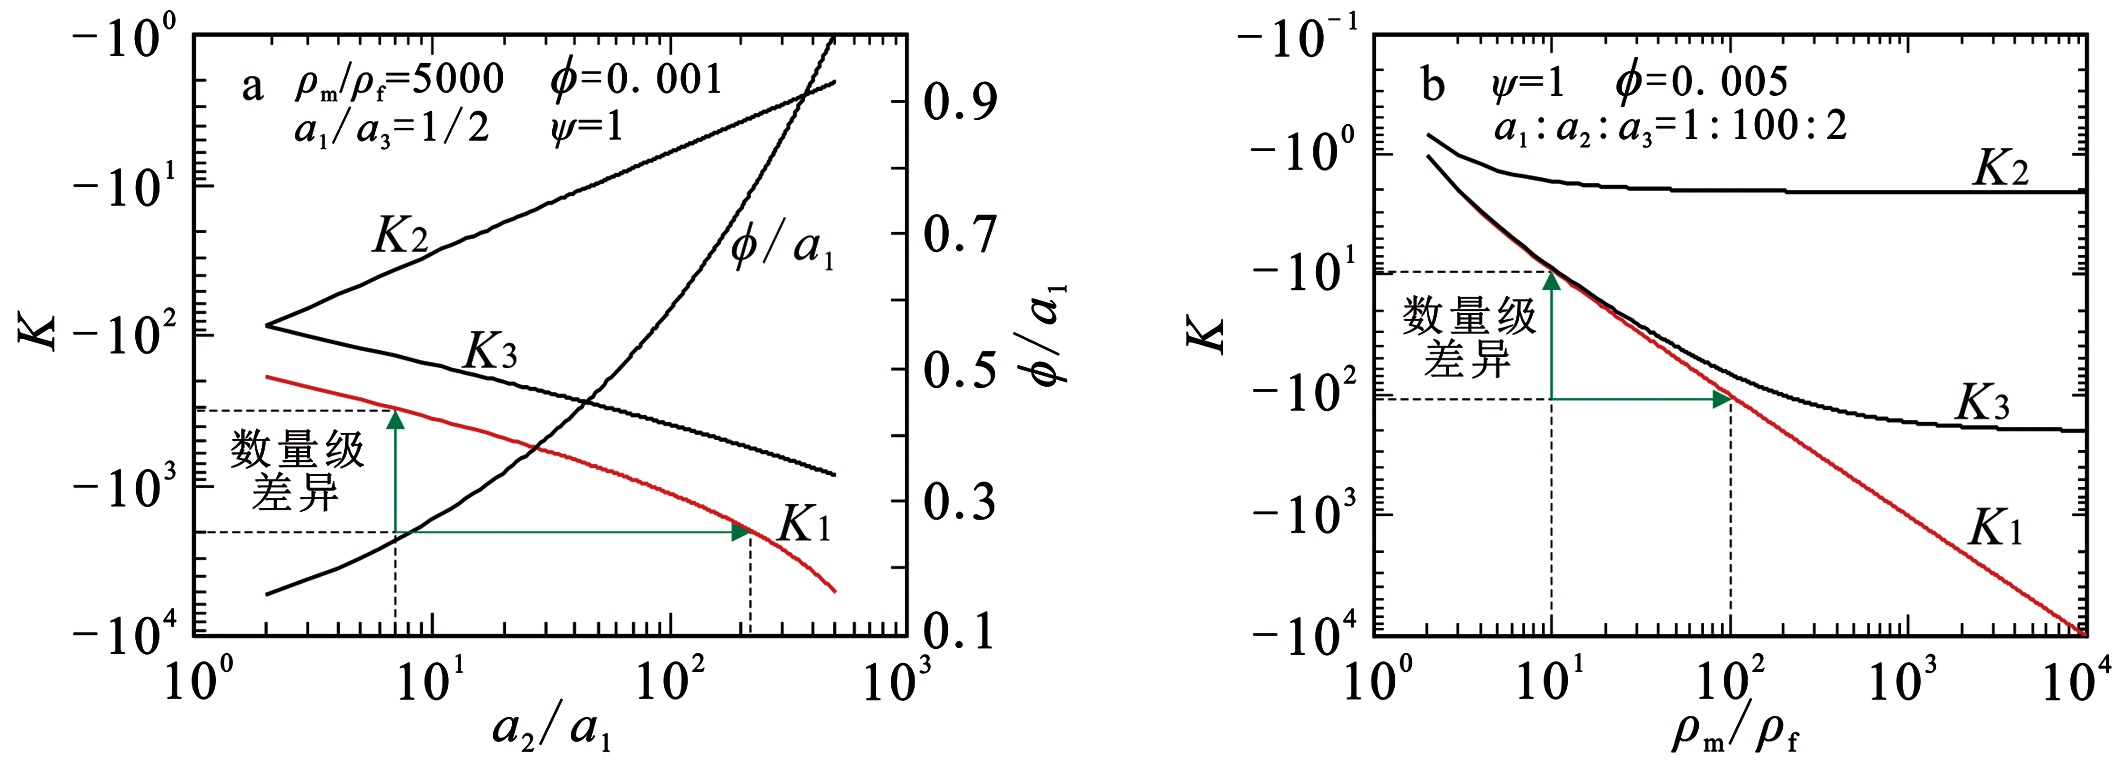
Fig. 20 The amplification coefficients of rock and soil resistivity on fracture change.
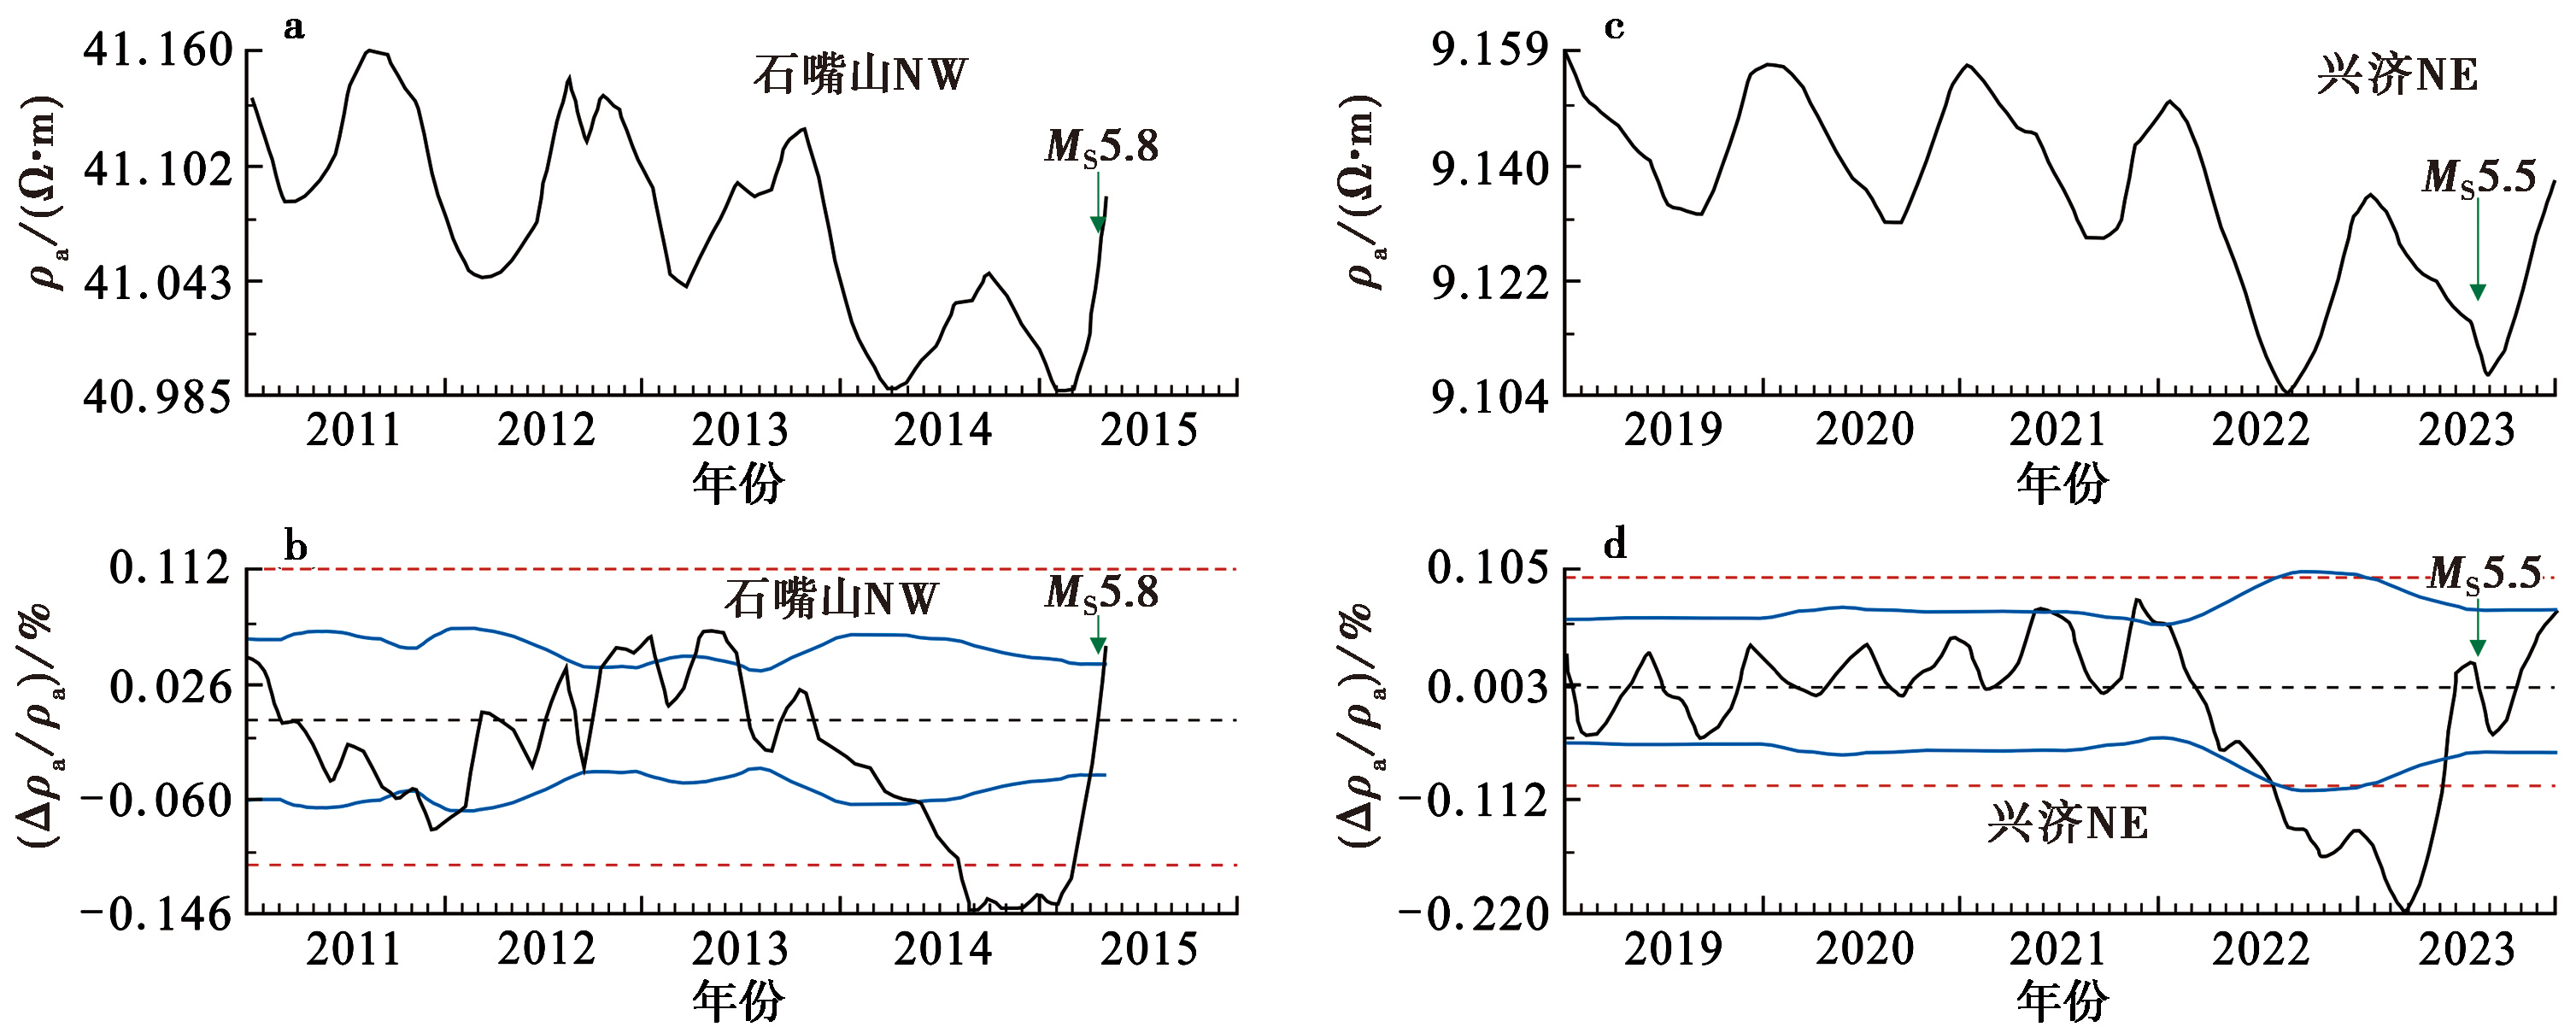
Fig. 21 Weak anomalies of the apparent resistivity extracted by adaptive amplitude variation method.
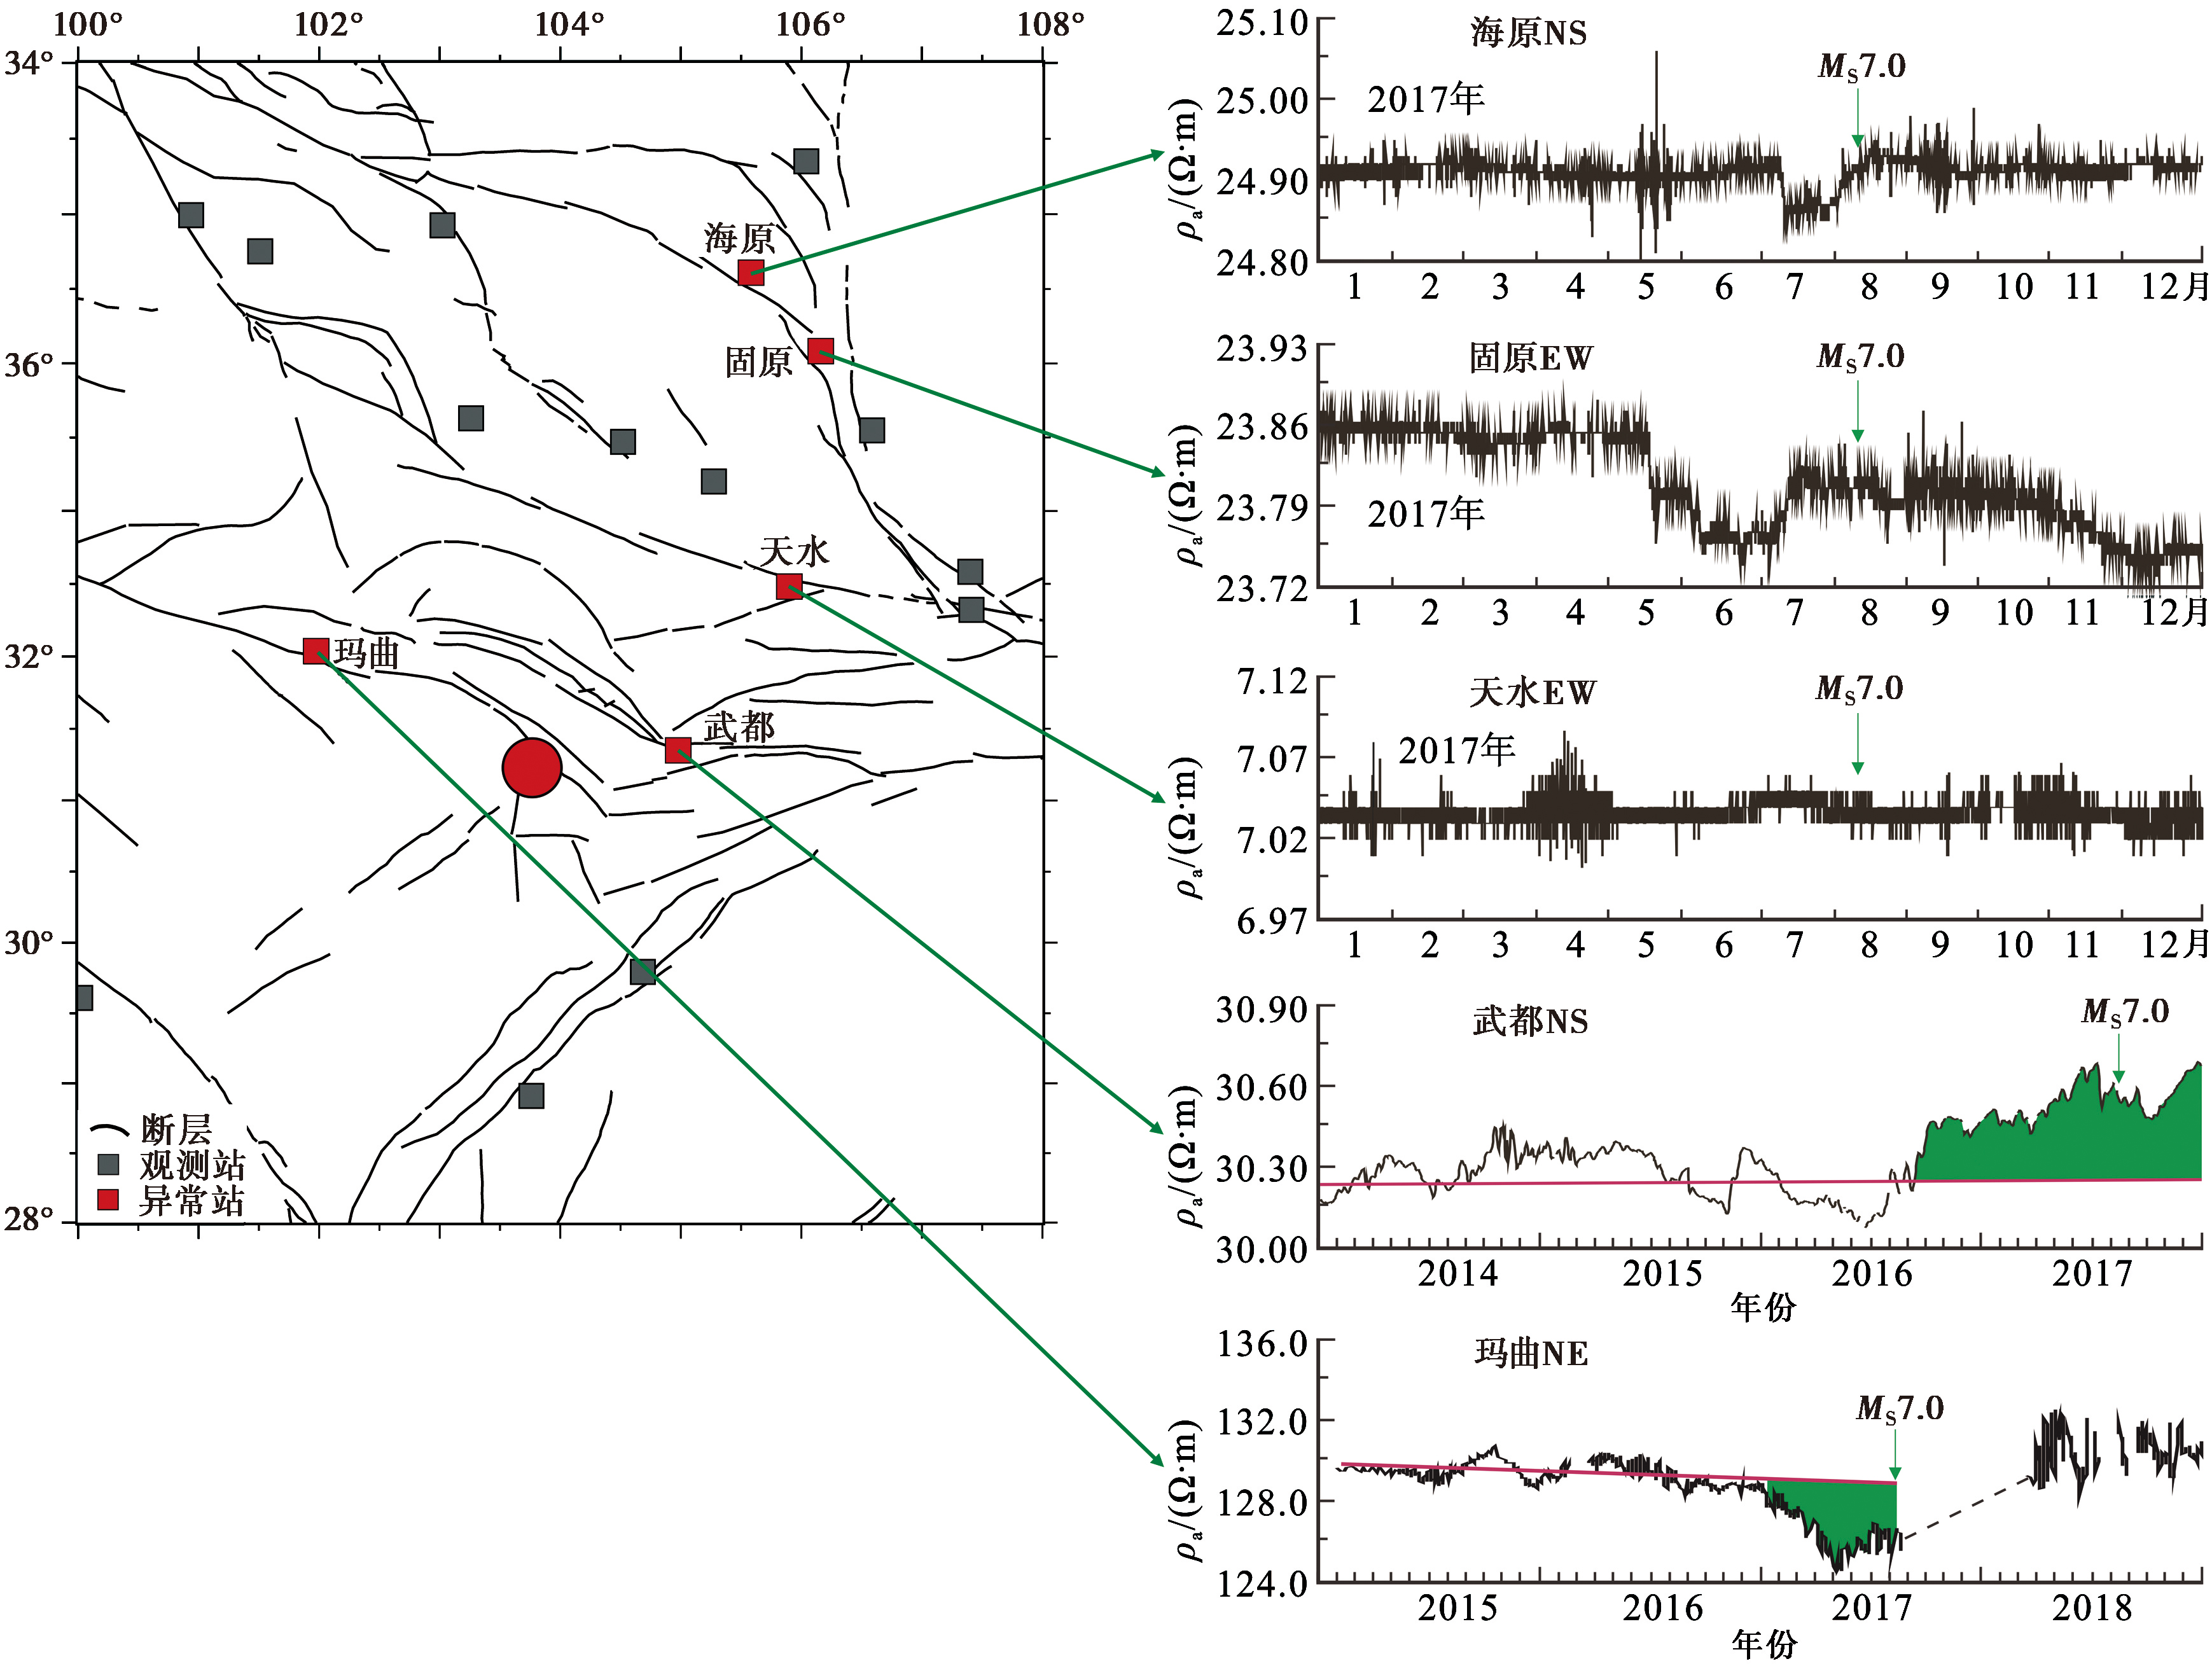
Fig. 22 Distribution of resistivity observation stations and anomaly changes before the 2017 MS7.0 Jiuzhaigou earthquake.
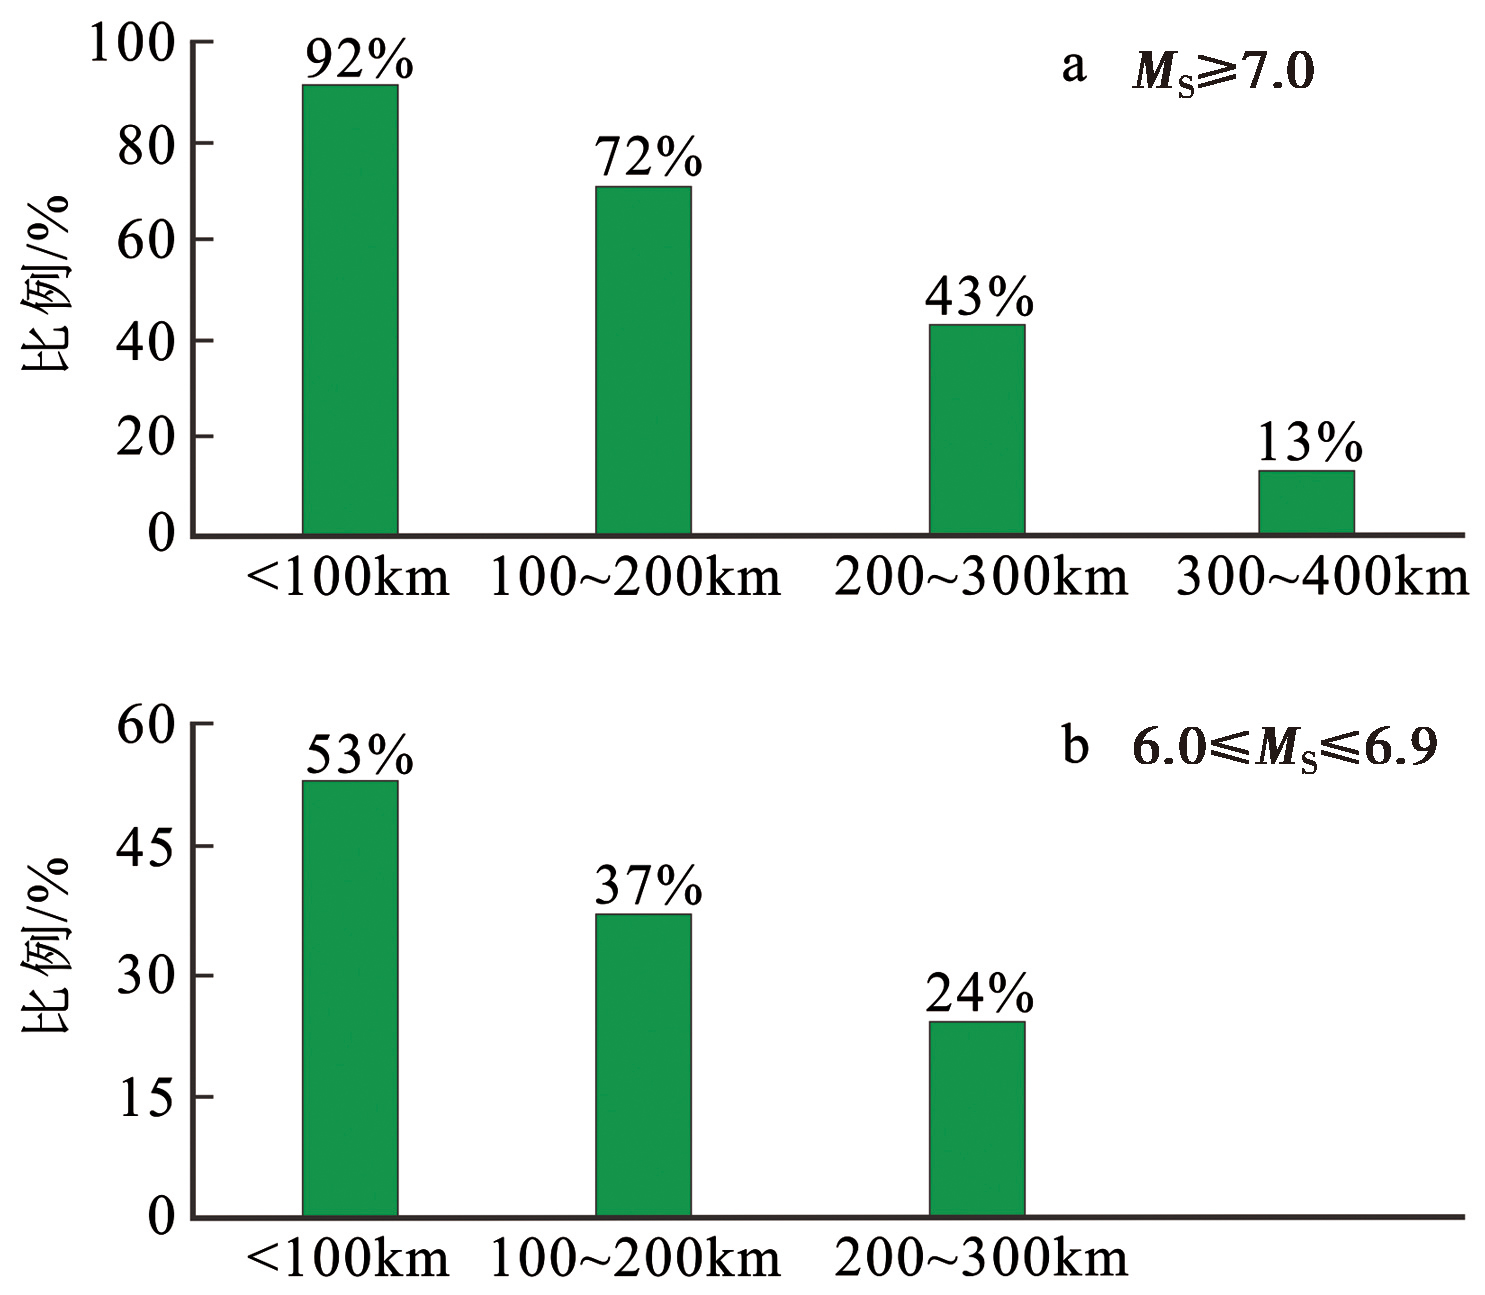
Fig. 23 The proportion of apparent resistivity anomalies at different epicentral distance before MS≥6.0 earthquakes in China.
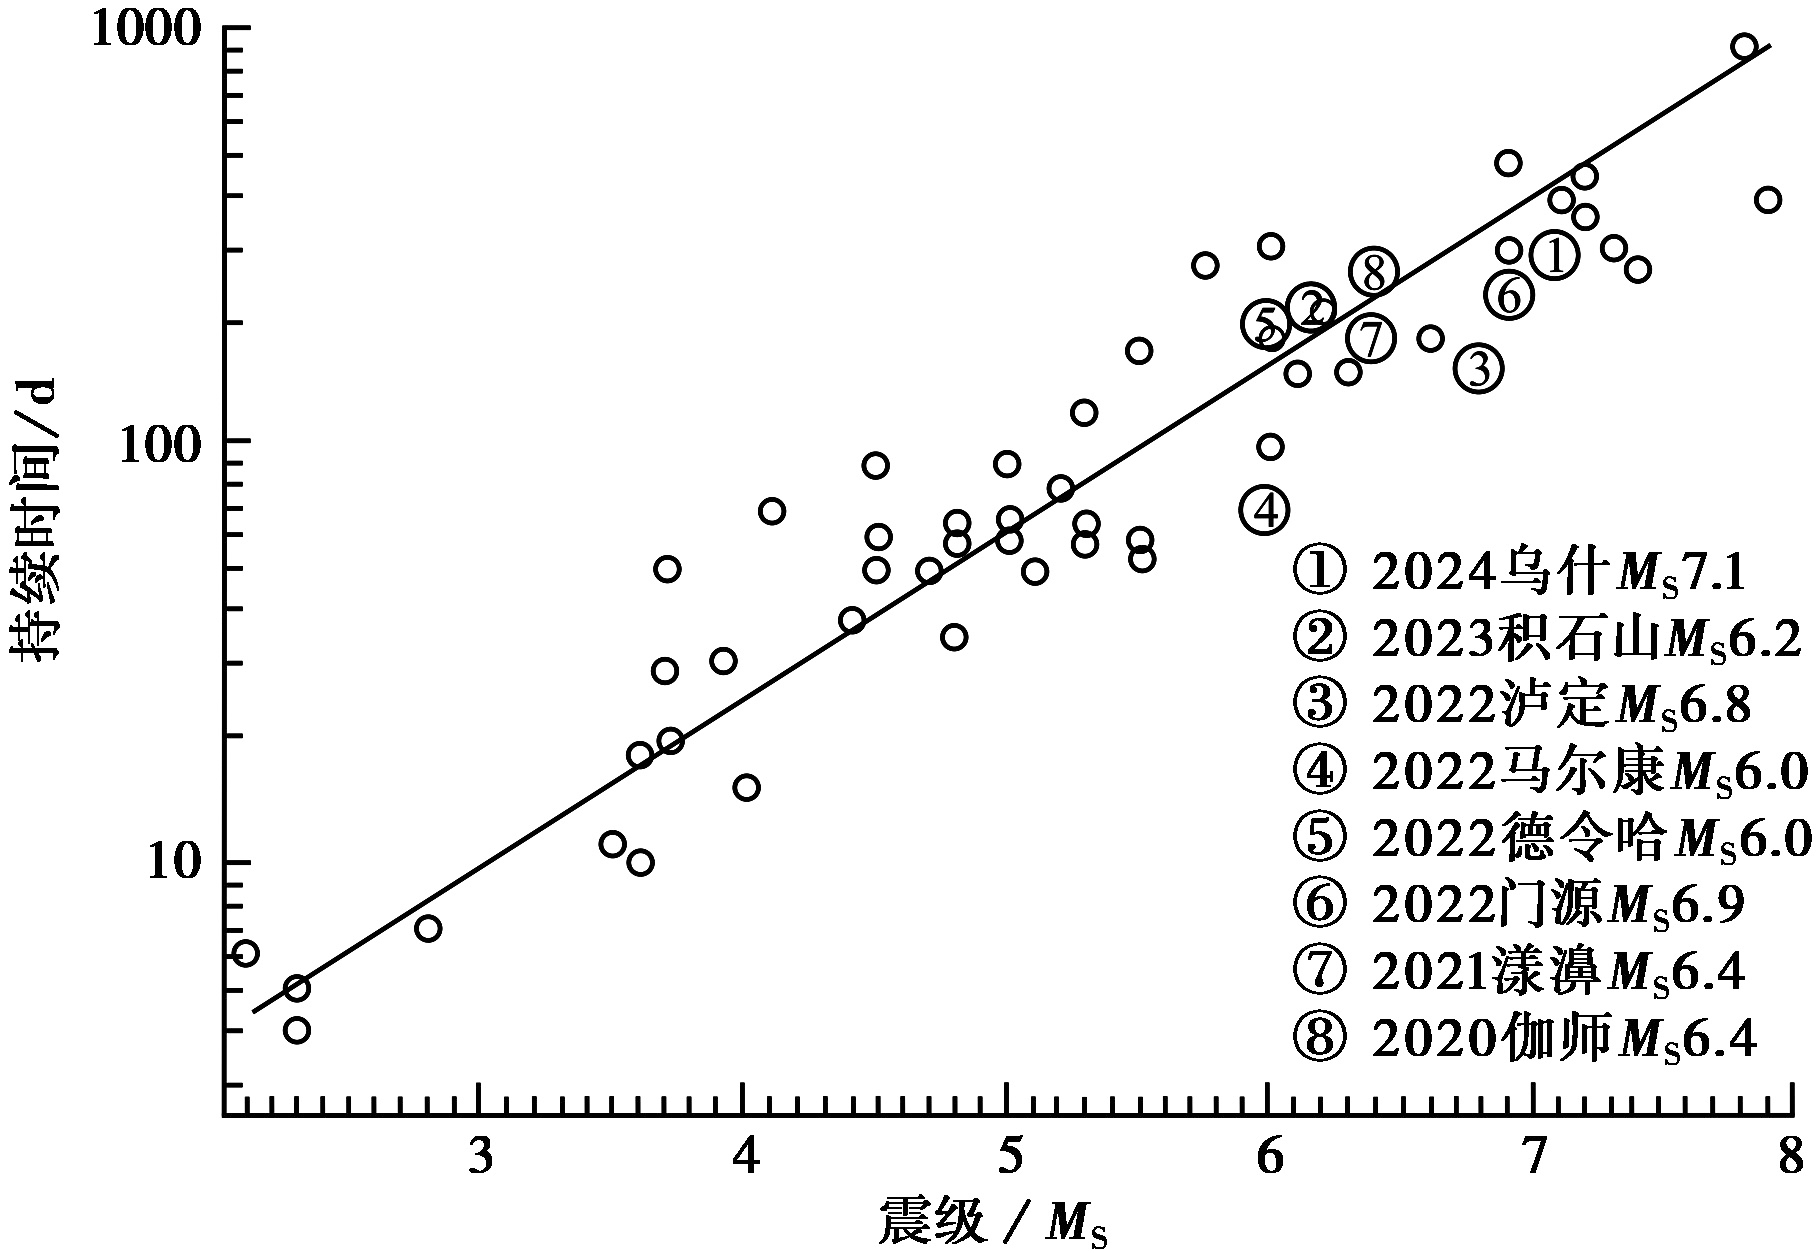
Fig. 24 The empirical relationship between apparent resistivity anomaly duration and earthquake magnitude(modified from QIAN Fu-ye et al., 1982).
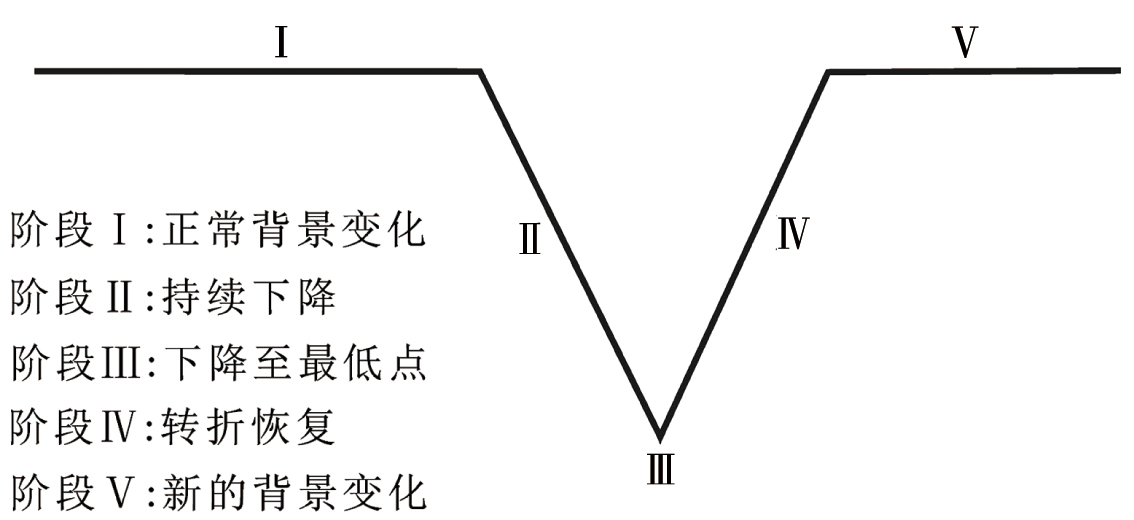
Fig. 25 The stage division of apparent resistivity anomaly(from WANG Zhi-liang et al., 2002).
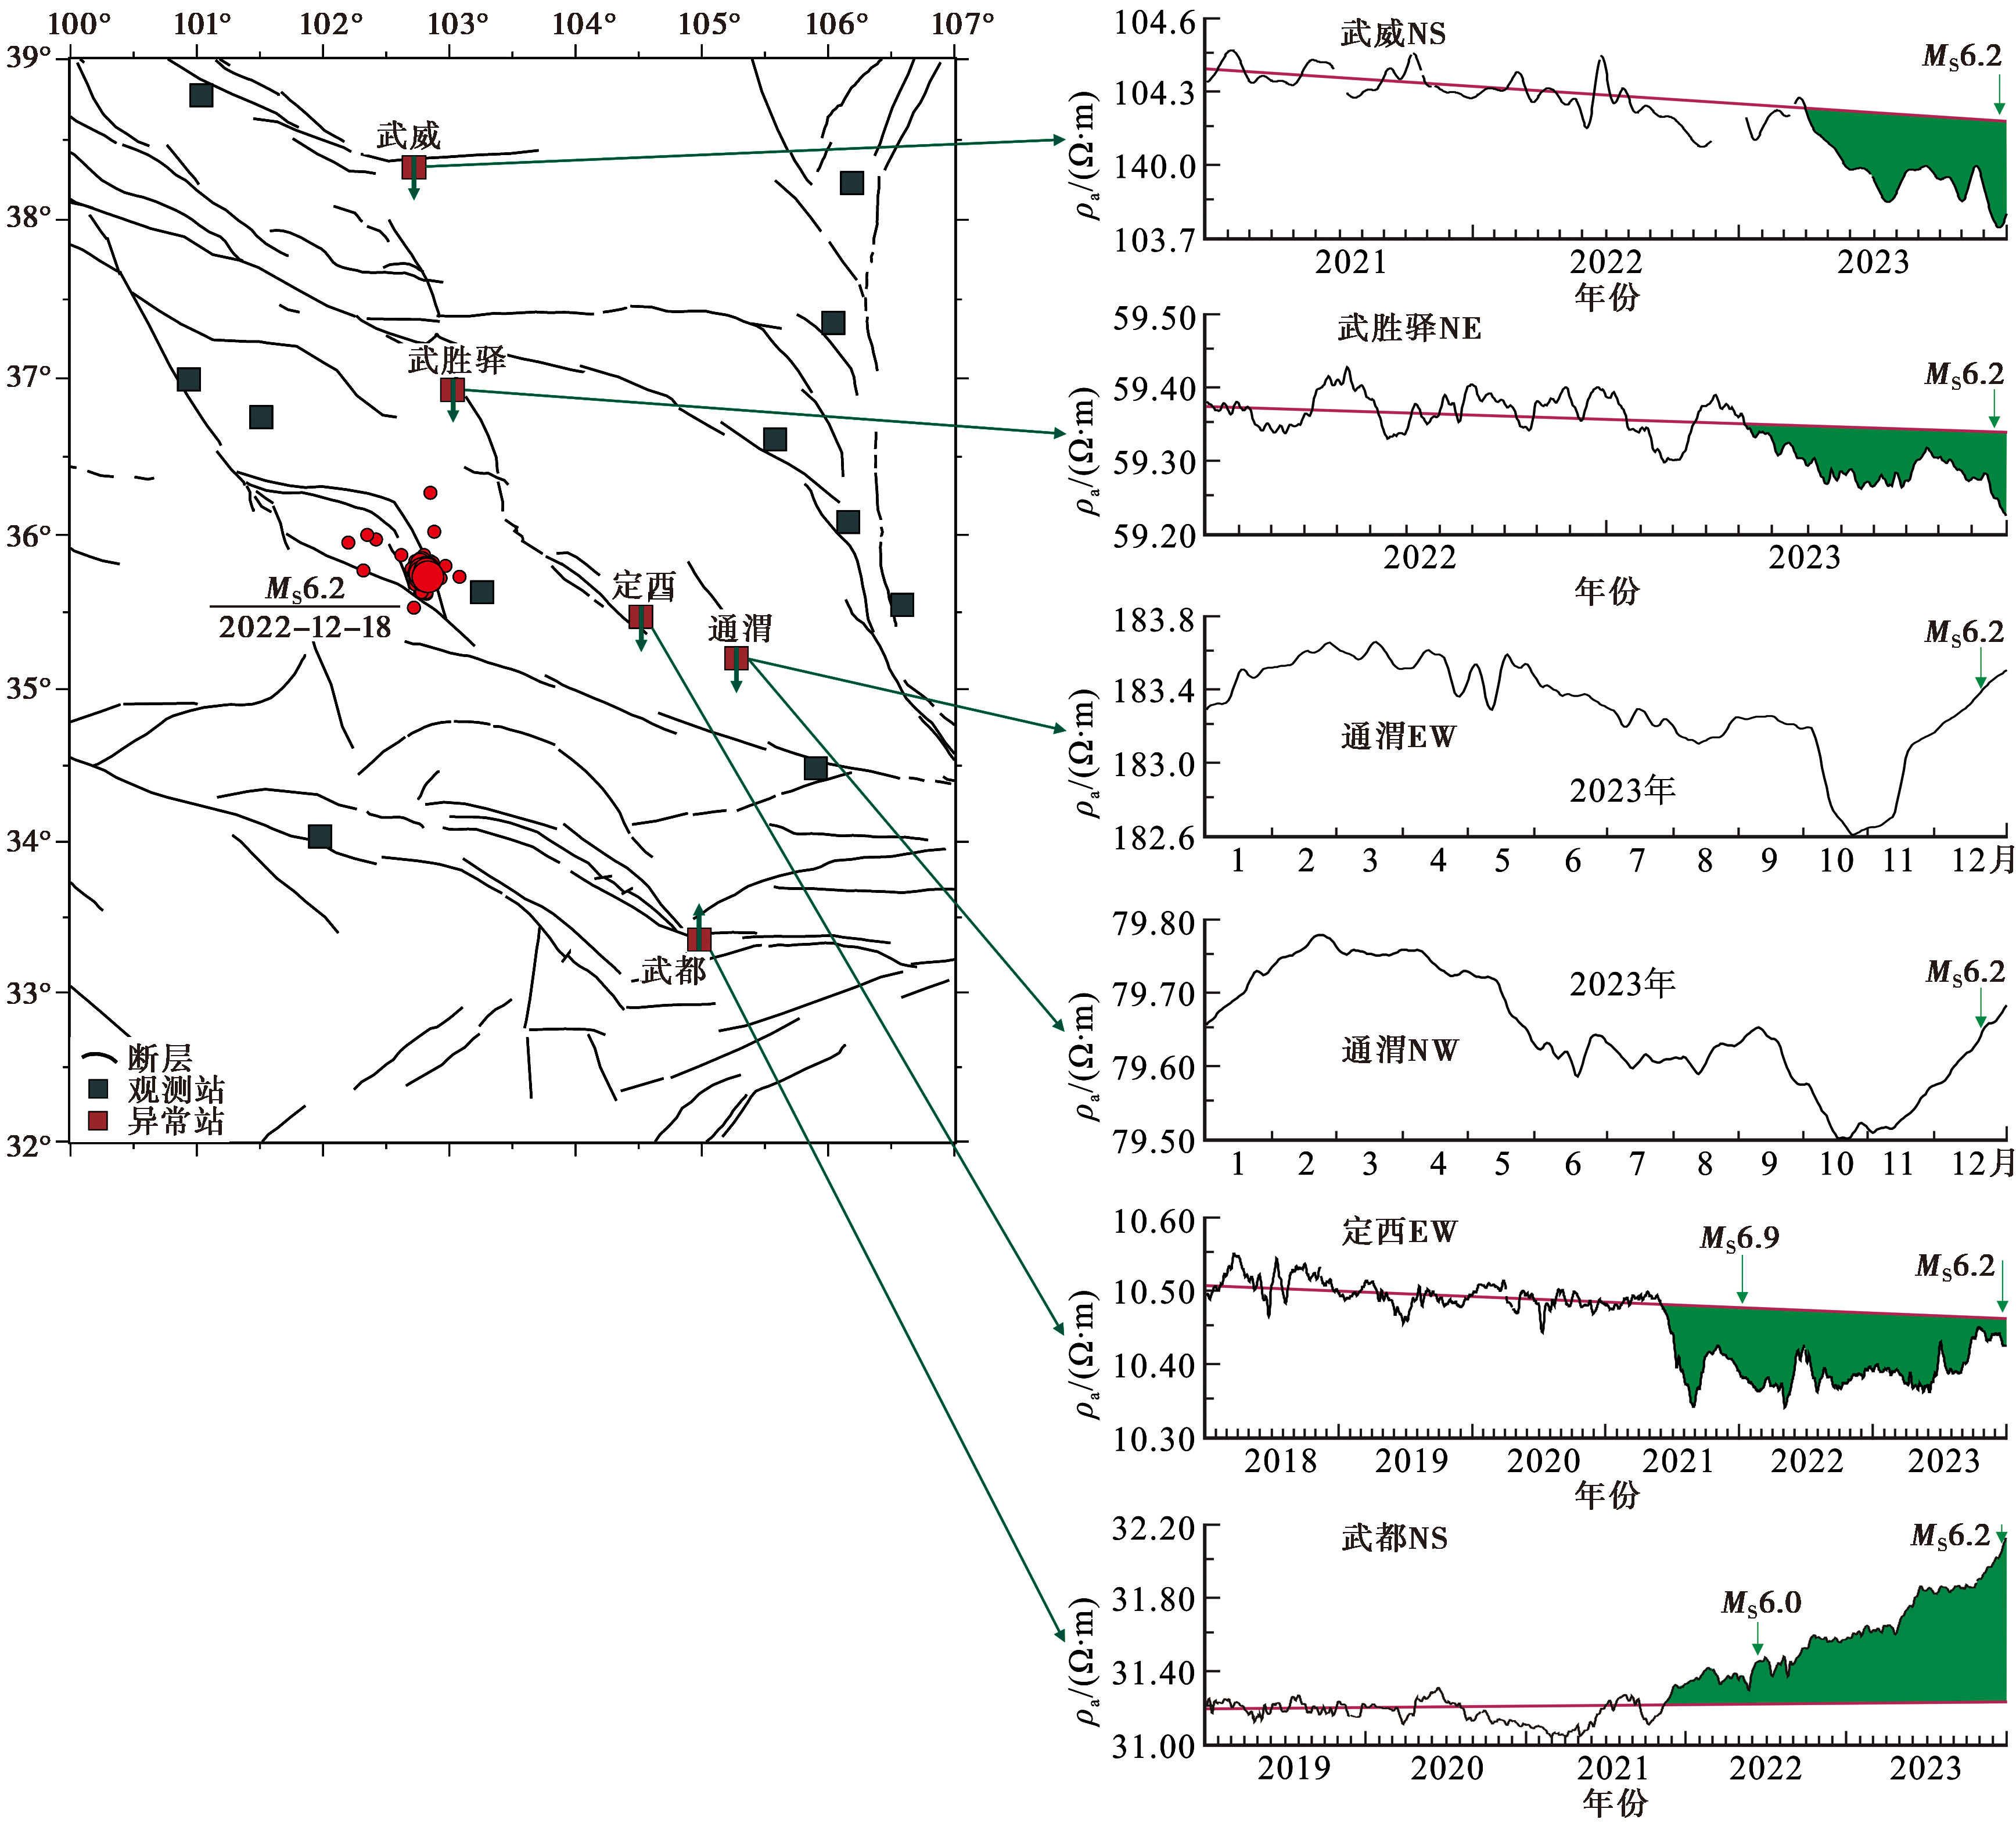
Fig. 26 Distribution of resistivity observation stations and anomaly changes before the 2023 MS6.2 Jishishan earthquake.
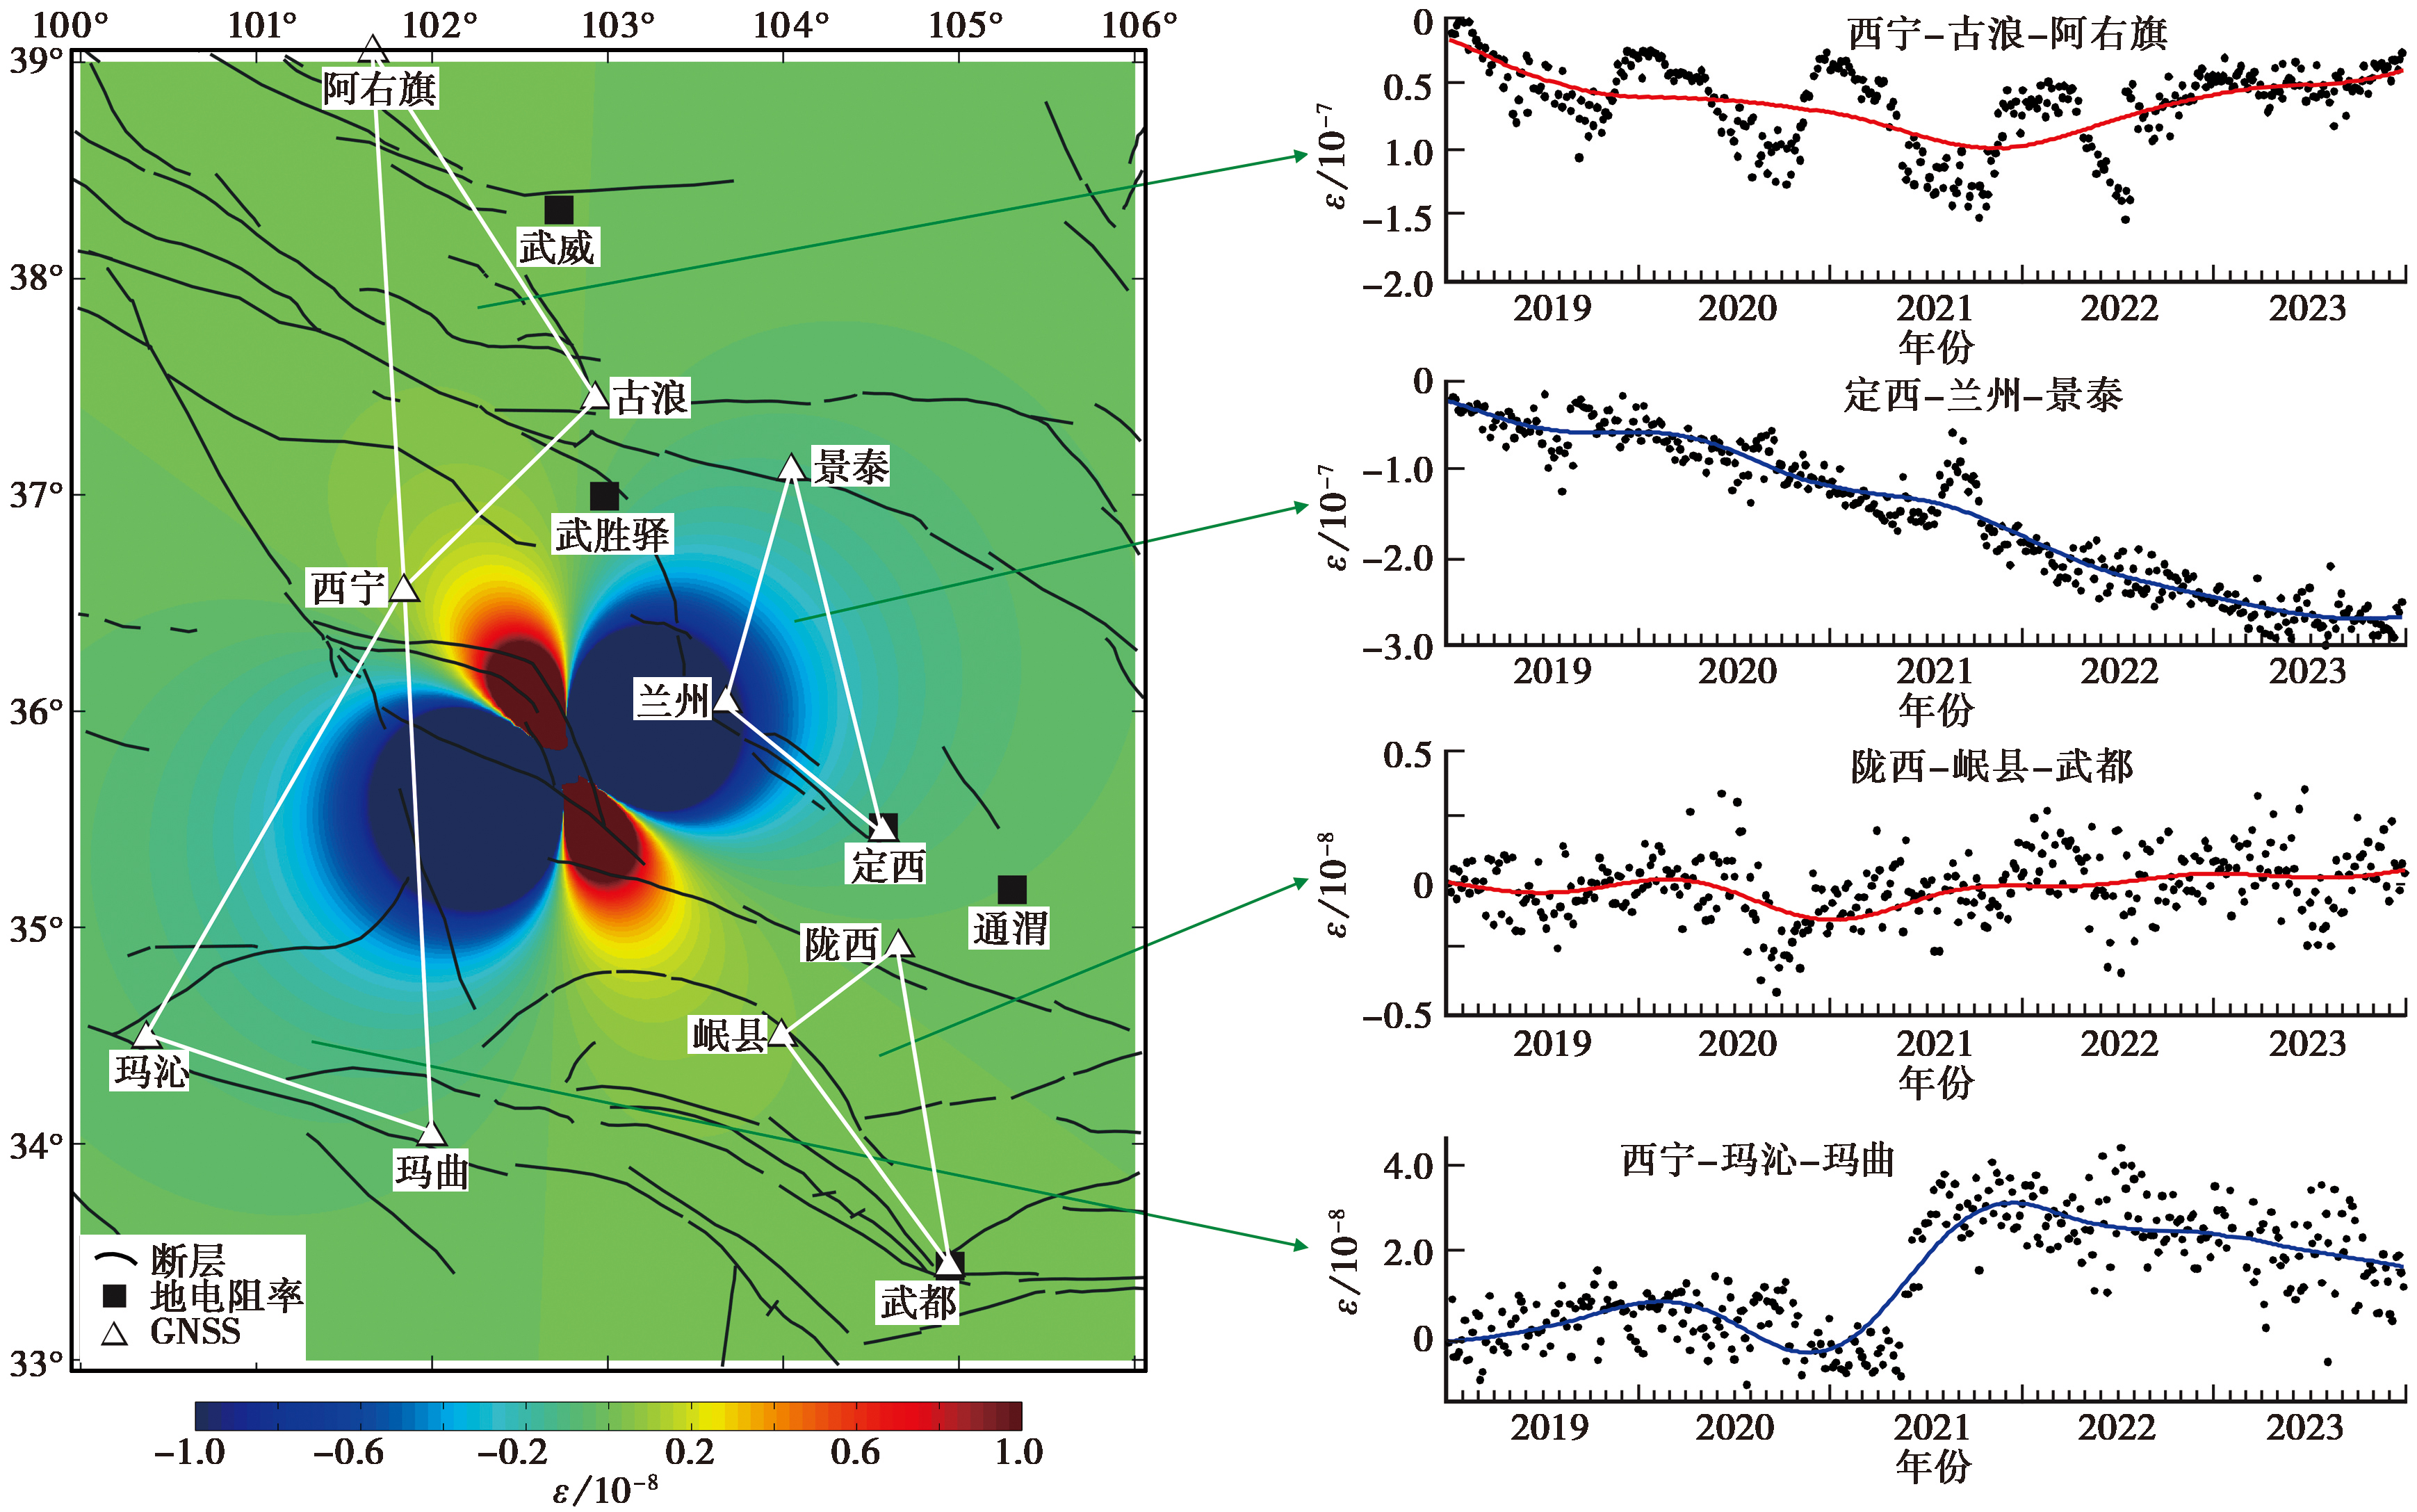
Fig. 27 Regional deformation before the 2023 MS6.2 Jishishan earthquake.
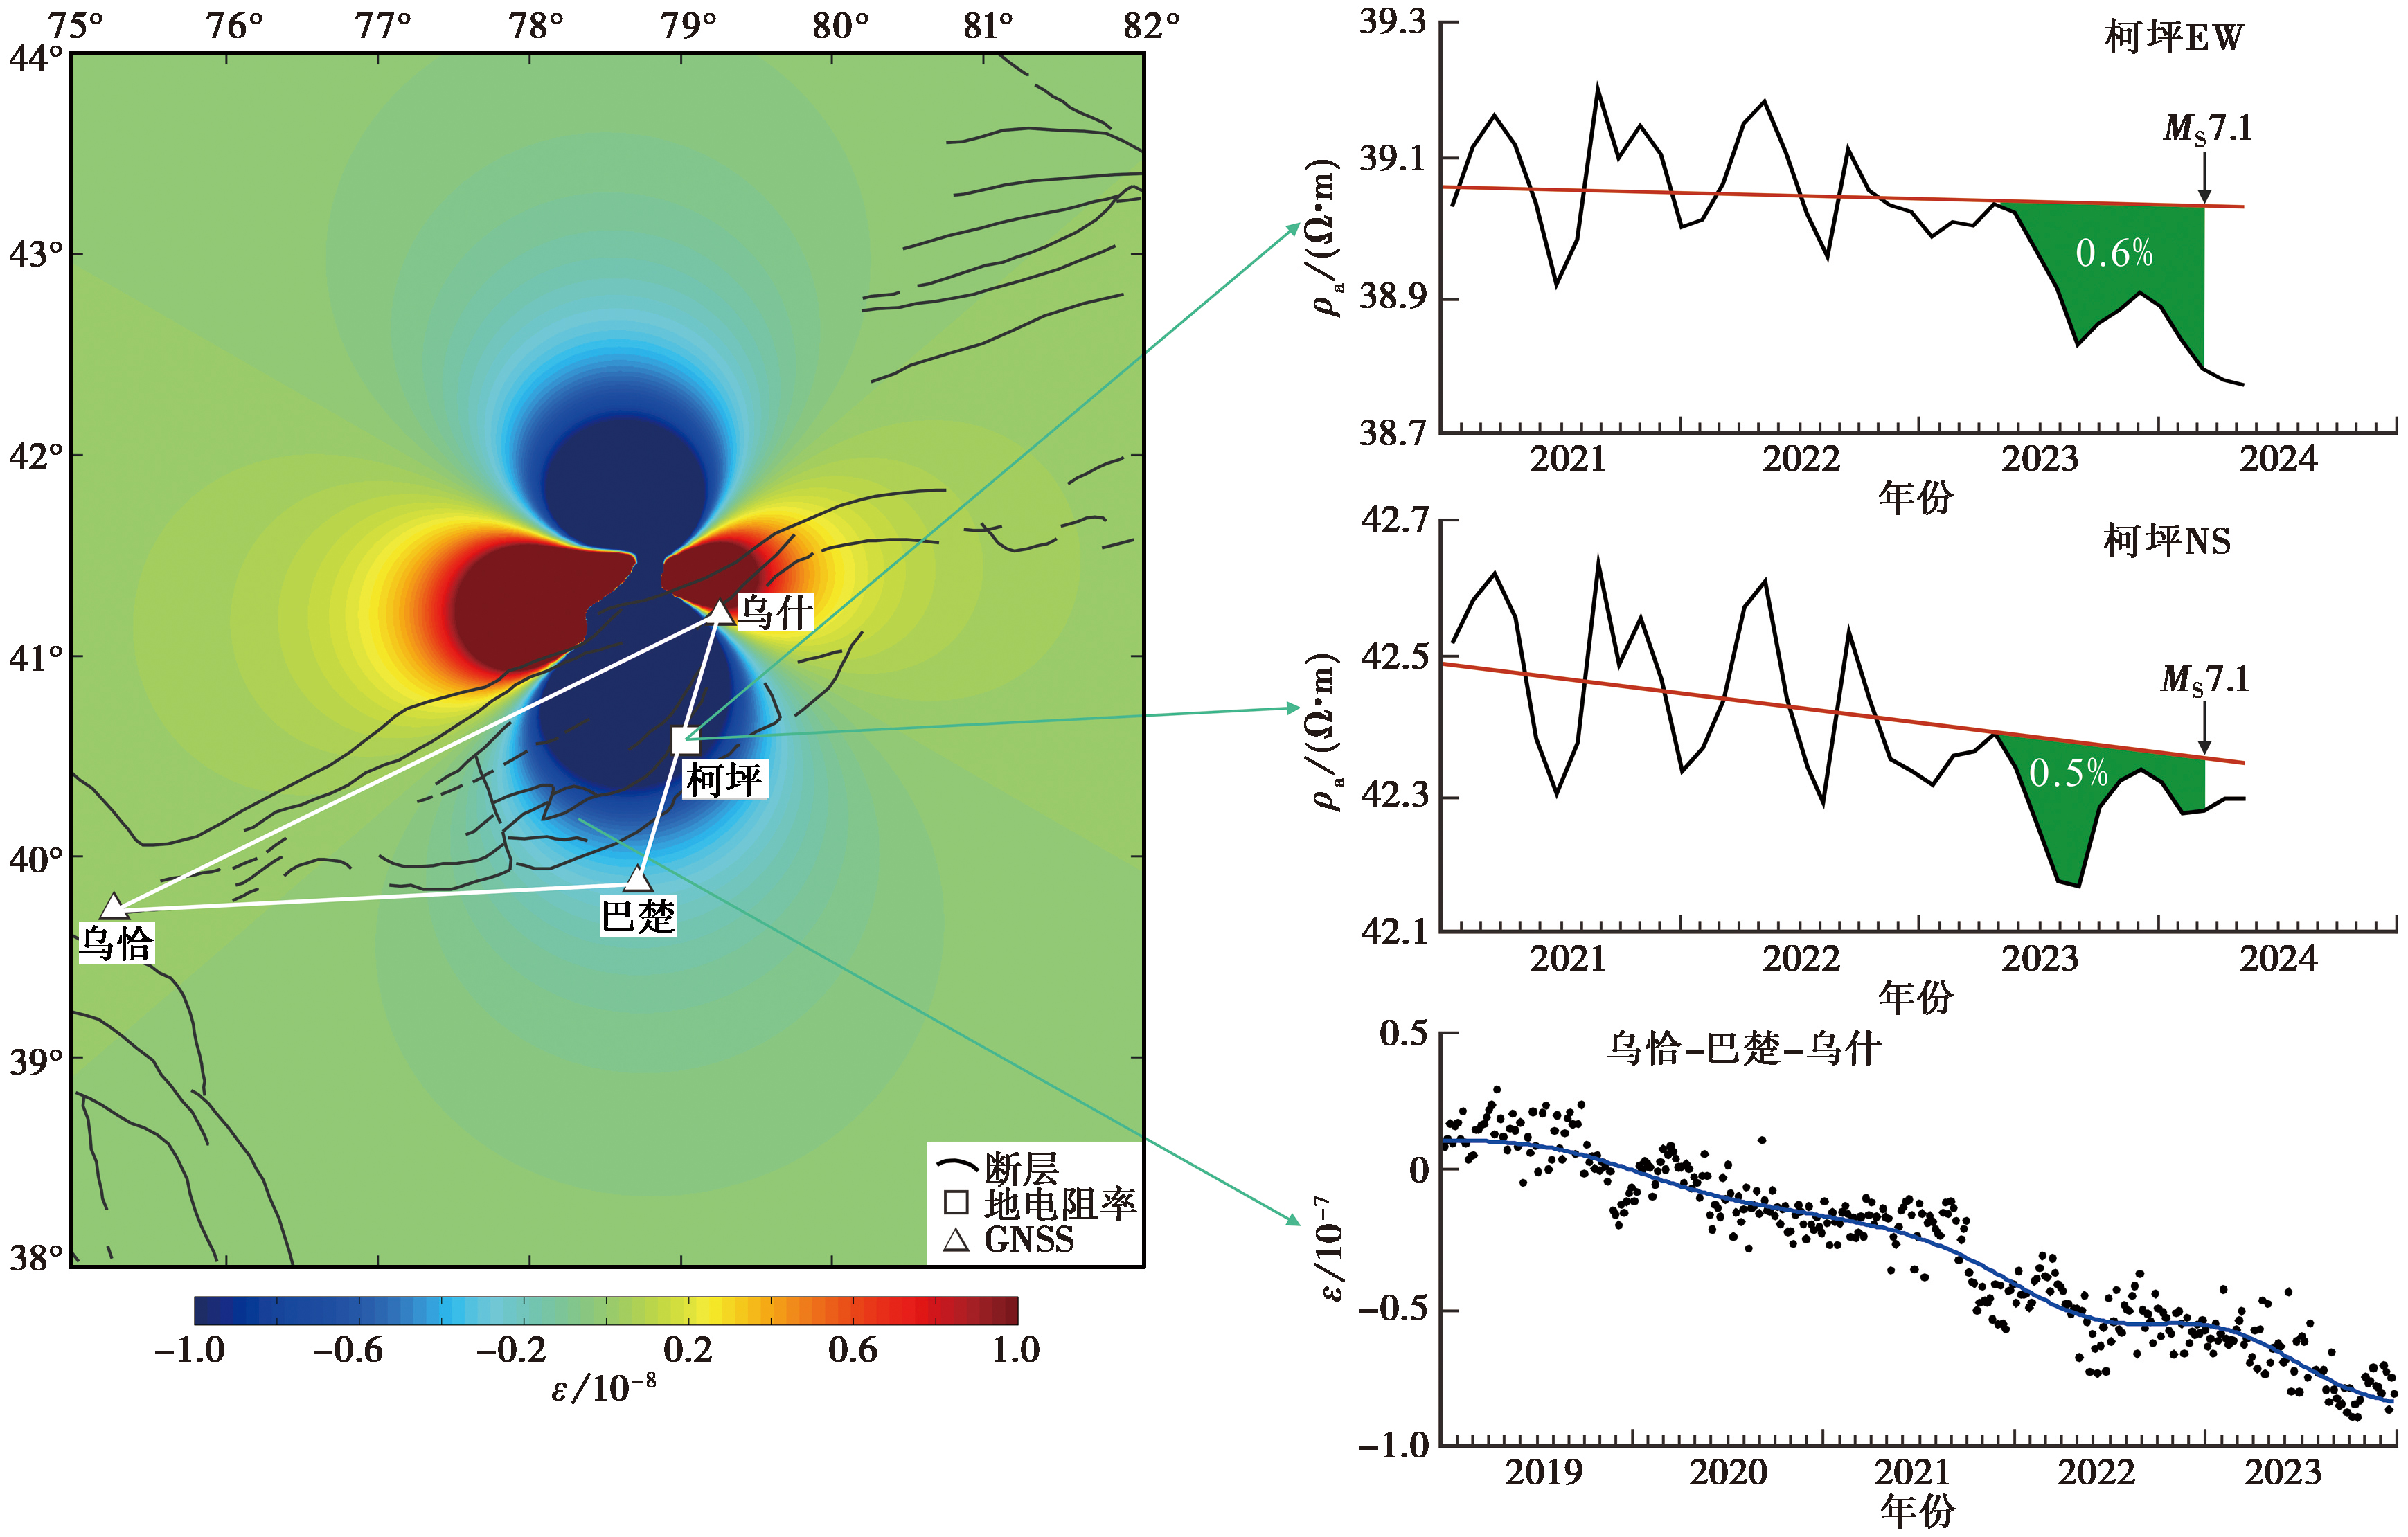
Fig. 28 Regional deformation and apparent resistivity anomaly changes before the 2024 MS7.1 Wushi earthquake.
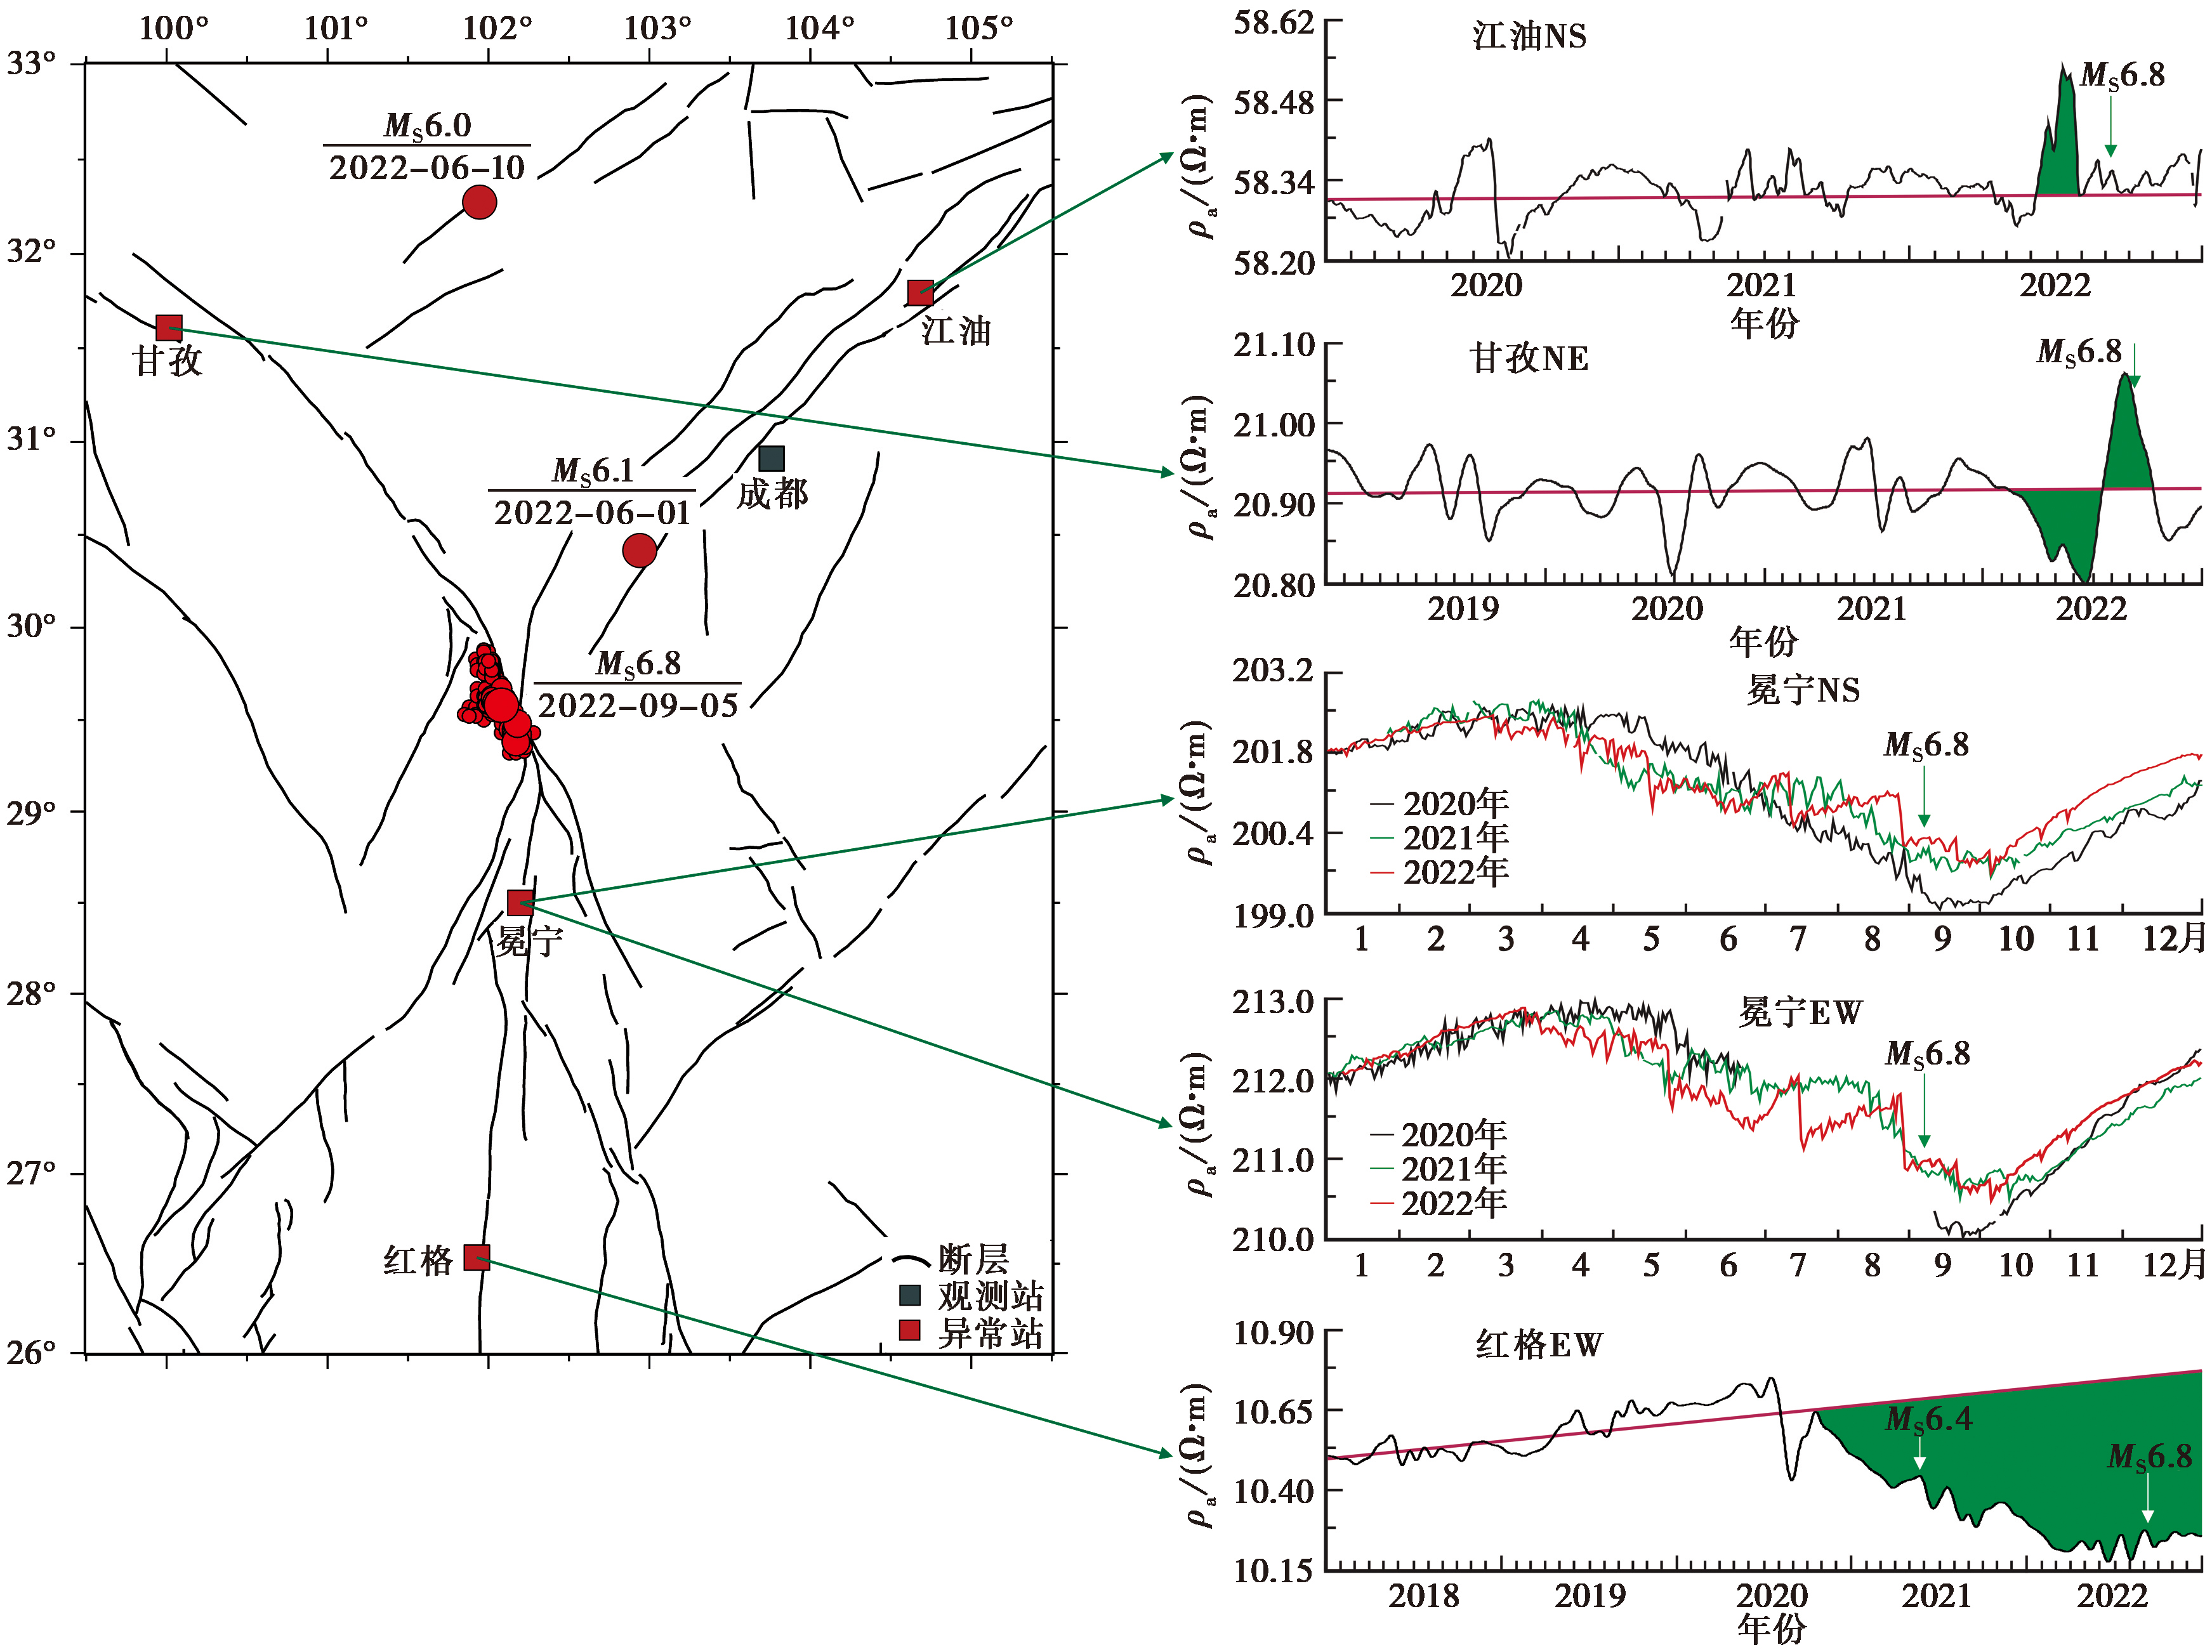
Fig. 29 Distribution of resistivity observation stations and anomaly changes before the 2022 MS6.8 Luding earthquake.
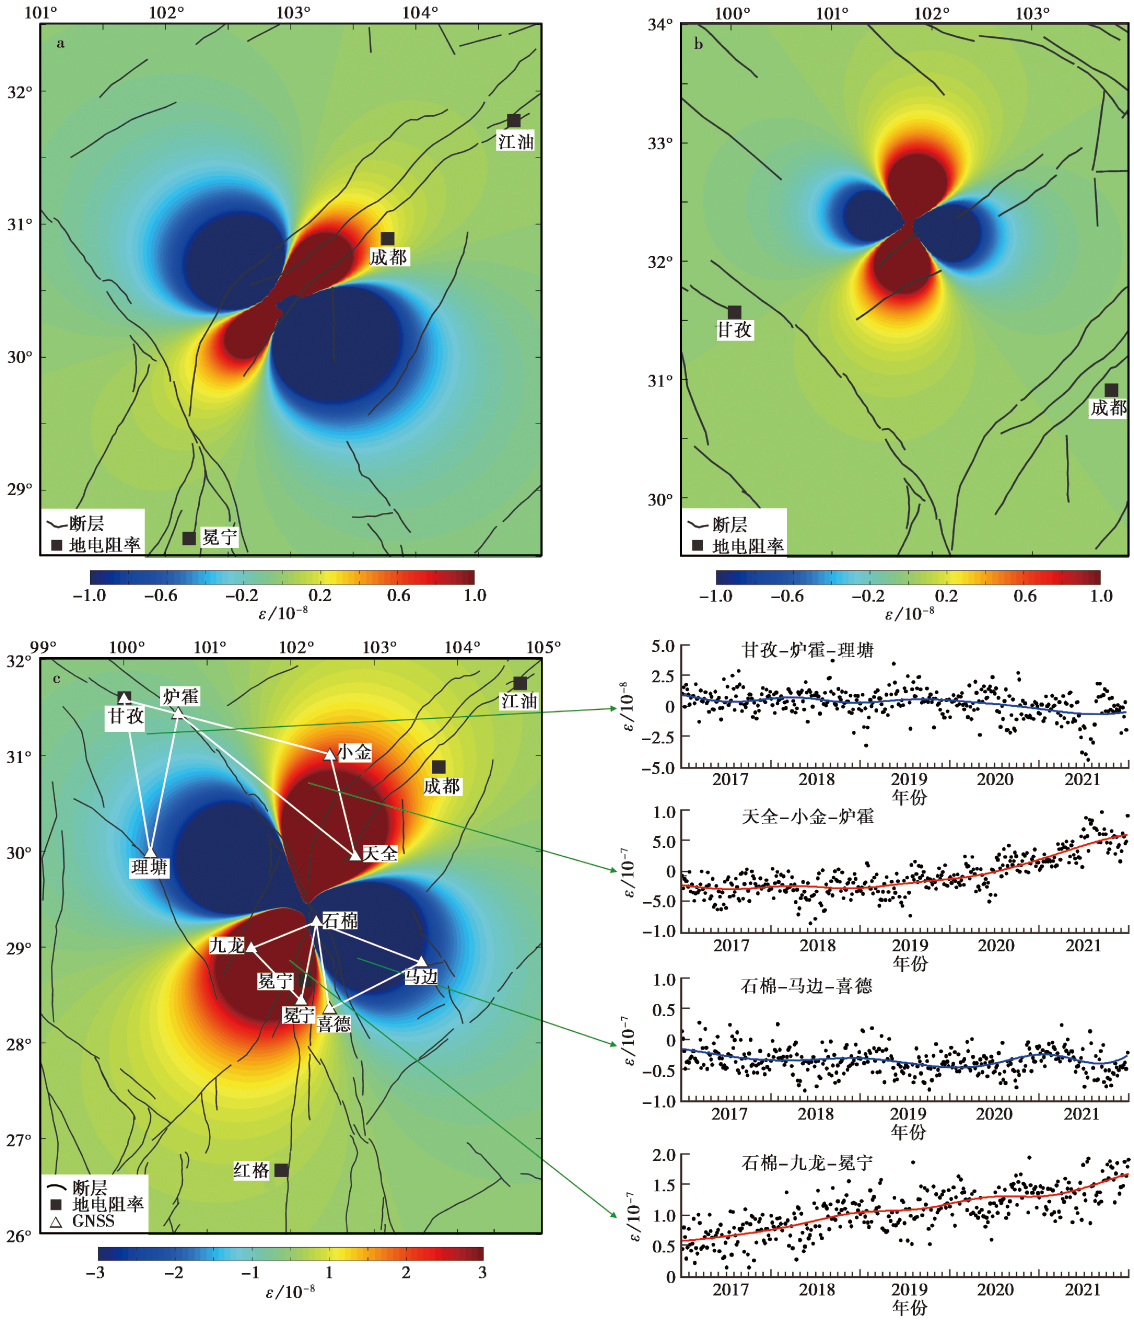
Fig. 30 Regional deformation before the three earthquakes with magnitude greater than 6 in 2022.
| [1] |
艾萨·伊斯马伊力, 冯志生, 陈界宏, 等. 2021. 地磁逐日比与新疆及周边地区强震关系[J]. 空间科学学报, 41(4): 617-625.
|
|
|
|
| [2] |
陈峰, 安金珍, 廖椿庭. 2003. 原始电阻率各向异性岩石电阻率变化的方向性[J]. 地球物理学报, 46(2): 271-280.
|
|
|
|
| [3] |
陈峰, 马麦宁, 安金珍. 2013. 承压介质电阻率变化的方向性与主应力的关系[J]. 地震学报, 35(1): 84-93.
|
|
|
|
| [4] |
陈运泰. 2007. 地震预测: 进展、困难与前景[J]. 地震地磁观测与研究, 28(2): 1-24.
|
|
|
|
| [5] |
陈运泰. 2009. 地震预测: 回顾与展望[J]. 中国科学(D辑), 39(12): 1633-1658.
|
|
|
|
| [6] |
杜学彬. 2010. 在地震预报中的2类视电阻率变化[J]. 中国科学(地球科学), 40(10): 1321-1330.
|
|
|
|
| [7] |
杜学彬, 李宁, 叶青, 等. 2007. 强地震附近视电阻率各向异性变化的原因[J]. 地球物理学报, 50(6): 1802-1810.
|
|
|
|
| [8] |
杜学彬, 刘君, 崔腾发, 等. 2015. 2次近距离大震前成都台视电阻率重现性、相似性和各向异性变化[J]. 地球物理学报, 58(2): 576-588.
DOI |
|
|
|
| [9] |
杜学彬, 孙君嵩, 陈军营. 2017. 地震预测中的地电阻率数据处理方法[J]. 地震学报, 39(4): 531-548.
|
|
|
|
| [10] |
杜学彬, 谭大诚. 2000a. 地电阻率1年尺度异常时空丛集与地震活动性[J]. 中国地震, 16(3): 283-292.
|
|
|
|
| [11] |
杜学彬, 薛顺章, 郝臻, 等. 2000b. 地电阻率中短期异常与地震的关系[J]. 地震学报, 22(4): 368-376.
|
|
|
|
| [12] |
杜学彬, 叶青, 马占虎, 等. 2008. 强地震附近电阻率对称四极观测的探测深度[J]. 地球物理学报, 51(6): 1943-1949.
|
|
|
|
| [13] |
傅征祥, 刘桂萍, 邵辉成, 等. 2005. 中国大陆百年(1901-2001年)浅源强震活动及生命损失回顾与分析[J]. 地震学报, 27(4): 367-376.
|
|
|
|
| [14] |
高曙德. 2020. 四川九寨沟7.0级地震前震情跟踪概述及震后总结[J]. 地球物理学进展, 35(4): 1250-1260.
|
|
|
|
| [15] |
国家地震局科技监测司. 1995. 地震电磁观测技术[M]. 北京: 地震出版社.
|
|
Science and Technology Monitoring Department of State Seismological Bureau. 1995. Seismic Electromagnetic Observation Technology[M]. Seismological Press, Beijing (in Chinese).
|
|
| [16] |
国家地震局预测预防司. 1998. 电磁学分析预报方法[M]. 北京: 地震出版社.
|
|
Prediction and Prevention Department of the State Seismological Bureau. 1998. Electromagnetic Analysis and Prediction Methods[M]. Seismological Press, Beijing (in Chinese).
|
|
| [17] |
胡庆东, 范宜仁, 王光海. 1993. 岩石特性与岩石电阻率关系及电阻率模型[J]. 世界石油科学, 10(3): 48-56.
|
|
|
|
| [18] |
姜礼尚, 庞之垣. 1980. 有限元方法及其理论基础[M]. 北京: 人民教育出版社.
|
|
|
|
| [19] |
金安忠. 1981. 地电阻率正常变化的初步研究[J]. 地球物理学报, 24(1): 92-106.
|
|
|
|
| [20] |
克维亚特柯夫斯基. 1959. 电法勘探[M]. 北京: 地质出版社.
|
|
КВЯТКОВСКНЙ Е M. 1959. Electrical Prospecting[M]. Geology Press, Beijing (in Chinese).
|
|
| [21] |
|
|
|
|
| [22] |
李新艳, 解滔, 刘小鹏, 等. 2024a. 2023年12月18日甘肃积石山 MS6.2 地震前地电阻率异常特征及机理分析[J]. 地球物理学报, 67(10): 3721-3734.
|
|
|
|
| [23] |
李新艳, 解滔, 曾宪伟, 等. 2024b. 断层虚位错模式揭示的2022年1月8日青海门源 MS6.9 地震前的地电阻率变化[J]. 地震学报, 46(2): 292-306.
|
|
|
|
| [24] |
李新艳, 曾宪伟, 李蒙亚, 等. 2025. 柯坪地电阻率在新疆南天山地震带中强地震前的响应[J]. 地震地质, 47(5): 1438-1455.
|
|
|
|
| [25] |
刘冠中, 马瑾, 张宏旭, 等. 2013. 二十年来蠕变和短基线观测反映的鲜水河断裂带活动特征[J]. 地球物理学报, 56(3): 878-891.
|
|
|
|
| [26] |
刘峡, 孙东颖, 马瑾, 等. 2014. GPS结果揭示的龙门山断裂带现今形变与受力: 与川滇地区其他断裂带的对比研究[J]. 地球物理学报, 57(4): 1091-1100.
|
|
|
|
| [27] |
马瑾. 1982. 岩石力学与地震预报[J]. 地震科学研究, 2(4): 37-42.
|
|
|
|
| [28] |
马瑾, 郭彦双. 2014. 失稳前断层加速协同化的实验室证据和地震实例[J]. 地震地质, 36(3): 547-561.
|
|
|
|
| [29] |
马瑾,
|
|
|
|
| [30] |
马玉川, 晏锐, 王广才, 等. 2022. 1976年唐山7.8级地震前地下水位变化与地震成核过程的关系[J]. 地球物理学报, 65(4): 1325-1335.
|
|
|
|
| [31] |
毛先进, 段炜, 杨玲英, 等. 2021. 分层均匀结构地电阻率影响系数一个重要特性普适性的证明[J]. 地震研究, 44(1): 129-132.
|
|
|
|
| [32] |
美国地质调查局. 1990. 地震中期预报的观测和物理基础[M]. 马丽, 张国民, 杨玉荣, 等, 译. 北京: 地震出版社.
|
|
United States Geological Survey. 1990. Observation and Physical Basis of Medium Term Earthquake Prediction[M]. MA Li, ZHANG Guo-min, YANG Yu-rong, et al., translation. Seismological Press, Beijing (in Chinese).
|
|
| [33] |
聂永安, 姚兰予. 2009. 成层半空间深埋电极产生的电位分布[J]. 中国地震, 25(3): 246-255.
|
|
|
|
| [34] |
钱复业, 赵玉林. 1986. 检测应力-应变的地电法[J]. 地震, 6(3): 49-56.
|
|
|
|
| [35] |
钱复业, 赵玉林. 1980. 地震前地电阻率变化十例[J]. 地震学报, 2(2): 186-197.
|
|
|
|
| [36] |
钱复业, 赵玉林, 黄燕妮. 1996. 地电阻率各向异性参量计算法及地震前兆实例[J]. 地震学报, 18(4): 480-488.
|
|
|
|
| [37] |
钱复业, 赵玉林, 于谋明, 等. 1982. 地震前地电阻率异常变化[J]. 中国科学(B辑), 12(9): 831-839.
|
|
|
|
| [38] |
钱家栋, 陈有发, 金安忠. 1985. 地电阻率法在地震预报中的应用[M]. 北京: 地震出版社.
|
|
|
|
| [39] |
钱家栋, 马钦忠, 李劭秾. 2013. 汶川 MS8.0 地震前成都台NE测线地电阻率异常的进一步研究[J]. 地震学报, 35(1): 4-17.
|
|
|
|
| [40] |
钱家栋, 张学民, 王亚璐, 等. 2018. 2008年汶川 MS8.0 地震前成都台NE向地电阻率趋势异常的数值模拟[J]. 地震, 38(2): 107-116.
|
|
|
|
| [41] |
单新建, 李彦川, 高志钰, 等. 2023. 2022年泸定 MS6.8 地震同震形变特征及周边强震危险性[J]. 科学通报, 68(8): 944-953.
|
|
|
|
| [42] |
宋春燕, 宋治平, 魏芸芸, 等. 2024. 2024年新疆乌什7.1级地震前兆异常特征及预测过程[J]. 中国地震, 40(3): 551-562.
|
|
|
|
| [43] |
苏瑞欢, 袁道阳, 郑文俊, 等. 2024. 2023年甘肃积石山 MS6.2 地震地表破裂及震害特征分析[J]. 地球物理学报, 67(9): 3454-3471.
|
|
|
|
| [44] |
孙其政, 吴书贵. 2007. 中国地震监测预报40年(1966-2006)[M]. 北京: 地震出版社.
|
|
|
|
| [45] |
汪志亮, 余素荣. 1989. 澜沧-耿马7.6级地震腾冲等台地电阻率异常特征[J]. 地震, 9(2): 42-47.
|
|
|
|
| [46] |
汪志亮, 郑大林, 余素荣. 2002. 地震地电阻率前兆异常现象[M]. 北京: 地震出版社.
|
|
|
|
| [47] |
王秉中. 2002. 计算电磁学[M]. 北京: 科学出版社.
|
|
|
|
| [48] |
王凯英, 郭彦双, 冯向东. 2018. 应力时空演化揭示出的汶川地震前亚失稳过程[J]. 地球物理学报, 61(5): 1883-1890.
DOI |
|
|
|
| [49] |
王兰炜, 张宇, 张世中, 等. 2015. 我国井下地电阻率观测技术现状分析[J]. 地震地磁观测与研究, 36(2): 75-102.
|
|
|
|
| [50] |
王志贤, 彭远黔. 1996. 地电阻率变化与孕震过程研究[J]. 地震, 16(4): 396-402.
|
|
|
|
| [51] |
武艳强, 黄立人, 陈长云, 等. 2016. 1976年唐山 MS7.8 地震同震及现今形变特征[J]. 地震学报, 38(4): 609-617.
|
|
|
|
| [52] |
武艳强, 江在森, 朱爽, 等. 2020. 中国大陆西部GNSS变形特征及其与M≥7.0强震孕育的关系[J]. 中国地震, 36(4): 756-766.
|
|
|
|
| [53] |
解滔, 韩盈, 于晨. 2023a. 2021-2022年川滇地区4次MS≥6.0地震前井下地电阻率观测的异常变化[J]. 地震地质, 45(6): 1370-1384.
|
|
|
|
| [54] |
解滔, 韩盈, 于晨, 等. 2025a. 2024年1月23日乌什 MS7.1 地震前柯坪地电阻率异常变化[J]. 中国地震, 41(1): 32-45.
|
|
|
|
| [55] |
解滔, 李飞, 沈红会, 等. 2013. 新沂地震台地电阻率反向年变分析[J]. 地震学报, 35(6): 856-864.
|
|
|
|
| [56] |
解滔, 卢军. 2015. 地电阻率三维影响系数及其应用[J]. 地震地质, 37(4): 1125-1135.
DOI |
|
DOI |
|
| [57] |
解滔, 卢军. 2016. 地表固定干扰源影响下地电阻率观测随时间变化特征分析[J]. 地震地质, 38(4): 922-936.
DOI |
|
DOI |
|
| [58] |
解滔, 卢军. 2020a. 横向不均匀性对视电阻率各向异性变化的影响和地震前电阻率变化深度[J]. 地震地质, 42(5): 1172-1187. doi: 10.3969/j.issn.0253-4967.2020.05.009.
|
|
|
|
| [59] |
解滔, 卢军. 2020b. 含裂隙介质中的视电阻率各向异性变化[J]. 地球物理学报, 63(4): 1675-1694.
|
|
|
|
| [60] |
解滔, 卢军. 2023b. 中国中强地震前地电阻率中短期异常特征及其可能原因[J]. 中国地震, 39(1): 45-63.
|
|
|
|
| [61] |
解滔, 卢军. 2023c. 地电阻率观测常见变化形态及其可能原因分析[J]. 中国地震, 39(1): 128-142.
|
|
|
|
| [62] |
解滔, 卢军, 杜学彬. 2022a. 自适应变化幅度方法提取直流视电阻率中短期异常[J]. 中国地震, 38(1): 52-60.
|
|
|
|
| [63] |
解滔, 卢军, 闫伟. 2019a. 地电阻率日变化成因分析[J]. 地震地质, 41(6): 1464-1480.
|
|
|
|
| [64] |
解滔, 任越霞, 廖晓峰, 等. 2023d. 2022年四川泸定 MS6.8 地震前地下介质视电阻率变化特征及其机理分析[J]. 地球物理学报, 66(4): 1428-1437.
|
|
|
|
| [65] |
解滔, 薛艳, 卢军. 2022b. 中国MS≥7.0地震前视电阻率变化及其可能原因[J]. 地球物理学报, 65(8): 3064-3077.
|
|
|
|
| [66] |
解滔, 于晨, 韩盈, 等. 2025b. 基于视电阻率观测对2023年12月18日甘肃积石山 MS6.2 地震的预测[J]. 中国地震, 41(1): 1-10.
|
|
|
|
| [67] |
解滔, 于晨, 卢军. 2019b. 开展小极距井下地电阻率观测的可行性分析[J]. 中国地震, 35(1): 14-24.
|
|
|
|
| [68] |
解滔, 于晨, 王亚丽, 等. 2020c. 基于断层虚位错模式讨论2008年汶川 MS8.0 地震前视电阻率变化[J]. 中国地震, 36(3): 492-501.
|
|
|
|
| [69] |
徐世浙. 1995. 地球物理中的边界单元法[M]. 北京: 科学出版社.
|
|
|
|
| [70] |
薛顺章, 温新民, 董永德, 等. 1994. 地电阻率预报地震新方法的研究[J]. 地震学报, 16(2): 227-234.
|
|
|
|
| [71] |
杨君妍, 孙文科, 洪顺英, 等. 2021. 2021年青海玛多7.4级地震的同震变形分析[J]. 地球物理学报, 64(8): 2671-2683.
DOI |
|
|
|
| [72] |
姚文斌. 1989. 电测深数值计算和解释入门[M]. 北京: 地震出版社.
|
|
|
|
| [73] |
叶青, 王晓, 杜学彬, 等. 2022. 中国地震井下地电阻率研究进展[J]. 吉林大学学报(地球科学版), 52(3): 669-683.
|
|
|
|
| [74] |
扎波罗夫斯基 A И. 1958. 苏联近年来在电法勘探方面的工作[J]. 地球物理学报, 7(1): 44-51.
|
|
|
|
| [75] |
张国苓, 王庆林, 乔子云, 等. 2017. 地表点电流对地电阻率观测的影响[J]. 中国地震, 33(1): 122-128.
|
|
|
|
| [76] |
张国民. 2013. 地震预测科学研究论文选[M]. 北京: 地震出版社.
|
|
|
|
| [77] |
张国民, 傅征祥, 桂燮泰, 等. 2001. 地震预报引论[M]. 北京: 科学出版社.
|
|
|
|
| [78] |
张海明, 陈晓非, 张似洪. 2001. 峰谷平均法及其在计算浅源合成地震图中的应用[J]. 地球物理学报, 44(6): 805-813.
|
|
|
|
| [79] |
张恒, 唐世斌, 王龙, 等. 2015. 压缩作用下岩石预置裂隙贯通机制的研究[J]. 应用力学学报, 32(5): 763-769.
|
|
|
|
| [80] |
张金铸, 陆阳泉. 1983. 不同三轴应力条件下岩石电阻率变化的试验研究[J]. 地震学报, 5(4): 440-445.
|
|
|
|
| [81] |
张克亮, 甘卫军, 梁诗明, 等. 2021. 2021年5月21日 MS6.4 漾濞地震GNSS同震变形场及其约束反演的破裂滑动分布[J]. 地球物理学报, 64(7): 2253-2266.
DOI |
|
|
|
| [82] |
张培震, 徐锡伟, 闻学泽, 等. 2008. 2008年汶川8.0级地震发震断裂的滑动速率复发周期和构造成因[J]. 地球物理学报, 51(4): 1066-1073.
|
|
|
|
| [83] |
张勇, 许力生, 陈运泰. 2009. 2008年汶川大地震震源机制解的时空变化[J]. 地球物理学报, 52(2): 379-389.
|
|
DOI URL |
|
| [84] |
张肇诚, 郑大林, 徐京华. 2000. 中国震例1989-1991[M]. 北京: 地震出版社.
|
|
|
|
| [85] |
张志强, 陈方方, 李宁, 等. 2020. 裂纹雁行分布岩体试样应力场特征与破坏模式研究[J]. 应用力学学报, 37(5): 2280-2288.
|
|
|
|
| [86] |
赵国泽, 张学民, 蔡军涛, 等. 2022. 中国地震电磁研究现状和发展趋势[J]. 中国科学(地球科学), 52(8): 1499-1615.
|
|
|
|
| [87] |
赵和云, 钱家栋. 1982. 地电阻率法中勘探深度和探测范围的理论讨论和计算[J]. 西北地震学报, 4(1): 40-56.
|
|
|
|
| [88] |
赵和云, 钱家栋. 1987. 郫县台多极距观测资料的反演和分析[J]. 中国地震, 3(增刊): 73-78.
|
|
|
|
| [89] |
赵静, 刘杰, 牛安福, 等. 2014. 大凉山次级块体周边断层的闭锁特征[J]. 地震地质, 36(4): 1135-1144. doi: 10.3969/j.issn.0253-4967.2014.04.016.
|
|
|
|
| [90] |
赵玉林, 卢军, 李正南, 等. 1996. 唐山地震应变-电阻率前兆及虚错动模式[J]. 地震学报, 18(1): 78-82.
|
|
|
|
| [91] |
赵玉林, 卢军, 张洪魁, 等. 2001. 电测量在中国地震预报中的应用[J]. 地震地质, 23(2): 277-285.
|
|
|
|
| [92] |
赵玉林, 钱复业. 1978. 唐山7.8级强震前震中周围形变电阻率的下降异常[J]. 地球物理学报, 21(3): 181-190.
|
|
|
|
| [93] |
赵玉林, 钱复业, 许同春. 1990. 岩土层受力时电阻率变化与应变的关系[J]. 地震学报, 12(1): 87-94.
|
|
|
|
| [94] |
赵玉林, 钱复业, 杨体成, 等. 1983. 原地电阻率变化的实验[J]. 地震学报, 5(2): 217-225.
|
|
|
|
| [95] |
赵跃辰, 刘小伟. 1984. 一种消除年变的数据处理方法[J]. 华北地震科学, 2(2): 65-69.
|
|
|
|
| [96] |
中国地震局监测预报司. 2000. 地震前兆异常落实工作指南[M]. 北京: 地震出版社.
|
|
Department of Earthquake Monitoring and Prediction of China Earthquake Administration. 2000. Guidelines for the Survey of Abnormal Earthquake Precursors[M]. Seismological Press, Beijing (in Chinese).
|
|
| [97] |
中国地震局监测预报司. 2010. 地震电磁学理论基础与观测技术[M]. 北京: 地震出版社.
|
|
Department of Earthquake Monitoring and Prediction of China Earthquake Administration. 2010. Basical Theory and Monitoring Techniques of Seismic Electromagnetics[M]. Seismological Press, Beijing (in Chinese).
|
|
| [98] |
DOI URL |
| [99] |
DOI URL |
| [100] |
|
| [101] |
DOI URL |
| [102] |
DOI URL |
| [103] |
DOI URL |
| [104] |
DOI URL |
| [105] |
DOI URL |
| [106] |
DOI URL |
| [107] |
DOI URL |
| [108] |
DOI |
| [109] |
|
| [110] |
|
| [111] |
DOI URL |
| [112] |
DOI URL |
| [113] |
DOI URL |
| [114] |
DOI URL |
| [115] |
DOI URL |
| [116] |
|
| [117] |
DOI URL |
| [118] |
|
| [119] |
DOI |
| [120] |
DOI URL |
| [121] |
DOI URL |
| [122] |
DOI URL |
| [123] |
DOI URL |
| [124] |
DOI URL |
| [125] |
PMID |
| [126] |
|
| [127] |
DOI URL |
| [128] |
DOI URL |
| [129] |
DOI URL |
| [130] |
|
| [131] |
DOI URL |
| [132] |
DOI URL |
| [133] |
|
| [134] |
DOI URL |
| [135] |
DOI URL |
| [136] |
|
| [137] |
DOI URL |
| [138] |
DOI URL |
| [139] |
DOI URL |
| [140] |
|
| [141] |
PMID |
| [142] |
DOI |
| [143] |
|
| [144] |
DOI URL |
| [145] |
|
| [146] |
DOI URL |
| [147] |
DOI URL |
| [148] |
|
| [149] |
|
| [150] |
DOI URL |
| [151] |
|
| [152] |
|
| [153] |
DOI URL |
| [154] |
DOI URL |
| [155] |
|
| [156] |
|
| [1] | LIU Chao, REN Zhi-kun, LIU Jin-rui, JI Hao-min, WU Zhi-qun, YU Si-han, LEI Qi-yun, DU Peng. EVIDENCE OF THE HOLOCENE ACTIVITY IN THE NORTHERN SEGMENT OF YANTONGSHAN FAULT [J]. SEISMOLOGY AND GEOLOGY, 2026, 48(3): 724-740. |
| [2] | WANG Xin, GAO Min, QIAO Ji-hua, XIANG Jian-bin, XU Yu-chen, FAN Ji-di. GRAVITY ISOSTASY AND DEEP SEISMOGENIC ENVIRONMENT IN THE MIDDLE SEGMENT OF THE TANLU FAULT ZONE [J]. SEISMOLOGY AND GEOLOGY, 2026, 48(3): 741-756. |
| [3] | LUO Xiang-fei, LI Zhong-liang, WANG Ze-yuan, YU Bo, JI Ji-fa, HAO Peng-fei, LIU Dong-yang, HE Wei-min. DEEP STRUCTURAL CHARACTERISTIC OF MAJOR FAULTS IN THE JIN-JI-MENG BOUNDARY AREA BASED ON BOUGUER GRAVITY DATA [J]. SEISMOLOGY AND GEOLOGY, 2026, 48(3): 774-796. |
| [4] | WANG Xiu-ying, ZHAO Guo-cun, FAN Xi-wei, GAO Peng, ZHANG Guo-hong, MA Zhi-xia, CHEN Xu-geng. STUDY ON THE TRIGGERING FACTOR OF THE LOESS LIQUE-FACTION INDUCED BY THE JISHISHAN EARTHQUAKE [J]. SEISMOLOGY AND GEOLOGY, 2026, 48(3): 797-813. |
| [5] | JIANG Ning-bo, LI Da-hu, ZUO Hong, WANG Chao-liang, GAO Mi, YI Gui-xi, CHEN Xue-fen. THREE DIMENSIONAL S-WAVE VELOCITY STRUCTURE AND SEISMICITY CHARACTERISTICS IN THE RONGXIAN-WEIYUAN-ZIZHONG AREA OF SOUTHERN SICHUAN [J]. SEISMOLOGY AND GEOLOGY, 2026, 48(3): 830-852. |
| [6] | DU Hao-guo, ZUO Xiao-qing, LIN Xu-chuan, LU Yong-kun, DU Hao-biao, CHEN Yong-sheng, LI Ji-chao, ZHANG Fang-hao, HE Shi-fang, DENG Shu-rong, ZHAO Zheng-xian, XU Jun-zu, BAI Xian-fu, ZHANG Yuan-shuo. PCA-BASED DAMAGED BUILDING CHANGE DETECTION MODEL USING UAV IMAGE TEXTURE FEATURES: CASE STUDIES OF THE 2023 GANSU JISHISHAN MS6.2 AND 2021 YUNNAN YANGBI MS6.4 EARTHQUAKES [J]. SEISMOLOGY AND GEOLOGY, 2026, 48(3): 870-891. |
| [7] | LI Yi-hang, ZHANG Zhi-hao, YUAN Qing-lu, DONG Yan-di, LIU Xue-tao, ZHANG Rui-cheng. RESEARCH ON THE INFLUENCE MECHANISM OF DISASTER SELF-RESCUE AND MUTUAL-RESCUE ATTITUDES AMONG MEGACITY RESIDENTS [J]. SEISMOLOGY AND GEOLOGY, 2026, 48(3): 907-920. |
| [8] | CHANG Yu-qiao, ZHANG Hui-ping, ZHAO Xu-dong. RESEARCH ADVANCES OF THE LATE QUATERNARY ACTIVITY OF XIAOJIANG FAULT ZONE IN THE SOUTHEASTERN MARGIN OF QINGHAI-XIZANG PLATEAU [J]. SEISMOLOGY AND GEOLOGY, 2026, 48(2): 279-313. |
| [9] | XIE Tao, HAN Ying, LI Xin-yan, YU Chen, LI Xiao-fan, ZHANG Guo-ling, ZHANG Li-qiong, LIAO Xiao-feng. A VIEW OF STRATIFIED RESPOSE BASED ON SHORT-TERM CHANGES OF APPARENT RESISTIVITY AFTER STRONG EARTHQUAKE [J]. SEISMOLOGY AND GEOLOGY, 2026, 48(2): 351-369. |
| [10] | WANG Wan-tong, MA Si-yuan, YAN Wu-jian, YUAN Ren-mao. LANDSLIDE SUSCEPTIBILITY ASSESSMENT OF THE 2014 LUDIAN EARTHQUAKE: COMPARATIVE STUDY BASED ON CONVOLUTIONAL NEURAL NETWORK AND RANDOM FOREST [J]. SEISMOLOGY AND GEOLOGY, 2026, 48(2): 497-519. |
| [11] | GUO Xin-xin, WEI Ben-yong, SU Gui-wu, QI Wen-hua, ZHANG Teng-fei. ASSESSING SEVERELY AFFECTED AREAS BY EARTHQUAKE USING MOBILE SIGNALLING DATA: A CASE STUDY OF THE 2023 MS6.2 JISHISHAN EARTHQUAKE, CHINA [J]. SEISMOLOGY AND GEOLOGY, 2026, 48(2): 520-539. |
| [12] | LIU Yue, LÜ Xiao-jian. A STUDY ON THE DURATION OF AFTERSHOCK SEQUENCES FOLLOWING SIX LARGE EARTHQUAKES IN North China [J]. SEISMOLOGY AND GEOLOGY, 2026, 48(1): 142-161. |
| [13] | ZHAO Xiao-yan, MENG Ling-yuan, PENG Guan-ling, WANG Guang-ming. CHARACTERISTICS OF EARTHQUAKE SEQUENCE TYPES WITH M≥5.0 IN YUNNAN AND ITS NEIGHBORING AREAS [J]. SEISMOLOGY AND GEOLOGY, 2026, 48(1): 162-180. |
| [14] | GU Pei-yuan, WAN Yong-ge, HUANG Ji-chao, JIN Zhi-tong, SONG Ze-yao, GUAN Zhao-xuan, ZHOU Zi-yao. SLIP CHARACTERISTICS OF THE SEISMOGENIC FAULT OF THE 2022 LUDING MS 6.6 EARTHQUAKE AND AN EXPLANA-TION FOR THE NORMAL-FAULTING EARTHQUAKE TO ITS WEST [J]. SEISMOLOGY AND GEOLOGY, 2026, 48(1): 181-199. |
| [15] | LI Chen, XING Hui-lin, YAO Qi, ZHONG Zhen-xiang. DYNAMIC SIMULATION OF DEFORMATION OF ACTIVE BLOCKS IN NORTH CHINA [J]. SEISMOLOGY AND GEOLOGY, 2026, 48(1): 233-256. |
| Viewed | ||||||
|
Full text |
|
|||||
|
Abstract |
|
|||||
Copyright © SEISMOLOGY AND GEOLOGY, All Rights Reserved.
Tel: 010-62009049/9063 E-mail: dzdz@ies.ac.cn
Powered by Beijing Magtech Co., Ltd.