地震地质 ›› 2021, Vol. 43 ›› Issue (6): 1563-1585.DOI: 10.3969/j.issn.0253-4967.2021.06.012
曹颖1)( ), 钱佳威2), 黄江培1), 张国权1), 付虹1)
收稿日期:2020-07-06
修回日期:2020-11-25
出版日期:2021-12-20
发布日期:2022-01-29
作者简介:曹颖, 女, 1988年生, 2018年于中国科技大学获地质工程专业工程硕士学位, 工程师, 主要从事地震监测工作和地震层析成像研究, E-mail: 976242105@qq.com。
基金资助:
CAO Ying1)(), QIAN Jia-wei2), HUANG Jiang-pei1), ZHANG Guo-quan1), FU Hong1)
Received:2020-07-06
Revised:2020-11-25
Online:2021-12-20
Published:2022-01-29
摘要:
为了获得2014年景谷 MS6.6 地震发生前后10a间震源区高空间分辨率的P波速度变化, 文中基于2008年1月1日—2017年12月31日由云南区域数字地震台网所记录的景谷地震震源区的地震资料, 首先采用双差层析成像方法联合绝对到时和相对到时反演了景谷地震震源区高分辨率的三维P波速度结构, 反演结果表明景谷地震的余震序列分布于P波高速异常区及低速异常区的交界处, 与澜沧江断裂有所相交的断裂处于低速异常区, 这可能与断层中的流体有关。然后采用基于双差层析成像的时移层析成像方法得到了不同时间段之间的P波速度变化的时空分布, 并结合已有的地质与地球物理研究成果, 对P波速度的变化特征及其机制进行了探究, 得到几点认识: 1)景谷主震震中附近浅层深度的P波速度最大降幅为0.2%, 在景谷主震发生2个月后出现, 主要受岩石破坏影响所致。2)5~15km深度处整体存在P波速度上升条带区域, 推测该区域为高强度、 高阻介质的脆韧性转换带, 不受主震发生的影响。在2014年12月6日 MS5.8 及 MS5.9 余震发生后, 余震分布方向发生了明显变化, 震源深度加深, 脆韧性转换带受其影响使得P波速度下降了3.8%。3)震后约3a, P波速度上升并超过震前水平, 可能在震源区的愈合过程中还包含了2018年9月8日云南墨江 MS5.9 地震发生前的应力积累过程。
中图分类号:
曹颖, 钱佳威, 黄江培, 张国权, 付虹. 利用时移层析成像方法分析2014年云南景谷MS6.6地震震源区的P波速度变化[J]. 地震地质, 2021, 43(6): 1563-1585.
CAO Ying, QIAN Jia-wei, HUANG Jiang-pei, ZHANG Guo-quan, FU Hong. P-WAVE VELOCITY CHANGES IN HYPOCENTER REGION OF THE 2014 JINGGU MS6.6 EARTHQUAKE USING TIME-LAPSE TOMOGRAPHY BASED ON DOUBLE-DIFFERENCE TOMOGRAPHY[J]. SEISMOLOGY AND EGOLOGY, 2021, 43(6): 1563-1585.
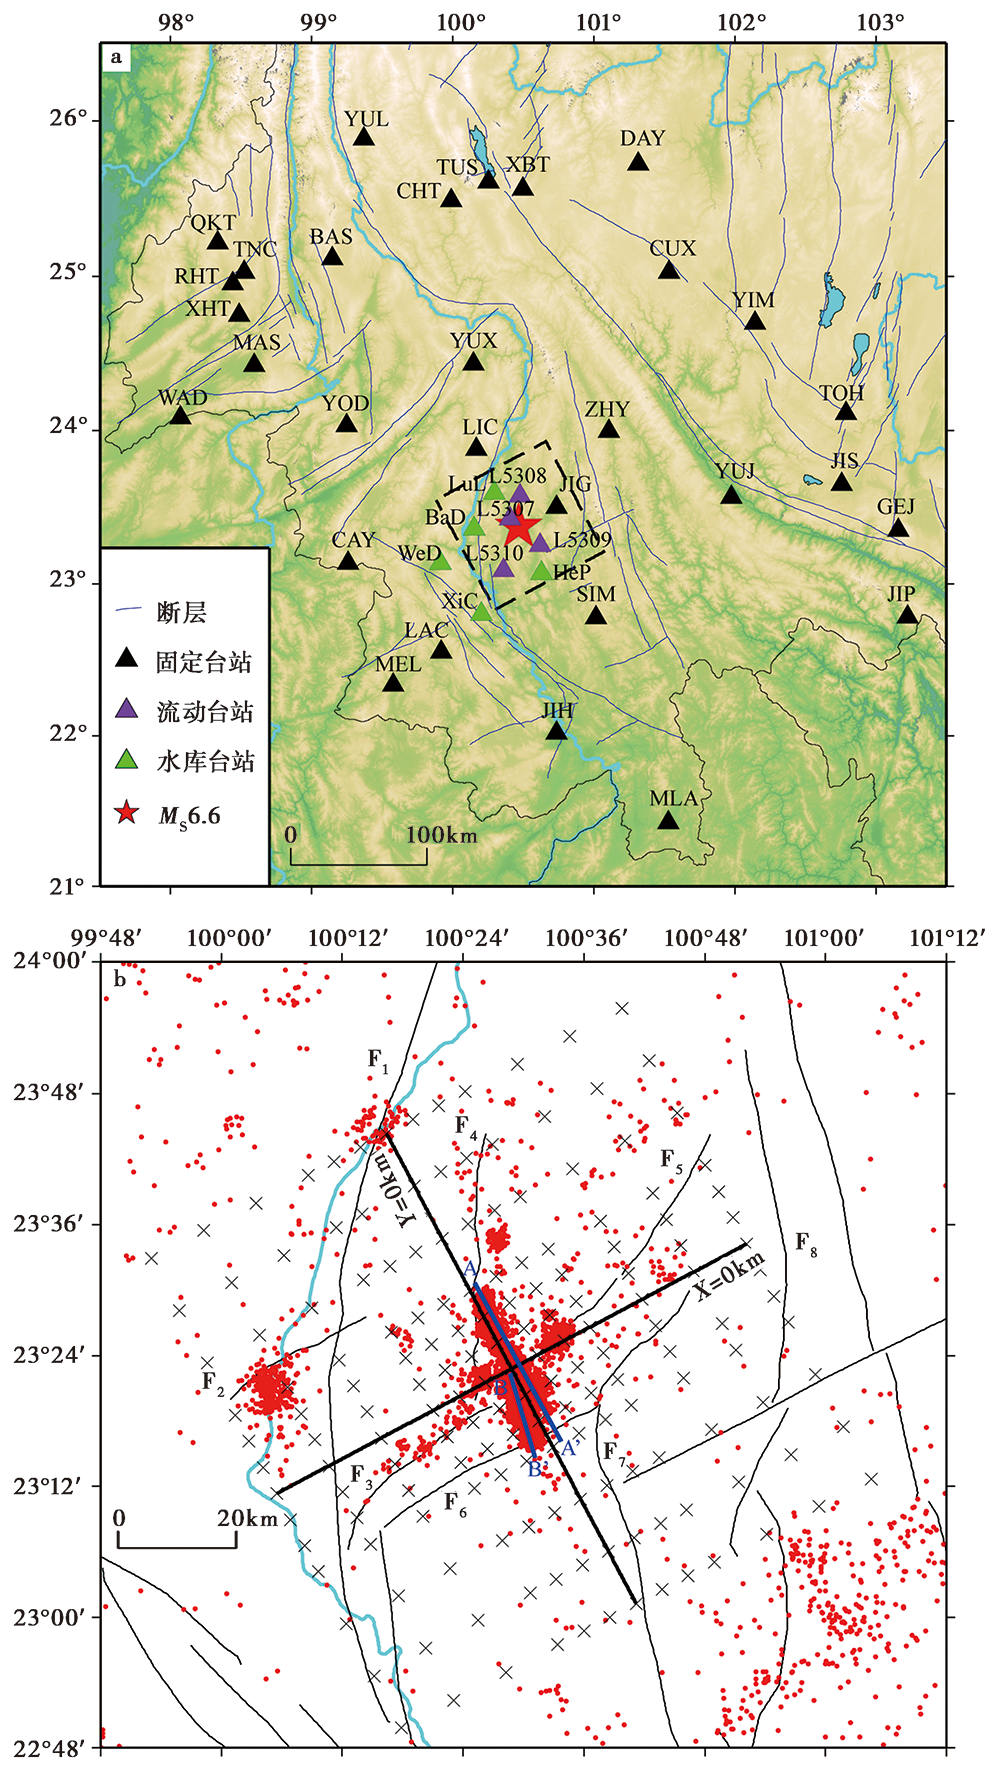
图 1 研究所用台站、 地震、 网格节点及活动断裂分布 a 所用台站分布; b 地震和网格节点分布。红色圆点表示地震, 黑色 “×”表示网格节点, 黑色实线表示断裂, 虚线框为研究区域。F1澜沧江断裂; F2 窝拖寨断裂; F3南谷断裂; F4永平盆地东缘断裂; F5威远江断裂; F6益香-赵家沟断裂F7景谷-云仙断裂; F8无量山断裂; F9普文断裂。地震数据为本文重定位数据, 断裂构造数据引自毛泽斌等(2019)
Fig. 1 Distribution of stations, earthquakes, grid nodes and faults in this study.
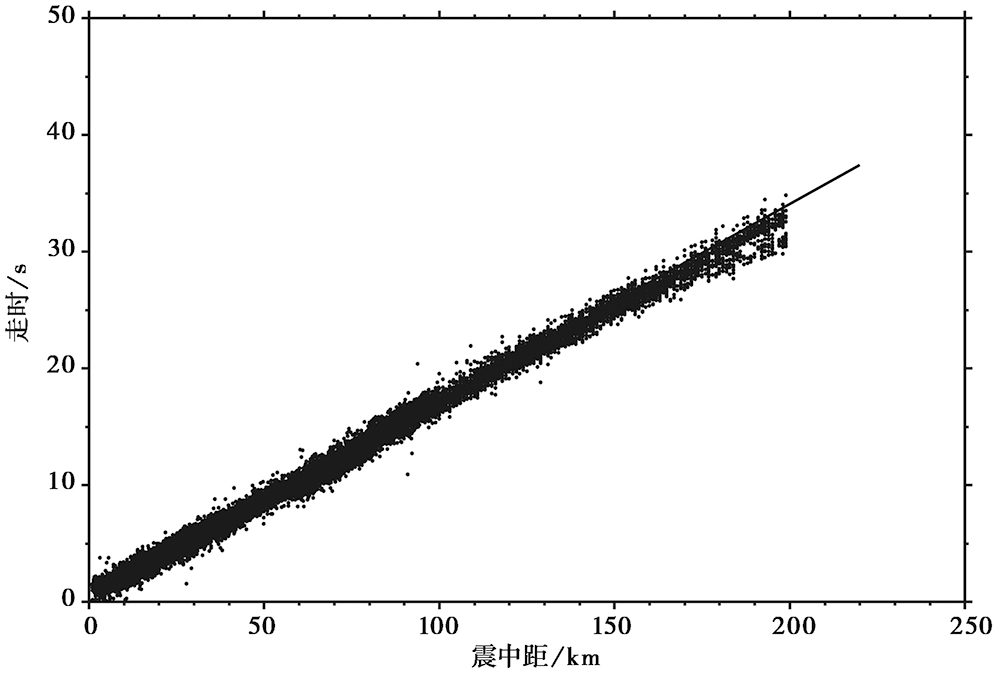
图 2 P波走时曲线
Fig. 2 Curve of P-wave travel times.
| 时间段 | 时间窗 | 台站数 /个 | 地震 数目 /个 | P波 绝对到时 /个 | P波 相对到时 /个 |
|---|---|---|---|---|---|
| P1 | 2008.01.01—2014.10.06 | 27 | 1 755 | 10 906 | 214 105 |
| P2 | 2014.10.07—2014.10.17 | 20 | 2 161 | 18 131 | 258 019 |
| P3 | 2014.10.18—2014.12.05 | 24 | 2 041 | 18 093 | 274 936 |
| P4 | 2014.12.06—2014.12.31 | 20 | 1 849 | 17 062 | 264 584 |
| P5 | 2015.01.01—2017.12.31 | 34 | 1 867 | 12 839 | 236 444 |
表1 5个时间段的数据
Table1 Data of five periods
| 时间段 | 时间窗 | 台站数 /个 | 地震 数目 /个 | P波 绝对到时 /个 | P波 相对到时 /个 |
|---|---|---|---|---|---|
| P1 | 2008.01.01—2014.10.06 | 27 | 1 755 | 10 906 | 214 105 |
| P2 | 2014.10.07—2014.10.17 | 20 | 2 161 | 18 131 | 258 019 |
| P3 | 2014.10.18—2014.12.05 | 24 | 2 041 | 18 093 | 274 936 |
| P4 | 2014.12.06—2014.12.31 | 20 | 1 849 | 17 062 | 264 584 |
| P5 | 2015.01.01—2017.12.31 | 34 | 1 867 | 12 839 | 236 444 |
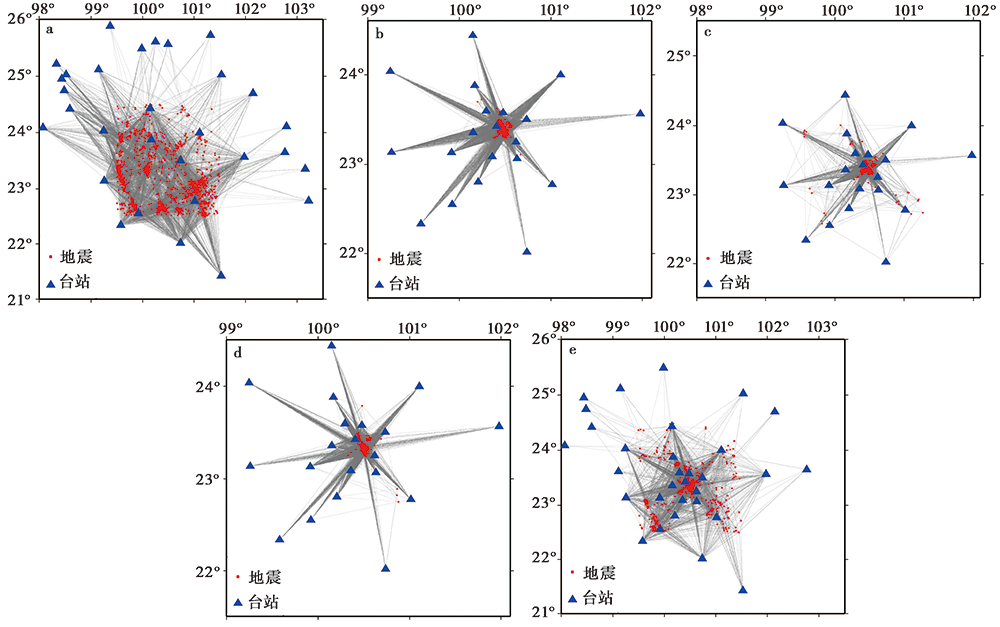
图 3 5个时间段的P波二维射线分布图 a 时间段1; b 时间段2; c 时间段3; d 时间段4; e 时间段5
Fig. 3 Distribution of 2-D P-wave ray paths for the five periods.
| 深度/km | P波速度/km·s-1 |
|---|---|
| 0 | 4.60 |
| 2 | 5.30 |
| 5 | 5.70 |
| 7 | 5.90 |
| 10 | 6.00 |
| 12 | 6.07 |
| 15 | 6.10 |
| 22 | 6.40 |
| 31 | 7.30 |
| 40 | 7.90 |
表2 一维P波速度模型
Table2 1D P wave velocity structure
| 深度/km | P波速度/km·s-1 |
|---|---|
| 0 | 4.60 |
| 2 | 5.30 |
| 5 | 5.70 |
| 7 | 5.90 |
| 10 | 6.00 |
| 12 | 6.07 |
| 15 | 6.10 |
| 22 | 6.40 |
| 31 | 7.30 |
| 40 | 7.90 |
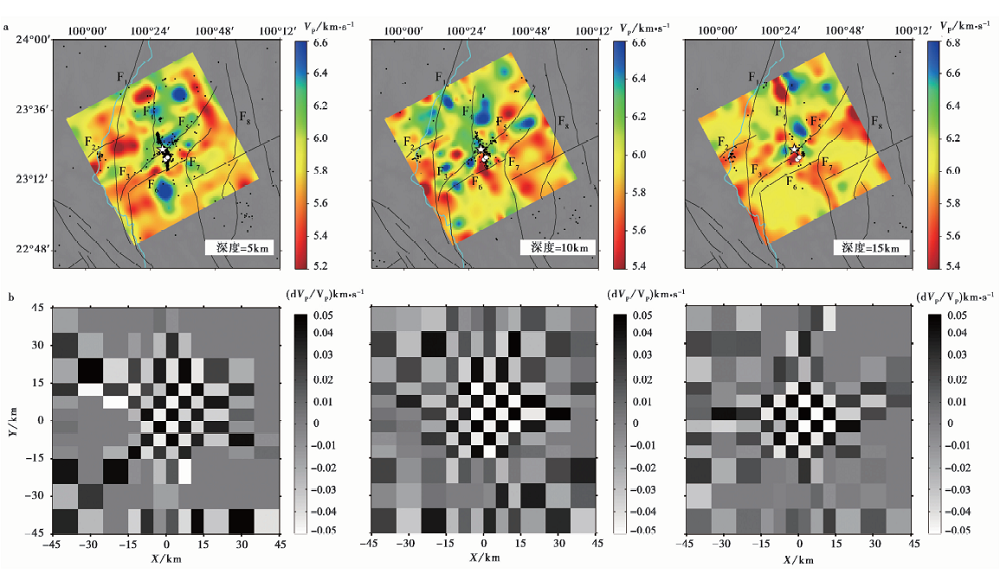
图 4 研究区不同深度处的P波速度结构和棋盘测试结果 a 不同深度处的P波速度结构; b 不同深度处的棋盘分辨率测试结果。黑色圆点表示地震震中, 白色五角星为 MS6.6 主震震中,白色圆点为 MS5.8 和 MS5.9 余震震中。F1澜沧江断裂; F2窝拖寨断裂; F3南谷断裂; F4永平盆地东缘断裂; F5威远江断裂;F6益香-赵家沟断裂; F7景谷-云仙断裂; F8无量山断裂。断裂构造数据引自毛泽斌等(2019)
Fig. 4 Distribution of P-wave velocity structure and checkerboard resolution test at different depth in the study area.
| 时间段 | P1 | P2 | P3 | P4 | P5 |
|---|---|---|---|---|---|
| 初始3D模型/s | 0.624 | 0.241 | 0.182 | 0.168 | 0.377 |
| 最终的3D模型/s | 0.214 | 0.046 | 0.048 | 0.050 | 0.052 |
| 下降百分比/% | 65.7 | 80.9 | 73.6 | 70 | 86.2 |
表3 5个时间段反演前后到时差的均方根残差变化
Table3 The RMS residuals between observed and predicted differential travel times based on initial 3D model and final 3D model for the five periods
| 时间段 | P1 | P2 | P3 | P4 | P5 |
|---|---|---|---|---|---|
| 初始3D模型/s | 0.624 | 0.241 | 0.182 | 0.168 | 0.377 |
| 最终的3D模型/s | 0.214 | 0.046 | 0.048 | 0.050 | 0.052 |
| 下降百分比/% | 65.7 | 80.9 | 73.6 | 70 | 86.2 |
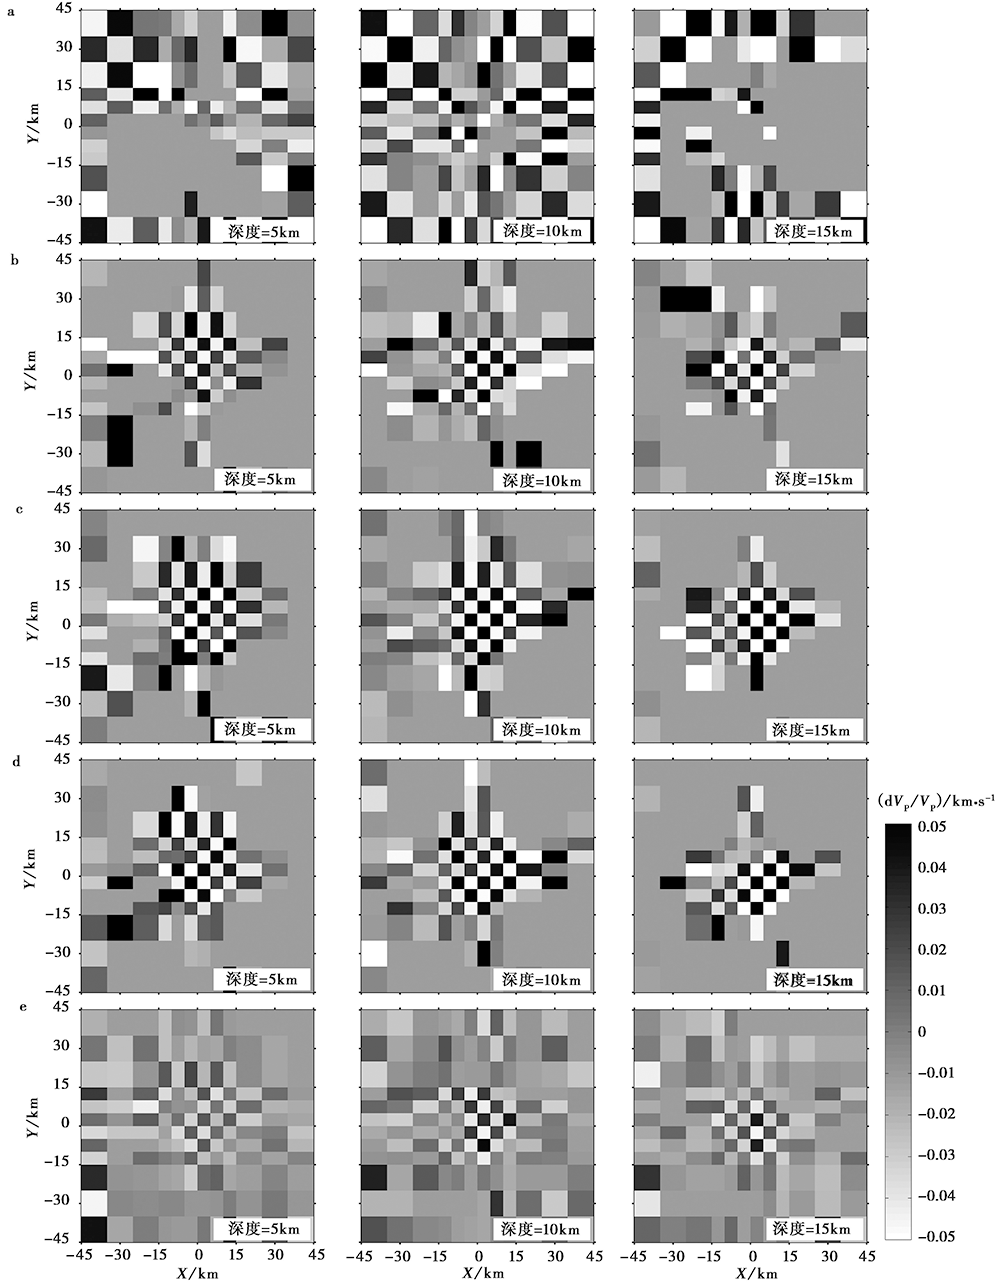
图 5 5个时间段不同深度处的P波速度棋盘测试结果 a—e依次对应时间段P1—P5
Fig. 5 Checkerboard resolution test of P-wave velocity for the five periods.
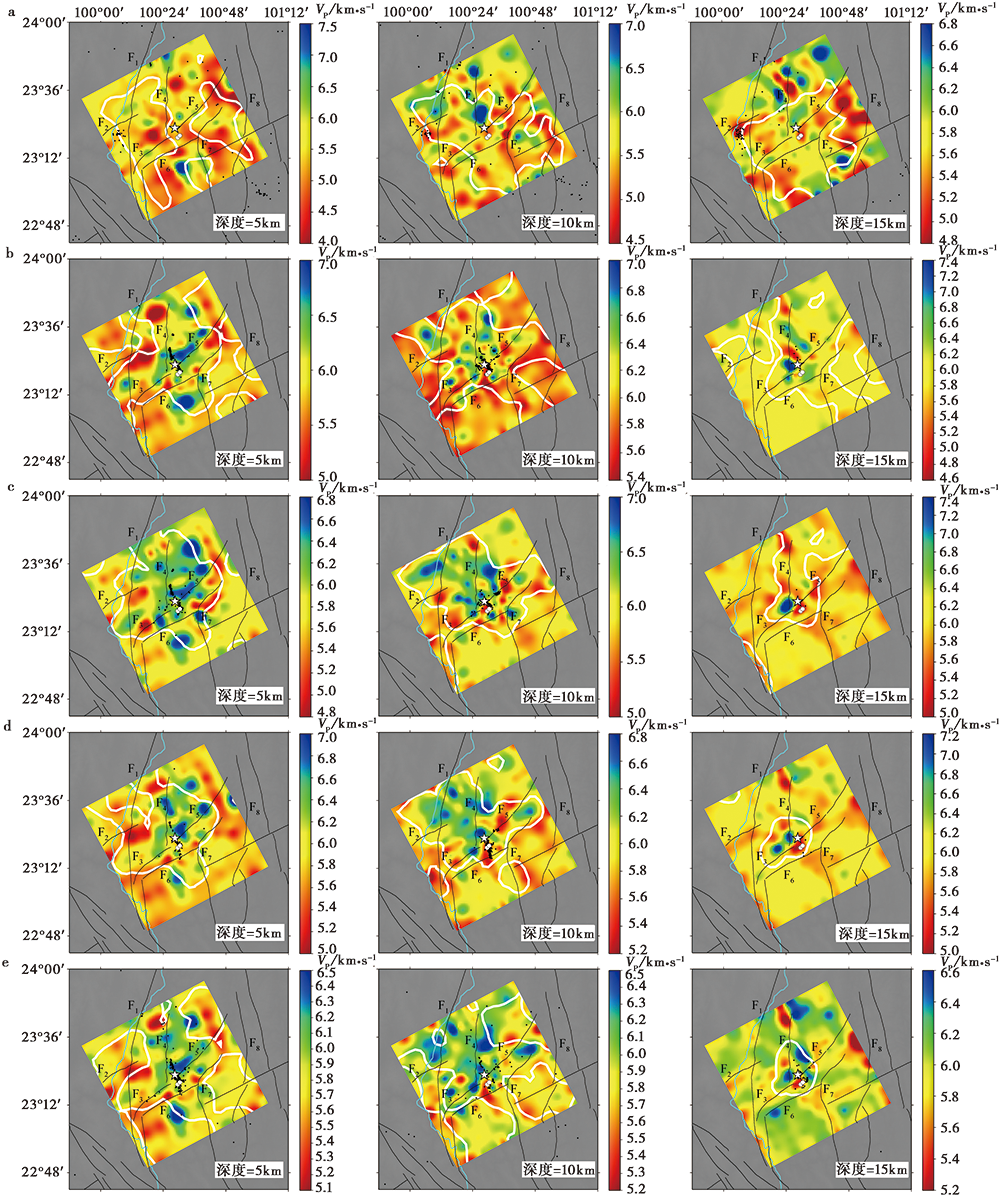
图 6 5个时间段不同深度处的P波速度结构和地震分布 a—e依次对应时间段P1—P5。黑色圆点为地震震中, 白色五角星为 MS6.6 主震震中, 白色圆点为 MS5.8 和 MS5.9 余震震中, 白色实线表示DWS>100的区域。F1澜沧江断裂; F2窝拖寨断裂; F3南谷断裂; F4永平盆地东缘断裂; F5威远江断裂; F6益香-赵家沟断裂; F7景谷-云仙断裂; F8无量山断裂。断裂构造数据引自毛泽斌等(2019)
Fig. 6 Distribution of P-wave velocity structure and earthquakes at different depths for the five periods.
| 时间段 | 所使用的地震数目/个 | 所用的台站数/个 | P波到时差/个 | 平均空间距离/km |
|---|---|---|---|---|
| P2相对于P1 | 3 913 | 38 | 45 844 | 10.9 |
| P3相对于P2 | 4 202 | 20 | 593 378 | 3.0 |
| P4相对于P3 | 3 890 | 20 | 438 637 | 3.1 |
| P5相对于P4 | 3 716 | 34 | 247 451 | 8.7 |
表4 不同时间段的数据
Table4 Data of different periods
| 时间段 | 所使用的地震数目/个 | 所用的台站数/个 | P波到时差/个 | 平均空间距离/km |
|---|---|---|---|---|
| P2相对于P1 | 3 913 | 38 | 45 844 | 10.9 |
| P3相对于P2 | 4 202 | 20 | 593 378 | 3.0 |
| P4相对于P3 | 3 890 | 20 | 438 637 | 3.1 |
| P5相对于P4 | 3 716 | 34 | 247 451 | 8.7 |
| 时间段 | P2相对于P1 | P3相对于P2 | P4相对于P3 | P5相对于P4 |
|---|---|---|---|---|
| 初始3D模型/s | 0.524 | 0.075 | 0.069 | 0.266 |
| 3D速度变化/s | 0.124 | 0.010 | 0.011 | 0.047 |
| 下降百分比/% | 76.3 | 86.7 | 84.1 | 82.3 |
表5 不同时间段反演前后到时差的均方根残差变化
Table5 The RMS residuals between observed and predicted differential travel times based on initial 3D model and final 3D model for the different periods
| 时间段 | P2相对于P1 | P3相对于P2 | P4相对于P3 | P5相对于P4 |
|---|---|---|---|---|
| 初始3D模型/s | 0.524 | 0.075 | 0.069 | 0.266 |
| 3D速度变化/s | 0.124 | 0.010 | 0.011 | 0.047 |
| 下降百分比/% | 76.3 | 86.7 | 84.1 | 82.3 |
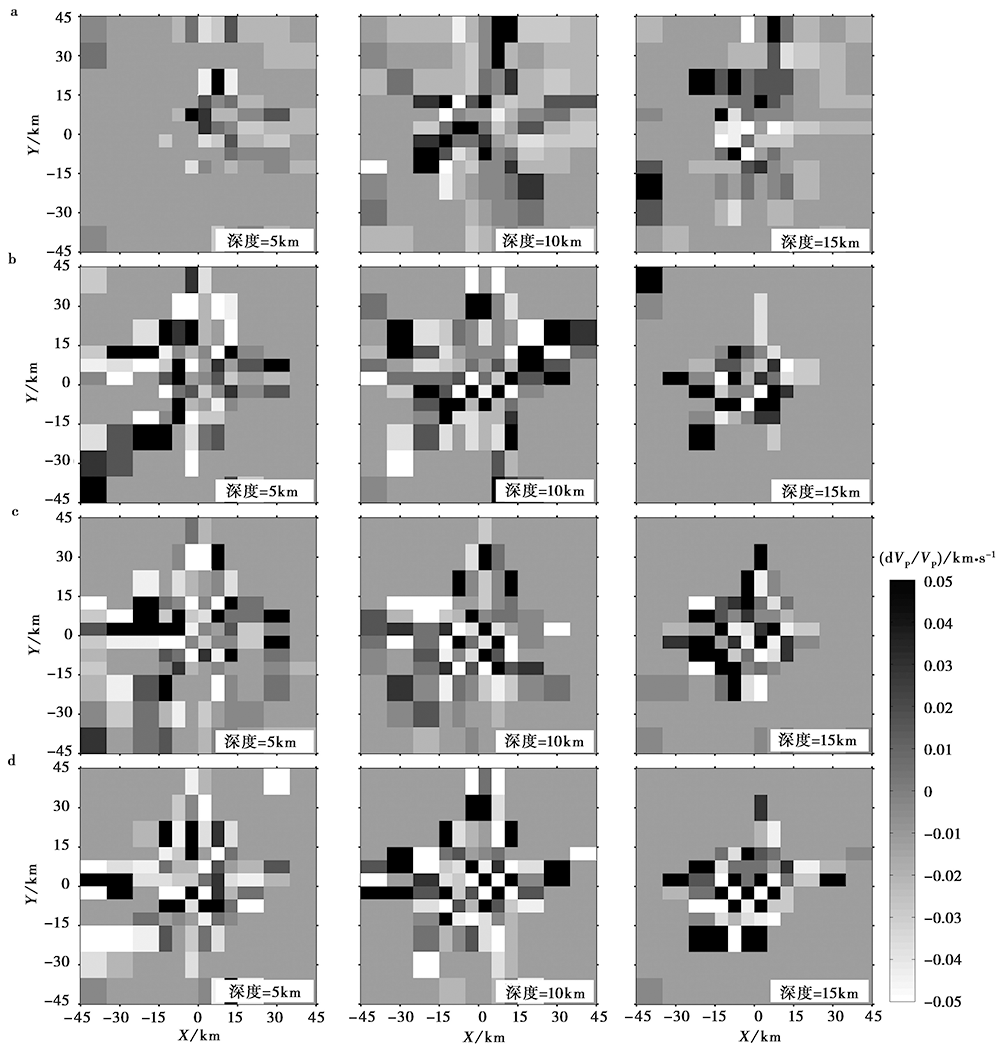
图 7 不同时间段之间在不同深度处的棋盘测试结果 a 时间段2相对于时间段1; b 时间段3相对于时间段2; c 时间段4相对于时间段3; d 时间段5相对于时间段4
Fig. 7 Recovered checkerboard models for different periods.
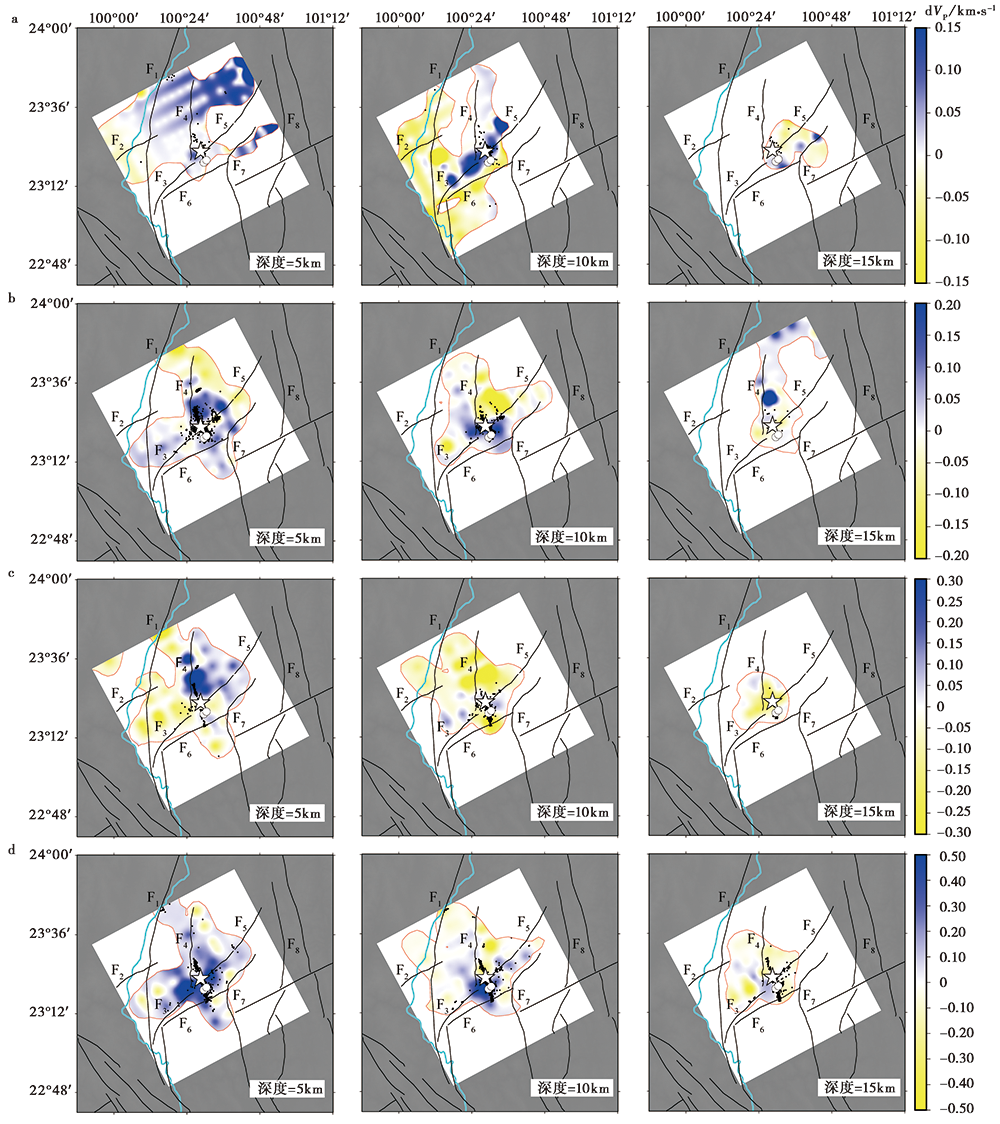
图 8 不同时间段之间在不同深度处的P波速度变化和地震分布 a 时间段2相对于时间段1; b 时间段3相对于时间段2; c 时间段4相对于时间段3; d 时间段5相对于时间段4。黑色圆点表示地震震中, 白色五角星为 MS6.6 主震震中, 白色圆点为 MS5.8 和 MS5.9 余震震中, 红色实线表示DWS>500的区域, DWS<500的区域被阴影化。F1澜沧江断裂; F2窝拖寨断裂; F3南谷断裂; F4永平盆地东缘断裂; F5威远江断裂F6益香-赵家沟断裂; F7景谷-云仙断裂; F8无量山断裂。断裂构造数据引自毛泽斌等(2019)
Fig. 8 Distribution of temporal P-wave velocity changes and earthquakes at different depths for different periods.
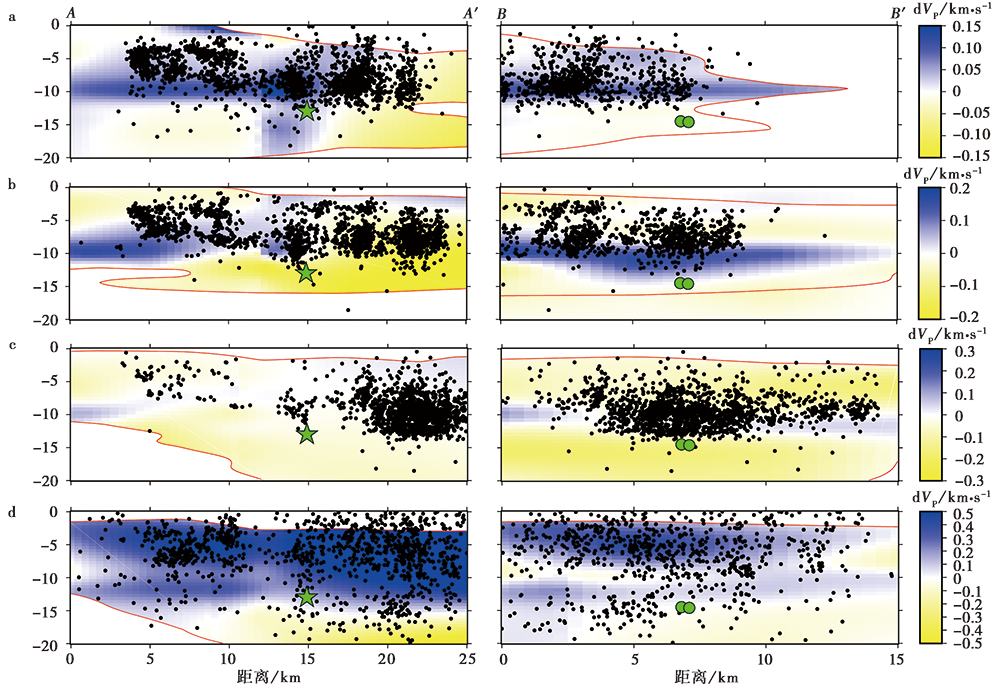
图 9 不同时间段之间的P波速度变化沿垂直剖面AA'和BB'的分布图(剖面位置见图1b) a P2相对于P1; b P3相对于P2; c P4相对于P3; d P5相对于P4。红色实线表示DWS>500的区域, DWS<500的区域被阴影化, 绿色五角星为 MS6.6 主震震源, 绿色圆形为 MS5.8 和 MS5.9 余震震源, 黑色圆点表示地震
Fig. 9 Distribution of temporal P-wave velocity changes along the cross sections AA', BB' for different periods.
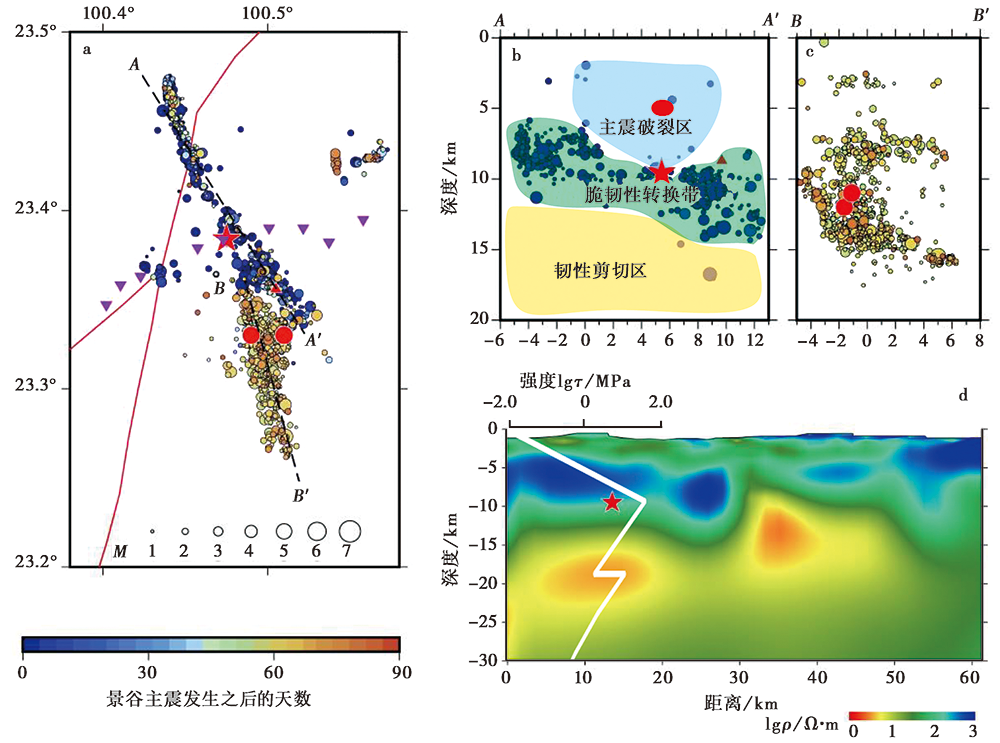
图 10 景谷地震序列分布图与震源区电性结构及岩石强度模型(改自王烁帆等, 2019) a 景谷地震余震分布图(Wang et al., 2018); b、 c 余震在2个剖面上的分布(Wang et al., 2018); d 景谷地震震源区电性结构模型(改自程远志等, 2016), 其中白色实线表示岩石强度随深度的变化曲线(数据源自孙玉军等, 2013)
Fig. 10 The hypocenter map of the Jinggu earthquake sequence and the electrical structure and rock strength model of the source area(after WANG Li-fang et al., 2019).
| [1] | 常祖峰, 陈晓利, 陈宇军, 等. 2016. 景谷 MS6.6 地震同震地表破坏特征与孕震构造[J]. 地球物理学报, 59(7): 2539-2552. |
| CHANG Zu-feng, CHEN Xiao-li, CHEN Yu-jun, et al. 2016. The co-seismic ground failure features and seismogenic structure of the Jinggu MS6.6 earthquake[J]. Chinese Journal of Geophysics, 59(7): 2539-2552(in Chinese). | |
| [2] | 陈飞. 2017. 利用面波与重力的联合反演确定中国大陆三维岩石圈速度结构[D]. 合肥: 中国科学技术大学: 30-38. |
| CHEN Fei. 2017. Lithospheric shear wave tomography of continental China by joint inversion of surface-wave and satellite gravity data[D]. University of Science and Technology of China, Hefei: 30-38(in Chinese). | |
| [3] | 陈浩, 陈晓非. 2016. 2014年10月7日云南景谷 MW6.2 地震震源机制解反演和重定位[J]. 地球物理学进展, 31(4): 1413-1418. |
| CHEN Hao, CHEN Xiao-fei. 2016. Focal mechanism inversion and relocation of the Yunnan Jinggu MW6.2 earthquake on 7 October 2014 [J]. Progress in Geophysics, 31(4): 1413-1418(in Chinese). | |
| [4] |
程远志, 汤吉, 邓琰, 等. 2016. 云南景谷 MS6.6 地震震源区深部电性结构及其孕震环境[J]. 地震地质, 38(2): 352-369. doi: 10.3969/j.issn.0253-4967.2016.02.010.
DOI |
| CHENG Yuan-zhi, TANG Ji, DENG Yan, et al. 2016. Electrical structure of upper crust in the source region of Jinggu Yunnan MS6.6 earthquake and the seismogenic environment[J]. Seismology and Geology, 38(2): 352-369(in Chinese). | |
| [5] | 邓起东, 于贵华, 叶文华. 1992. 活动断裂研究理论与应用(2)[M]. 北京: 地震出版社: 247-264. |
| DENG Qi-dong, YU Gui-hua, YE Wen-hua. 1992. Research on Active Fault: Theory and Applications(2)[M]. Seismological Press, Beijing: 247-264(in Chinese). | |
| [6] | 洪敏, 邵德盛, 王伶俐, 等. 2014. 利用GNSS连续站时间序列空间相关性提取区域形变异常[J]. 大地测量与地球动力学, 34(2): 175-182. |
| HONG Min, SHAO De-sheng, WANG Ling-li, et al. 2014. Using spatial correlation between continuous GNSS time series to achieve regional deformation anomalies[J]. Journal of Geodesy and Geodynamics, 34(2): 175-182(in Chinese). | |
| [7] | 李丹宁, 高洋, 朱慧宇, 等. 2017. 2014年云南景谷 MS6.6 地震序列双差定位及震源机制解特征研究[J]. 地震研究, 40(3): 465-473. |
| LI Dan-ning, GAO Yang, ZHU Hui-yu, et al. 2017. Research on double-difference relocation and focal mechanism solutions of the 2014 Yunnan Jinggu MS6.6 earthquake sequence[J]. Journal of Seismological Research, 40(3): 465-473(in Chinese). | |
| [8] |
李永华, 徐小明, 张恩会, 等. 2014. 青藏高原东南缘地壳结构及云南鲁甸、 景谷地震深部孕震环境[J]. 地震地质, 36(4): 1204-1216. doi: 10.3969/j.issn.0253-4967.2014.04.021.
DOI |
| LI Yong-hua, XU Xiao-ming, ZHANG En-hui, et al. 2014. Three-dimensional crust structure beneath SE Tibetan plateau and its seismotectonic implications for the Ludian and Jinggu earthquake[J]. Seismology and Geology, 36(4): 1204-1216(in Chinese). | |
| [9] | 刘瑞丰, 陈培善, 李强. 1993. 云南及其邻近地区三维速度图像[J]. 地震学报, 15(1): 61-67. |
| LIU Rui-feng, CHEN Pei-shan, LI Qiang. 1993. Three-dimension velocity images in Yunnan and the surrounding regions[J]. Acta Seismologica Sinica, 15(1): 61-67(in Chinese). | |
| [10] | 刘志坤, 黄金莉. 2010. 利用背景噪声互相关研究汶川地震震源区地震波速度变化[J]. 地球物理学报, 53(4): 853-863. |
| LIU Zhi-kun, HUANG Jin-li. 2010. Temporal changes of seismic velocity around the Wenchuan earthquake fault zone from ambient seismic noise correlation[J]. Chinese Journal of Geophysics, 53(4): 853-863(in Chinese). | |
| [11] |
毛泽斌, 常祖峰, 李鉴林, 等. 2019. 景谷M6.6地震震中区断裂晚第四纪活动[J]. 地震地质, 41(4): 821-836. doi: 10.3969/j.issn.0253-4967.2019.04.002.
DOI |
| MAO Ze-bin, CHANG Zu-feng, LI Jian-lin, et al. 2019. Late Quaternary activity of faults in the epicenter area of Jinggu M6.6 earthquake[J]. Seismology and Geology, 41(4): 821-836(in Chinese). | |
| [12] | 庞卫东, 杨润海, 许亚吉, 等. 2017. 利用背景噪声自相关研究2014年鲁甸 MS6.5 地震震区周边地壳波速变化[J]. 地震研究, 40(3): 491-501. |
| PANG Wei-dong, YANG Run-hai, XU Ya-ji, et al. 2017. Study on the crustal wave velocity variation around the 2014 Ludian MS6.5 earthquake area by background noise autocorrelation function[J]. Journal of Seismological Research, 40(3): 491-501(in Chinese). | |
| [13] | 孙玉军, 董树文, 范桃园, 等. 2013. 中国大陆及邻区岩石圈三维流变结构[J]. 地球物理学报, 56(9): 2936-2946. |
| SUN Yu-jun, DONG Shu-wen, FAN Tao-yuan, et al. 2013. 3D rheological structure of the continental lithosphere beneath China and adjacent regions[J]. Chinese Journal of Geophysics, 56(9): 2936-2946(in Chinese). | |
| [14] | 王俊, 郑定昌, 张金川, 等. 2020. 2013年芦山地震震源区地壳介质地震波速变化的特征分析[J]. 地球物理学报, 63(2): 517-531. |
| WANG Jun, ZHENG Ding-chang, ZHANG Jin-chuan, et al. 2020. Seismic velocity changes in the epicentral region of the 2013 Lushan earthquake measured from ambient seismic noise[J]. Chinese Journal of Geophysics, 63(2): 517-531(in Chinese). | |
| [15] | 王烁帆, 曾祥方, 王向腾, 等. 2019. 云南景谷地震震源深度: 新生断裂脆韧性转换带深度探讨[J]. 科学通报, 64(4): 474-484. |
| WANG Shuo-fan, ZENG Xiang-fang, WANG Xiang-teng, et al. 2019. Focal depth of the Yunnan Jinggu MW6.1 earthquake: Discussion on depth of the brittle-ductile transition zone of a young fault[J]. Chinese Science Bulletin, 64(4): 474-484(in Chinese). | |
| [16] | 温扬茂, 高松, 许才军. 2019. 利用双台站背景噪声分析2017年墨西哥 MW7.1 地震震源区的地震波速变化[J]. 地球物理学报, 62(8): 3024-3033. |
| WEN Yang-mao, GAO Song, XU Cai-jun. 2019. Seismic wave velocity change in hypocenter region of 2017 MW7.1 Mexico earthquake from ambient noise of two stations[J]. Chinese Journal of Geophysics, 62(8): 3024-3033(in Chinese). | |
| [17] | 吴坤罡, 吴中海, 徐甫坤, 等. 2016. 滇西南2014年景谷中-强震群的地质构造成因: 茶房-普文断裂带贯通过程的构造响应[J]. 地质通报, 35(1): 140-151. |
| WU Kun-gang, WU Zhong-hai, XU Fu-kun, et al. 2016. Geological origin of Jinggu earthquake swarm in 2014 in southwest Yunnan: A response to propagation process of the Chafang-Puwen fault zone[J]. Geological Bulletin of China, 35(1): 140-151(in Chinese). | |
| [18] |
谢张迪, 韩竹军. 2019. 2014年云南景谷 MS6.6 地震发震断层及其动力学参数[J]. 地震地质, 41(4): 887-912. doi: 10.3969/j.issn.0253-4967.2019.04.006.
DOI |
| XIE Zhang-di, HAN Zhu-jun. 2019. Study on the seismogenic fault and dynamics parameters of the 2014 MS6.6 Jinggu earthquake in Yunnan[J]. Seismology and Geology, 41(4): 887-912(in Chinese). | |
| [19] | 徐甫坤, 刘自凤, 张竹琪, 等. 2015. 2014年云南景谷 MS6.6 地震序列重定位与震源机制解特征[J]. 中国地质大学学报, 40(10): 1741-1754. |
| XU Fu-kun, LIU Zi-feng, ZHANG Zhu-qi, et al. 2015. Double difference relocation and focal mechanisms of the Jinggu MS6.6 earthquake sequence in Yunnan Province in 2014[J]. Journal of China University of Geosciences, 40(10): 1741-1754(in Chinese). | |
| [20] |
徐锡伟, 程佳, 许冲, 等. 2014. 青藏高原块体运动模型与地震活动主体地区讨论: 鲁甸和景谷地震的启示[J]. 地震地质, 36(4): 1116-1134. doi: 10.3969/j.issn.0253-4967.2014.04.015.
DOI |
| XU Xi-wei, CHENG Jia, XU Chong, et al. 2014. Discussion on block kinematic model and future themed areas for earthquake occurrence in the Tibetan plateau: Inspiration from the Ludian and Jinggu earthquake[J]. Seismology and Geology, 36(4): 1116-1134(in Chinese). | |
| [21] | 赵盼盼, 陈九辉, 刘启元, 等. 2012. 汶川地震区地壳速度相对变化的环境噪声自相关研究[J]. 地球物理学报, 55(1): 137-145. |
| ZHAO Pan-pan, CHEN Jiu-hui, LIU Qi-yuan, et al. 2012. Crustal velocity changes associated with the Wenchuan M8.0 earthquake by auto-correlation function analysis of seismic ambient noise[J]. Chinese Journal of Geophysics, 55(1): 137-145(in Chinese). | |
| [22] | Crampin S, Booth D C, Evans R, et al. 1990. Changes in shear-wave splitting at Anza near the time of the North Palm Springs earthquake[J]. Journal of Geophysical Research: Solid Earth, 95(B7): 11197-11212. |
| [23] |
Foulger G R, Grant C C, Ross A, et al. 1997. Industrially induced changes in Earth structure at the Geysers geothermal area, California[J]. Geophysical Research Letters, 24(2): 135-137.
DOI URL |
| [24] | Gunasekera R C, Foulger G R, Julian B R. 2003. Reservoir depletion at the Geysers geothermal area, California, shown by four-dimensional seismic tomography[J]. Journal of Geophysical Research: Solid Earth, 108(B3): 2134. |
| [25] |
Julian B R, Foulger G R. 2010. Time-dependent seismic tomography[J]. Geophysical Journal International, 182(3): 1327-1338.
DOI URL |
| [26] |
Koulakov I, Gladkov V, Khrepy S E I, et al. 2016. Application of repeated passive source travel time tomography to reveal weak velocity changes related to the 2011 Tohoku-Oki MW9.0 earthquake[J]. Journal of Geophysical Research: Solid Earth, 121(6): 4408-4426.
DOI URL |
| [27] |
Li Y G, Vidale J E, Aki K, et al. 1998. Evidence of shallow fault zone strengthening after the 1992 M 7.5 Landers, California, earthquake[J]. Science, 279(5348): 217-219.
PMID |
| [28] |
Nishimura T, Uchida N, Sato H, et al. 2000. Temporal changes of the crustal structure associated with the M6.1 earthquake on September 3, 1998, and the volcanic activity of Mount Iwate, Japan[J]. Geophysical Research Letters, 27(2): 269-272.
DOI URL |
| [29] | Obermann A, Froment B, Larose E, et al. 2013. Seismic noise correlations to image structural and mechanical changes associated with the MW7.9 2008 Wenchuan earthquake[J]. ournal of Geophysical Research: Solid Earth, 118(12): 6285-6294. |
| [30] |
Patane D, Barberi G, Cocina O, et al. 2006. Time-resolved seismic tomography detects magma intrusions at Mount Etna[J]. Science, 313(5788): 821-823.
DOI URL |
| [31] |
Pei S, Niu F, Ben-Zion Y, et al. 2019. Seismic velocity reduction and accelerated recovery due to earthquakes on the Longmenshan Fault[J]. Nature Geoscience, 12(8): 387-392.
DOI URL |
| [32] |
Peng Z G, Ben-Zion Y. 2006. Temporal changes of shallow seismic velocity around the Karadere-Duzce branch of the North Anatolian Fault and strong ground motion[J]. Pure and Applied Geophysics, 163:567-600.
DOI URL |
| [33] | Poupinet G, Ellsworth W L, Frechet J. 1984. Monitoring velocity variations in the crust using earthquake doublets: An application to the Calaveras Fault, California[J]. Journal of Geophysical Research: Solid Earth, 89(B7): 5719-5731. |
| [34] |
Qian J W, Zhang H J, Westman E. 2018. New time-lapse seismic tomographic scheme based on double-difference tomography and its application in monitoring temporal velocity variations caused by underground coal mining[J]. Geophysical Journal International, 215(3): 2093-2104.
DOI URL |
| [35] | Schaff D P, Beroza G C. 2004. Coseismic and postseismic velocity changes measures by repeating earthquake[J]. Journal of Geophysical Research: Solid Earth, 109(B10): B10302. |
| [36] |
Snieder R, Grêt A, Douma H, et al. 2002. Coda wave interferometry for estimating nonlinear behavior in seismic velocity[J]. Science, 295(5563): 2253-2255.
PMID |
| [37] | Thurber C H. 1983. Earthquake locations and three dimensional crustal structure in the Coyote Lake area, central California[J]. Journal of geophysical Research: Solid Earth, 88(B10): 8226-8236. |
| [38] |
Um J, Thurber C H. 1987. A fast algorithm for two-point seismic ray tracing[J]. Bulletin of the Seismological Society of America, 77:972-986.
DOI URL |
| [39] |
Wang D Q, Chu R S, Yang H, et al. 2018. Complex rupture of the 2014 MS6.6 Jinggu earthquake sequence in Yunnan Province inferred from double-difference relocation[J]. Pure and Applied Geophysics, 175:4253-4274.
DOI URL |
| [40] |
Zhang H J, Thurber C H. 2003. Double-difference tomography: The method and its application to the Hayward Fault, California[J]. Bulletin of the Seismological Society of America, 93(5): 1875-1889.
DOI URL |
| [41] |
Zhang H J, Thurber C H. 2006. Development and applications of double-difference seismic tomography[J]. Pure and Applied Geophysics, 163:373-403.
DOI URL |
| [42] |
Zhang X, Zhang H J. 2015. Wavelet-based time-dependent travel time tomography method and its application in imaging the Etna volcano in Italy[J]. Journal of Geophysical Research: Solid Earth, 120(10): 7068-7084.
DOI URL |
| [1] | 李翠平, 唐茂云, 郭卫英, 王小龙, 董蕾. 荣昌及周边三维速度结构初步研究[J]. 地震地质, 2022, 44(1): 205-219. |
| [2] | 尹欣欣, 蒋长胜, 蔡润, 郭祥云, 姜丛, 王祖东, 邹小波. 云南漾濞地区地壳层析成像与地震精定位[J]. 地震地质, 2021, 43(4): 864-880. |
| [3] | 罗仁昱, 陈继锋, 尹欣欣, 李少华. 青海共和及周边地区的地壳三维速度结构[J]. 地震地质, 2021, 43(1): 232-248. |
| [4] | 李霞, 陈时军, 张正帅, 戴宗辉, 李小晗, 卢仲斌. 山东庙岛群岛地区P波三维速度结构反演与2017年震群的发震构造分析[J]. 地震地质, 2020, 42(5): 1188-1204. |
| [5] | 张娜, 赵翠萍, 李春宏, 周连庆. 基于加密观测的金沙江下游水库区速度结构成像[J]. 地震地质, 2019, 41(6): 1380-1394. |
| [6] | 谢张迪, 韩竹军. 2014年云南景谷MS6.6地震发震断层及其动力学参数[J]. 地震地质, 2019, 41(4): 887-912. |
| [7] | 毛泽斌, 常祖峰, 李鉴林, 常昊, 赵晋民, 陈刚. 景谷M6.6地震震中区断裂晚第四纪活动[J]. 地震地质, 2019, 41(4): 821-836. |
| [8] | 曲均浩, 王长在, 刘方斌, 周少辉, 郑建常, 李新凤, 张芹. 乳山序列地震分布与震源区速度结构的关系[J]. 地震地质, 2019, 41(1): 99-118. |
| [9] | 韩晓明, 刘芳, 张帆, 陈立峰, 李娟, 李拴虎, 杨红樱. 鄂尔多斯块体东北缘的P波速度精细结构[J]. 地震地质, 2018, 40(1): 215-231. |
| [10] | 刘月, 邵志刚. 2014年云南景谷MS6.6地震前地震活动变化分析[J]. 地震地质, 2016, 38(4): 1070-1081. |
| [11] | 程远志, 汤吉, 邓琰, 董泽义. 云南景谷MS6.6地震震源区深部电性结构及其孕震环境[J]. 地震地质, 2016, 38(2): 352-369. |
| [12] | 罗佳宏, 马文涛. 三峡库区上地壳速度结构初步研究[J]. 地震地质, 2016, 38(2): 329-341. |
| 阅读次数 | ||||||
|
全文 |
|
|||||
|
摘要 |
|
|||||
